LINKING FISH TRAITS AND DISTRIBUTION WITHIN HETEROGENEOUS
STREAM LANDS CAPES: INTRA-SPECIFIC V ARIA TI ON AND HABIT AT
SELECTIVITY
THESIS
PRESENTED
AS A PARTIAL REQUIREMENT
FOR THE DOCTORA TE IN BIO LOG Y
BY
BAILEY JACOBSON
Avertissement
La diffusion de cette thèse se fait dans le respect des droits de son auteur, qui a signé le formulaire Autorisation de reproduire et de diffuser un travail de recherche de cycles supérieurs (SDU-522- Rév.01-2006). Cette autorisation stipule que «conformément à l'article 11 du Règlement no 8 des études de cycles supérieurs, [l'auteur] concède à l'Université du Québec à Montréal une licence non exclusive d'utilisation et de publication de la totalité ou d'une partie importante de [son] travail de recherche pour des fins pédagogiques et non commerciales. Plus précisément, [l'auteur] autorise l'Université du Québec à Montréal à reproduire, diffuser, prêter, distribuer ou vendre des copies de [son] travail de recherche à des fins non commerciales sur quelque support que ce soit, y compris l'Internet. Cette licence et cette autorisation n'entraînent pas une renonciation de [la] part [de l'auteur] à [ses] droits moraux ni à [ses] droits de propriété intellectuelle. Sauf entente contraire, [l'auteur] conserve la liberté de diffuser et de commercialiser ou non ce travail dont [il] possède un exemplaire.»
LIER LES TRAITS DES POISSONS ET LEURS DISTRIBUTIONS À
L'INTÉRIEUR DE PAYSAGES HÉTÉROGÈNES DE COURS D'EAU: VARIATION INTRASPÉCIFIQUE ET SÉLECTIVITÉ DE L'HABITAT
THÈSE
PRÉSENTÉE
COMME EXIGENCE PARTIELLE
DU DOCTORAT EN BIOLOGIE
PAR
BAILEY JACOBSON
Neto, for the oppmtunity to have learned and benefited from his amazing guidance, knowledge and training. His support, patience and wisdom have been and will continue to be invaluable; I could not have asked for a better superviser, truly, thank you. I would also like to thank co-authors Frédérique Dubois and James Grant for their role in and help with shaping two of the chapters presented in this thesis. I would like to recognize my labmates, past and present, whose support and friendship I will al ways cherish: Caroline Sena y, Marie-Christine Bellemare, Renato Henriques Da Silva, Mehdi Laygefhardi, Frédéric Boivin, Andrew Smith, Wagner Moreira, Marie-Hélène Greffard, Who-Seung Lee, Shubha Pandit and Richard Vogt, as well as hard working field assistants who were invaluable in helping to collect experimental data: Joachim Prunier, Ève-lyne Grenier and Christine Larouche. Finally, I would like to send a sincere heartfelt thank you to my parents Barbara and Paul Jacobson for their unwavering support, patience and encouragement which helped to make this thesis a realization.
This thesis was funded by both an NSERC and FQRNT research grant awarded toP. R. Peres-Neto as well as UQAM FARE scholarships (Bourses du Fonds à
l'accessibilité et à la réussite des études) awarded to B. Jacobson.
" Nature is a language and every new fact one learns is a new ward; but it is not a language taken to pieces and dead in the dictionary, but the language put together into a most significant and universal sense. 1 wish to learn this language- not that 1 may know a new grammar, but that 1 may read the great book which is written in that tangue."
LIST OF TABLES ... .ix
RESUMÉ ... xi
SUMMAR Y ... xiii
INTRODUCTION ... 1
0.1 Trait-based ecolo gy and landscape distribution ... 1
0.2 Intra-specific variation and the functionality of phenotype ... 3
0. 3 The use of streams and stream-fish ... 5
0.4 The use of geometrie morphometrics ... 6
0.5 Thesis outline ... 8
CHAPTERI THE INTERACTION BETWEEN THE SPATIAL DISTRIBUTION OF RESOURCE PATCHES AND POPULATION DENSITY: CONSEQUENCES FOR INTRA-SPECIFIC GROWTH AND MORPHOLOGY ... 11
1.1 Summary ... 11
1.2 Introduction ... 12
1.3 Materials and methods ... 16
1.3 .1 Species and experimental set-up ... 16
1.3 .2 Experimental procedure ... 18
1.3.3 Dataanalyses ... 19
1.4 Results ... 21
1. 5 Discussion ... 26
1.5.1 Inter-treatment growth patterns: variance and competition ... 26
1.5 .2 The influence and shaping of phenotype ... 29
CHAPTERII
POPULATION DENSITY AND NON-RANDOM PHENOTYPE-DEPENDENT HABITAT SORTING: THE CASE OF STREAM-FISHES ... oo ... oooooooooooo33 2.1 Summary ... ooooooooo ... oo.oooooooooo .. ooooo ... oo .... oo .. oo•··oo·oo····oo···oo·oo·oo···oo··oo···oo···33 2.2 Introduction .. 0000 000 ... 00 ... 0000.0000 00.00 oooooooooooo· 00 oooo· oo·. 00.00. 00 .. 00 00 00.00 000 ... 00 .. 00 ... 00000 34 2.3 Experimental trials .. oo.oo .. oo .. oo .. oo ... oo .. oooo····ooooooo .. oo .. oo.oo•oo••oo···oooo·oo···oo···oo····ooooooooooo38
2.3.1 Materials and methods oo•oo••oo···oo···oo·oo···oo·•oo•oo•oooo•oo••oooo···oo···oo··· .. oooooooo•oo··oo··38 2.3.1.1 Species collection and artificial stream set-upoo .. oooooooooooooooooooooooooooooooooooo38 2.3 .1.2 Experimental procedure and data anal y sis .... 00.00 ... 00 ... 00.00 ... 00. oo. 00 .... 00 .. 00 00.40 2.3.1.2.1 Density effects and morphological analysisoooooooooooooooooooooooooooooooooooo41 2.3 .1.2.2 Habitat manipulations OOOOOOOOOOooOOOOooOOOOOOOOOOOOOOooOOOOOOOOoooooooo 000000000000000000.42 2.3.2 Results .. oo ... oo ... oo .. oo .. oo .. oo····oooo·oo··oo·oo·oo·oooo·oo·oo·oo···oo···oo· ... oo .. 43 2.3.2.1 Density effects ... oo.·oo·oo··oo•oooo ... oo.··ooooooooooo ... oo ... oo ... 43 2.3.2.2 Habitat manipulations .oo .. oooooo ... oo.oo .. oo .. oo .. ooooo .. oo ... oo.oo ... oo ... oo.47 2.4 Frequency-depedent game madel .. oo ... oo.oo ... oooo···oo·oo·oo·oooo ... oo ... oo .... oo .... oooo.48 2.4.1 Madel outline ... oo.oo ... oo ... oooo····oo·oo····oooooooo ... oo ... oo ... oo ... 48 2.4.2 Madel results oo.oo ... oo.oooo ... oo.oo ... oo ... oo ... oo ... oooo .. 51 2.5 Discussion oo•oo··oo ... oo.oo ... oo ... oo .... oo .... oo ... oo ... oo ... oo .. oooo ... oo .. 54
2.5 .1 Generalities: influence of morphology for habitat selection ... 0000 ... 00 0000 54 2.5 .2 Species specifies: individual and habitat properties for section use .. 000000 .. oo .. 56 2.5.3 Evolutionary and ecological conclusions ... oo.oooo .... oo ... oo .. oooooo .. oo.oo57 CHAPTERIII
THE TEMPORAL TRAJECTOR Y OF COMMUNITY TRAIT RE-ASSEMBL Y: MORPHOLOGICAL TRENDS AS A FUNCTION OF HABITAToooooooo ... oo ... oo .. 59 3.1 Summary ... 00 ... 00 ... oo. oo•. 00.00 .. oo. 00 ... 000 .. oo•. oo .. oo• oo• ... 00 .... 0000 .. 0000 .. ·oooo. 59 3.2 Introduction .. 00 .. 00 00 00.00 .. 00 ... 00 .. 00 .. 00 ... 00.00. 00 ... 00 00 ... 00.00 ... 00.00 ... 00 ... 00.00 .. 00 00.60 3.3 Materials and methods .. oo ... ooooooooooooooo····oooooooooo ... oo····oo··oo·oo··ooooooo···oooo.64 3.3.1 Stream measurements and site characterizationoooooooooo·oo•oooooooooo ... oooooooo•oooo .. 64 3.3.2 Stream clearing and re-assembly samplingoooo··oo·oo·oo ... oooooooooooo ... oo ... oo .. 66
3.3.3 Data analysis ... 69
3.3.3.1 Overall morphological trends ... 71 3.3.3.2 Within community trait patterns ... 71
3.4 Results ... 73
3.4.1 Overall morphological trends ... 73
3.4.2 Within community trait patterns ... 77
3.5 Discussion ... 79
3.5 .1 Re-assembly of the stream community ... 79
3.5 .2 Species-level structure and intra-specific variation ... 80
3.5.3 Synthesis and next steps for trait-based community assembly ... 82
CHAPTERIV QUANTIFYING AND DISENTANGLING DISPERSAL IN MET ACOMUNITIES: HOW CLOSE HAVE WE COME? HOW FAR IS THERE TOGO? ... 84
4.1 Summary ... 84
4.2 Introduction ... 85
4.3 Dispersal: differentiating and locating ... 87
4.4 Measuring dispersal: direct versus indirect methods ... 90
4.5 Measuring dispersal: the metapopulation view ... 92
4.5.1 Direct methods ... 92
4.5.2 Indirect methods ... 95
4.6 From metapopulation to metacommunity dispersal ... 99
4.7 Current challenges and considerations ... 102 4.8 A wishlist and future technical advancements ... 1 06 CONCLUSIONS ... 1 09 REFERENCES ... 113
1.1 Species and spatial resourc~ distributions. A) Young-of-the-year rainbow trout with 22 landrnarks used within morphological analyses, curved arrows denote locations of body and caudal width caliper measurements. B) Photo and schematics of spatial resource distributions tested; D is distributed, S semi-clumped and C clumped. Flow denotes the direction of water
movement through channels, water depth was approx 18cm, resource patch depth 1.1 cm. All measurements within figure are in cm ... 17 1.2 Results from mixed-model ANOVAs of growth outcomes of trials.
A) Growth (Ginct) outcome for trials as a function of spatial and density treatments. B) Variance in growth (Gvar) outcome for trials as a function of spatial and density treatrnents. Open circles denote high density, filled low density trials, error bars are 95% confidence intervals ... 22 1.3 Spatial feedirig dynarnics of individuals throughout the first 15 min of
feeding. Shading is based on the number of seconds within 1 min that at
least 'li body length of at !east one individual was within the resource patch .... 24
1.4 Morphological differences between individuals with negative or positive (less or greater) growth relative to their trial average (Gre!) as a function of pre-or post-trial morphology. In order to highlight differences variation is depicted at lüx the observed range ... 25
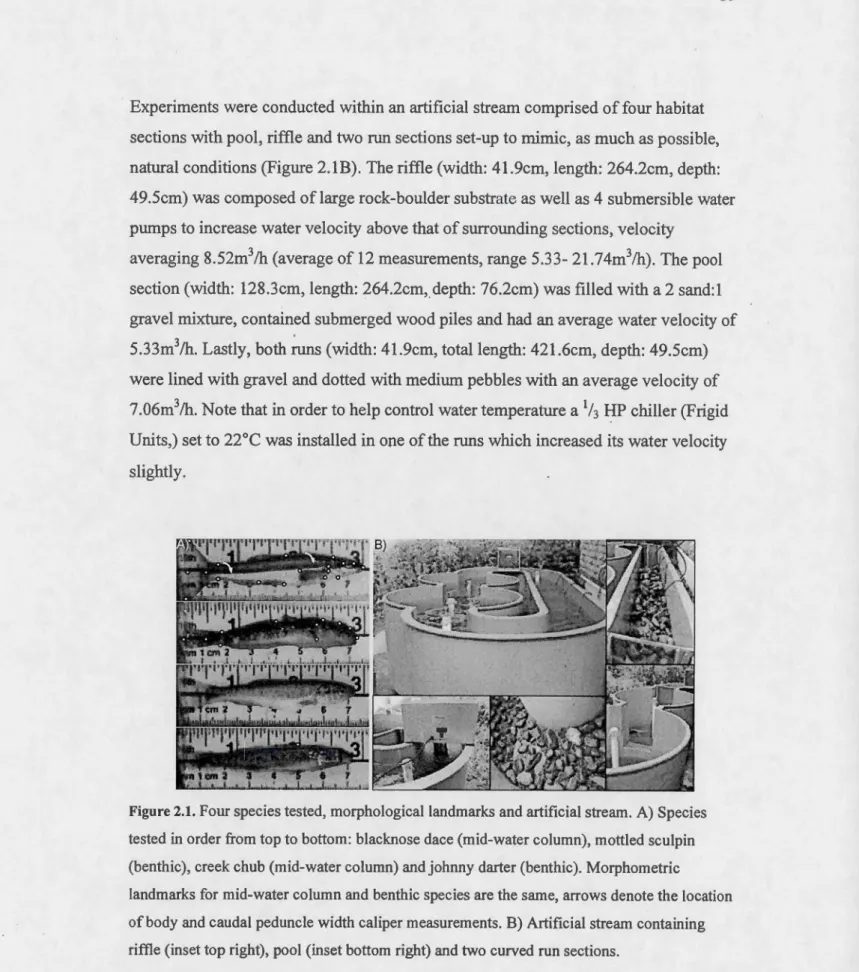
2.1 Four species tested, morphologicallandrnarks and artificial stream. A) Species tested in order from top to bottom: blacknose dace (mid-water colurnn), mottled sculpin (benthic), creek chub (mid water colurnn) and johnny darter (benthic). Morphometric landmarks for rnid-water colurnn and benthic species are the same, arrows denote the location of body and caudal peduncle width caliper measurements. B) Artificial stream
containing riffle (inset top right), pool (inset bottom right) and two curved run sections ... 39
Figure Page
2.2 Habitat selection and morphological discrimination outcomes of density trials. Points represent replicate average per density level. A) Graph
showing habitat section use across densities. Alternative habitat denotes the cumulative number of individuals in the 3 non-original habitat sections. B) Graph of the degree of morphological distinction between individuals selecting different habitat sections from DF As. Note when only a single
DFA could be conducted per density level, pointis not averagedoooooooooooooooooooooo44
2.3 Representative deformation grids ofblacknose dace showing relative
morphological variation within and across density levels between individuals selecting original versus alternative habitat sections. For each section top grid is original and bottom alternative habitat, visualization is 3x relative
differences ... 4 7 2.4 Effects of population size on: i) the expected proportion of both phenotypes
in habitat 1 (panels A, C, E) and ii) the absolute difference in the mean trait between the two habitats (panels B, D, E). In all panels: ÀA1=0.8, CA=l, C8=1 and a.,=O.l and EA=O.O. In panels A and B: À-81=0.8, a.2=0.l and c8=0.0; in panels C and D: )..81=0.4, a.2=0.l and c8=0.5; in panels E and F: )..81=0.2,
a.2=0.3 and cs=O.O oo···oo•oo···oo .. ooooooooooooooo•••oooo•oo••·oo··oo····oo···oooo ... 53
3.1 The defaunated stream reach and the species found within. A) Stream reach where orientation and drawing is based on GPS coordinates of transects, and dark grey boxes are riffle, light grey run and white pool habitat sections; stars denote areas of release. B) All species collected across samplings, see text for common names represented by species codes. The two bottom species were removed from morphological analyses, morphometric landmarks within
CrkChb were the same for all species 0 0 . 0 0 0 0 . 0 0 • • • • • •••• •• 0 0 0 0.0 0 •• 0 0 0 0 0 0 .0 0 . 0 0 0 0 ••• • 0 0 ••••• • 0 0 .0 0 . . 0 0 68 3.2 Morphological differentiation between habitat types as per DF As.
Deformation grids show relative differences as a function ofDFl where
visualization for all is the observed rangeoooooooooooooooooooooooooooooooooooooooooooooooooooooooooo.74
3.3 Overall morphological changes through sampling period as per DF As. Panels A, CandE show all data points (individuals) within the analysis, panels B, D and F show the average score for each sampling as a function of habitat type to better visualize trajectory for the stream community (A
Figure Page 3.4 Results from two-way ANOV As of assembly metrics as a function of time
and habitat type. Metrics average distance (panels A, C and E) and average NND (nearest neighbour distance; panels B, D and F) are shawn for the stream community (A and B), longnose dace (B and C) and creek chub (E and F) ... 78 4.1 Forms of indirect connectivity metrics. Various forms of connectivity
metrics used for the indirect quantification of dispersal in metapopulations; two different categories are represented, structural a) and potential b )-d). a) Nearest neighbor metric. Star denotes focal patch, arrow represents dispersal between ail patch es un der consideration, only the nearest patch. b) Graph theoretic metric. Patches differ as data is obtained from GIS, potential
connections between ali combinations of patches are considered, dashed arrows represent connections not established because outside of focal species dispersal range. c) Incidence function metric. Ali combinations ofpatches which are occupied are considered, here light coloured patch denotes empty. d) Buffer radius metric. The area of ail occupied patches which fail within the dispersal range of the focal species are considered, dispersal range represented by
dashed circle. Adapted from Calabrese and Fagan (2004) ... 97 4.2 Variation partitioning. Theoretically the amount of variation in community
composition, represented by the area within the box, explained by: a) components within the original variation partitioning technique, where E represents environrnental variables and S spatial variables; b) the components of the extended variation partitioning technique where D, dispersal, is added thereby explaining additional community variance not accounted for by a). Size and degree of overlap among circles in both a) and b) do not reflect the amount of variation that is explained as realistically not all components will be equal. Adapted from Borcard et al. (1992) ... 1 04 4.3 Partial systems and shifting influences. Three different forms of a system,
complete system is all interconnected patches (CS), partial system (PS) are .dark colored patches and the light colored patches are the rest of the system
(RS). PS is that under consideration within a study and therefore only solid arrows are considered, dashed arrows are dynarnics which occur outside of consideration. a) edge effects, patches within PS are still affected by immigration and emigration from the RS. b) temporal heterogeneity where over time the part of the system which is influenced by a variable, patches with white centers, shifts. Although outside of the area of consideration the variable still affects bath the CS and indirect! y the PS through dispersal ... 1 06
1.1 F-values from mixed-model ANOVAs regarding the influence oftreatment type and morphology on within-trial growth. Numbers in brackets are
degrees of freedom. 00.00 .. 00 00 ... 00 ... 00 00.00 00 ... 00 00 .. 00.00 .. 00 00 ... 00 00.00 00 ... 00 .. 00 ... 00 ... 23 1.2 Correlation coefficients (r) from regressions ofthe relationship between
individual growth (Gind) and initial size variables. D is distributed, S serni-clumped and C serni-clumped spatial resource distributions; numbers in brackets are the combined number of individuals in the replicates of that treatment type ... 25 2.1 Habitat selection and morphological discrimination outcomes of density
trials. Original is riffle for the first two species and pool for the last,
Alternative refers to the cumulative number of individuals in remaining three habitat sections, n is the number of these sections utilized and morphology the degree of discrimination (1-Wilks' lambda) based on DF As. All morphology is significant at p~0.05 except for the value in italics 0000000000000000000000000000000000000000000.45 2.2 F-values from univariate ANOVAs ofthe influence oflength, body and
caudal width for habitat selection. Numbers in brackets are the degrees of freedom within tests of that .replicate. 00000 .. 00 .. 00 00 .. 000 00. oo •• 00 .. 00000 000 000 ... 00.00 00 0000000 ... .46 2.3 Outcomes of habitat manipulations and resultant morphological
considerations. Original is riffle for the frrst two species and pool for the last, Alternative refers to the cumulative number of individuals in remaining three habitat sections, n is the number of these sections utilized. x2 is the result of contingency table analysis, morphology the degree of discrimination (1-Wilks' lambda) based on DFAs .. oo •• ooooooo···oo•oo•oo••oooooooooooooooooooooooooooooo·oo···oo··oo··oo····oooo4 8
3.1 Average environmental characteristics of the habitat sections (sites) delineated within the defaunated stream reach. Transects are the number conducted within the site, averaged for the values presented. For substrate composition: B is boulder, R rock, P pebble, G gravel, S sand, W wood and Macro macrophytes. 00 00 00 .. :00 00 00 00 00 00 00 00 00 00 ... 00.00 00.00 .. 00.00 ... 00 00 .. 00 ... 00 .. 00 00 00 00 .. 00 00 66
Table Page 3.2 Species incidences as a function of the habitat section and sample in which
they were collected. See text for cornrnon names represented by species codes. Initial is the pre-defaunation cornrnunity, Sl-S4 re-assembly sampling 1-4 respectively ... : ... 70 3.3 Habitat differentiation and morphological trajectory outcomes of
discriminant function analyses. Ail values are significant at p:S0.05 expect tho se in italics ... · .. 77 3.4 F-values from two-way ANOVAs regarding the influence oftime, habitat
and the time x habitat interaction on assembly metrics. Numbers in brackets are the degrees of freedom. A vg dist. is the me tric average distance, NND the average nearest ~eighbour distance ... 79
processus sous-jacents. Alors que les études passées s'appuyaient principalement sur 1 'identité des espèces, les approches actuelles se basent sur un intérêt renouvelé envers les traits des espèces. Les approches basées sur les traits permettent une compréhension fonctionnelle de la structure des communautés et des populations et de leurs liens avec l'environnement ainsi qu'une généralisation plus aisée des résultats. Un des facteurs dont le rôle est peu considéré, mais ayant le potentiel d'influencer la distribution des individus et la structure des communautés de façon importante, est la variation intraspécifique. En effet, même si la variation entre individus est reconnue comme étant potentiellement adaptative étant donné que les filtres biotiques et abiotiques agissent au niveau de 1 'individu, la plupart des études centrent leurs explorations sur la moyenne des traits par espèce et les différences interspécifiques. À cet effet, l'objectif de cette thèse était d'explorer la fonctionnalité potentielle de la variation intraspécifique et d'examiner à quel point le phénotype des individus influence leurs distributions dans diverses conditions environnementales. Les cours d'eau et les poissons y résidant sont d'excellents sujets pour ce type d'analyses. En effet, les cours d'eau sont des habitats hautement variables tant spatialement que temporellement contenant des sections présentant des pressions sélectives différentes restreignant potentiellement les phénotypes pouvant s'y trouver. Cette thèse comprend quatre chapitres, trois expérimentaux et un théorique. Le chapitre I explore l'interaction entre la distribution spatiale des ressources et la densité de la population sur la génération de variation de croissance à 1 'intérieur d'une espèce. Le chapitre II se penche sur la façon dont les individus avec différents phénotypes diffèrent dans leurs décisions non aléatoires de se déplacer et dans leurs sélections d'habitats en fonction de la densité de la population. Le chapitre III explore le potentiel pour une telle sélection d'habitats en fonction du phénotype de s'opérer au niveau de la communauté, et ce, en observant l'assemblage des communautés de différentes sections d'habitats d'un tronçon d'un cours d'eau en fonction du temps. Finalement, le chapitre IV considère les mouvements à une échelle plus large que le cours d'eau et explore la dispersion dàns les métacommunautés. Ce chapitre met en perspective les difficultés auxquelles font face les chercheurs dans la quantification de la dispersion et dans la distinction de ce processus des autres facteurs pouvant générer des signaux spatiaux. Les résultats de ces chapitres montrent que les variations de croissance à l'intérieur d'une .espèce peuvent découler de l'interaction entre la distribution des ressources et la densité. De plus, la morphologie des
individus influence leur capacité compétitive et ceux-ci ont l'habilité de sélectionner leurs habitats en fonction de leur capacité de nage et de la densité. En ce qui a trait aux communautés, l'assemblage des phénotypes suit une trajectoire déterministe par rapport à la nature des habitats. Ainsi, cette thèse démontre que la variation
intraspécifique joue un rôle fonctionnel dans la façon dont les individus se distribuent dans les paysages hétérogènes et qu'autant les facteurs biotiques qu'abiotiques peuvent influencer cette distribution.
Mots clés :Dispersion, métacommunautés, sélection d'habitats dépendante du
phénotype, densité de population, distribution spatiale des ressources, assemblage des communautés basée sur les traits
across heterogeneous landscapes. While past studies were largely based on species · identities, currently there has been a renewed interest in the use oftrait-based
approaches. Such a trait-based ecology allows for bath a functional understanding of community or population structure and its link with the environment as well as results that are more easily generalized. One important factor influencing distribution and structure which remains underappreciated is the role of intra-specific variation; species trait means and inter-specifie differences stilllargely the focus despite individual variation being recognized as potentially adaptive and the individual-level that at which both biotic and abiotic filtering actually occurs. To this end, the goal of this thesis was to further explore the potential functionality of intra-specific variation and investigate the degree to which an individuals phenotype influences its
distribution within and across different environmental conditions. An excellent system is provided by the use of streams and stream-fish, streams highly spatially and temporally heterogeneous with habitat sections that place very different selective pressures on the phenotypes able to be present within. This thesis is comprised of four chapters, 3 experimental and one perspective. Chapter I investigated the interaction between the spatial distribution of resource patches within a section and population density for generating intra-specific growth variation; Chapter II then explored how individuals with differing phenotypes may use non-random movement and phenotype-dependent habitat selection for sorting across habitat sections as a function of density, with chapter III exploring the potential for such phenotype sorting to occur at the community leve!, across habitat sections within a stream reach and as a function of time through community assembly. Las tl y, chapter IV shifts from considerations of movement within streams to larger scale dispersal within
metacommunities, discussing the potential difficulty facing researchers in quantifying dispersal and disentangling it from other factors which produce spatial signatures. Results from these chapters show that intra-specific growth variation can be produced by the interaction between resource distribution and density where competitive ability is based on morphology, and that individuals have the ability to use phenotype-dependent habitat selection as a function of density and swimming capacity; at the community leve! phenotypes sorting across habitats and following a deterrninistic assembly trajectory. Thus this thesis shows that intra-specific variation plays a functional role in determining individual distribution across heterogeneous landscapes and that bath biotic and abiotic factors act to structure distribution.
Keywords: Metacommunity dispersal, phenotype-dependent habitat selection, population density, spatial resource distribution, trait-based community assembly
Ecologists, population and cornmunity alike, have long been interested in investigating the patterns in, and understanding the processes underlying, the distribution of species and individuals across heterogeneous landscapes. In the past, studies to this end largely focused on, and reported, species identities white
describing the presence/absence of species and differing abundances of individuals across different environrnental conditions. Such a use of species names, however,.left the results found and conclusions drawn both highly contingent on the species pool and system investigated, as weil as relied heavily on the researchers' (and readers) knowledge of the ecology of the particular species in order to understand its patterns of distribution (McGill et al., 2006; Weiher and Keddy, 1995).
Currently, ecology is seeing a renewed interest in, and a resurgence of the use of, trait-based approaches, proposed as a way to overcome such previous contingencies. Here, rather than species identities, traits and in particular functional traits, defined as any morphological, physiological or behavioural feature which influences organism performance (Frimpong and Angermeier, 201 0; McGill et al., 2006; Violle et al., 2007, 20 12), are measured and linked to distribution within and across the landscape. As different species within the same environrnent may share similar traits (e.g., fusiform body morphology of stream-fish within high-flow areas; Gatz, 1979; Leavy and Bonner, 2009), or individuals of the same species across different environrnents may differ ( e.g., resource polymorphisms; Smith and SkUlason, 1996), trait-based studies allow both a functional understanding of cornmunity or population structure and its link with environrnental characteristics, as weil as provide results that are
potentially generalizable beyond the particulars of the species pool and system investigated (Mc Gill et al., 2006; Weiher and Keddy, 1995).
Just how species and individuals, and in association traits, become distributed across heterogeneous landscapes and are ultimately found within observed comrnunities and populations is conceptualized as being based on their ability to pass through a series of hierarchical selective filters. First, at the regional scale, individuals which are part of the regional species pool must be able to arrive at, disperse into, a location (i.e., habitat patch) (Tonn, 1990). Species, then, must first pass through an abiotic
( environrnental/habitat) fil ter, which itself may select at multiple spatial and temporal scales, restricting the presence of species and range of traits to on1y tho se adapted to the habitat patch conditions (Poff, 1997; Tonn, 1990), be fore finally passing through a biotic fil ter ( e.g., competition) which acts to lirnit the sirnilarity of individuals and traits ultimately present within the patch (Cornwell and Ackerly, 2009; Jackson et al., 2001; Poff, 1997; Vi olle et al., 20 12).
While it is the influence of the fmal biotic filter which bas formed the basis of much of ecological theory in the past, competition considered the main structuring
mechanism, it is now recognized that the abiotic filter may also play a large role in determining comrnunity and population structure (Grossman and Sabo, 2010); studies conducted at larger scales or within more harsh (selective) environrnents (e.g.,
increased disturbance, decreased productivity) finding a greater relative role of abiotic versus biotic influences (Fukami and Lee, 2006; Jackson et al., 2001; Peres-Neto, 2004). Indeed investigations of the relative role of different filters now underlie several frameworks, metacomrnunity theory interested in the relative role of space (used as a proxy for dispersal) and the environrnent in structuring large scale
distribution (Cottenie, 2005; Leibold et al., 2004), comrnunity assembly studies in the relative role of habitat filtering and limiting sirnilarity in structuring trait variances
(range and spacing) (Corn weil et al., 2006; Kraft et al., 2008), habitat selection in the role of density for the use of optimal versus suboptimal habitats (Morris, 2003;
Rodriguez, 1995).
0.2 Intra-specific variation and the functionality of phenotype
Despite the renewed interest in trait-based ecology, one impa.rtant factor influencing individual distribution and comrnunity structure which remains underappreciated, and is stilllargely overlooked, is the role and presence of intra-specific variation. Indeed much of ecology describes and compares species based on mean trait values (Albert
et al., 20 lOb; Bolnick et al., 2003; Comwell and Ackerly, 2009; Messier et al., 201 0),
where average values are often computed using individuals found throughout the landscape, across the environmental gradient studied ( e.g., Comwell et al., 2006; Siefert, 2012). Such an averaging, however, assumes that all individuals can be considered equivalent and interchangeable and that any variation that exists across this gradient has no ecological consequences (Bennett, 1987; Bolnick et al., 2003,
2011); the use and comparison of species means within comrnunity ecology irnplying that it is at the species leve! at which abiotic and biotic filtering occurs.
Of course, however, conspecifics cannat be considered equivalent, populations of the same species located at different points along environmental gradients found to have different mean trait values, intra-specific variation responsible for shifting trait values as a function of the environment (Cornwell and Ackerly, 2009; Jung et al., 2010; Siefert, 2012); variation due to underlying genetic diversity and/or phenotypic p1asticity (Jung et al., 2010; Siefert, 2012; Vialle et al., 2012). In addition, not only do populations vary across the landscape but so do individuals within a population, where this variation is increasing1y recognized as potentially adaptive (Halama and
Reznick, 2001 ). lndeed, overall population niche width is a function of su ch
individual variation, individuals specialized and trading-off for the use of a specifie subset of the resources or environments used by the population as a who le (Bolnick et al., 2003; Futuyma and Moreno, 1988; Robinson et al., 1996) where even subtle morphological differences, detectable on1y with the use of multivariate statistics, have
•
significant consequences for individual fitness and distribution (Halama and Reznick, 2001; Robinson et al., 1996).
It is at this jndividual-level, then, and not the average species-1evel, that both interactions within the population or community occur, intra-specific competition stronger than inter-specifie, as well as the level at which environmental selection and sorting takes place (Clark, 2010; Jung et al., 2010; Siefert, 2012; Violle et al., 2012). As su ch, the goal of this thesis was to further explore the potential functionality of intra-specific variation and investigate the degree to which an individuals phenotype influences its distribution within and across different environmental conditions. Here, such phenotype-habitat relationships were explored at three different levels: 1) the distribution of individuals with respect to resource distribution, 2) the habitat
selection of individuals among habitat types; and 3) the assembly of communities and re-colonization of individuals as a function of habitat selectivity.
As within this thesis research was conducted using streams and stream-fish as a model system and using geometrie morphometrics as the method with which to capture/analyze functional morphology, these topics serve as the basis of the following sections. Here, specifies regarding stream habitat characteristics and the association and sorting of fish functional traits are also discussed. Lastly, the final section of this introduction outlines each of the chapters which comprise this thesis as well as how they connect to each other.
0.3 The use of streams and stream-fish
The use of streams and stream-fish provide the perfect system in which to explore the potential relationships between habitat characteristics and the distribution decisions made by, and functional morphology of; the individuals and species within. Indeed streams are highly spatially heterogeneous, composed of discrete habitat sections
which can be easily visually identified based on differences in depth, water flow and substrate composition; riffles shallow areas ofhigh water velocity over often rock-boulder substrate, pools deep areas of slow current composed of sand and runs intermediate between the two (Brown and Brussock, 1991; Lamoureux and Cattanéo, 2006; Rodriguez, 1995). Such sections can be found to regularly repeat, nested within the larger stream reach, and thus provide for natural replicates; note this hierarchical structure extends across multiple scales, microhabitats nested within sections, reaches nested within stream segments, segments within stream systems and so on, and thus there exist multiple abiotic filters (Frissell et al., 1986; Poff, 1997). In addition streams are also temporally heterogeneous, varying most notably in water flow (i.e., drought versus flood), where the impacts of this highly structuring variable
(Grossman and Sabo, 201 0; Hoeinghaus et al., 2007; Poff and Allan, 1995) are most felt within riffles, pools less disturbed by periods of high flow as well as un der less risk of drying during drought (Brown and Brussock, 1991). Here it is worth noting that due to such strong abiotic pressures it has been questioned within such systems whether biotic factors in fact play a role in structuring distribution (Jackson et al., 2001; Peres-Neto, 2004).
Very different selective pressures are thereby placed upon the individuals and species found within the different habitat sections, strong species and phenotype-habitat associations found despite such fluctuations (Belica and Rahel, 2008; Lamoureux and Cattanéo, 2006; Poff and Allan, 1995; Pyron and Lauer, 2004). Indeed due to
increased water flow and in association energetic demands, riffle sections are perhaps more selective than pools, requiring individuals within to have a greater swimming capacity and/or the ability to hold station (Lonzarich et al., 1998; Rodriguez, 1995). Such swimrning requirements are found to be reflected in the morphology of individuals found within such areas, mid-water column riffle species having streamlined fusiform body shapes and larger forked caudal fms reflecting their increased swimming capacity (Gatz, 1979; Leavy and Bonner, 2009), benthic species often having wider pectoral fins adapted for the use of braking upon the substrate (Facey and Grossman, 1992; Gatz, 1979). Pool species, on the other hand, instead often have laterally-compressed deeper bodies allowing for their increased
maneuvering and turning stability (Gatz, 1979; Leavy and Bonner, 2009; Webb 1984). While fish move through the system, populations known to be composed of a fraction that is mobile and another stationary (Belica and Rahel, 2008; Petty and Grossman, 2004; Rodriguez, 2002; Skalski and Gilliam, 2000), such movements may then be constrained more-so for sorne species than ethers, riffle species potentially able to move through and sample ail habitats, pool species, instead found to be impeeded by the demands of riffles (Lonzarich et al., 2000; Schaefer, 2001 ); the ability of fish to be marked and re-captured allowing for the tracking of such movement patterns and distribution decisions.
0.4 The use of geometrie morphometrics
While traditionally morphological measurements in ecology have been based on various linear calculations of the length between morphological features (Douglas and Matthews, 1992; Gatz, 1979; Winerniller, 1991) this technique has se veral drawbacks where measurements (traits) are necessarily univariate, often highly correlated with each other (see Gatz, 1979), and to a large degree capture size rather than shape (Zelditch et al., 2004), although this effect can be removed through
statistical techniques (Adams et al., 2004; Douglas and Matthews, 1992; Peres-Neto and Magnan, 2004). In addition such measurements are time consuming and thus have been proposed to be best made on preserved individuals (Maderbacher et al., 2008), precluding the ability for the study of morphological change, or the release and subsequent tracking of the individual back in the system. In contrast the use of geometrie morphometrics allows the capture of morphological shape information from photographs which can be taken of anesthetized individuals, the variables produced multivariate in nature and devoid of the influence of size and has been found to be able to capture even subtle variation in shape (Kassam et al., 2003).
Indeed geometrie morphometrics uses the position within a Cartesian system of two-dimensionallandmarks placed on photographs of individuals in arder to garner shape information. Firstly landmarks are selected based on severa! criteria, that they are homologous, repeatable, have the same relative position among individuals, allow for consideration of all possible shape differences and fall within the same plane
(Zelditch et al., 2004). Next the landmarks are superimposed, in arder to factor out size, using one of severa! available methods, the most widely used, generalized orthogonalleast squares Procrustes superimposition (GLS) (used within this thesis) scales, rotates and translates the landmarks in arder to obtain the minimum sum of squared differences between the landmarks for individuals witliin the analysis (Adams et al., 2004; Rholf and Slice, 1990; Zelditch et al., 2004). Lastly, a principal component anal y sis of the rotated configurations is conducted producing partial warps, orthogonal axes which can be used as morphological variables directly within any statistical analysis where the use of deformation grids allows for the visualization of relative morphological differences (Adams et al., 2004; Senay, 2009; Zelditch et al., 2004).
0.5 Thesis outline
To re-iterate, the goal of this thesis was to explore the potential functionality of intra-specific variation and determine the degree to which this influences the distribution of individuals within and across different environmental conditions. To this end this thesis is comprised of four chapters, three experimental and one perspective:
Chapter 1: The interaction between the spatial distribution of re source patches and population density: consequences for intra-specific growth and morphology
Chapter Il: Population density and non-random phenotype-dependent habitat sorting: the case of stream-fishes
Chapter III: The temporal trajectory of community trait re-assembly: morphological trends as a function of habitat
Chapter IV: Quantifying and disentangling dispersal in metacommunities: how close have we come? How far is there togo?
Within chapter 1 the potential for the generation of variation as a function of habitat conditions was frrst explored. To this end, this chapter investigated the potential of the interaction between population density and the spatial distribution of resource patches within the landscape, a currently overlooked structuring factor, to influence the level and degree of intra-population growth (i.e., fitness) variance. Here the degree to which competitive ability was a function of morphology related to swimming ability, rather than fish size as proposed, was also explored. To do so feeding and density experiments were conducted within artificial stream channels where the degree of individual growth within a trial was linked to pre- and post-trial morphology.
Chapter II then explored how individuals with differing phenotypes may sort themselves across habitat conditions. Here the potential for non-random movement and phenotype-dependent habitat selection to account for the phenotype-habitat correlations that are found within temporally varying streams was investigated, as well as the degree to which this mechanism may influence distribution as a function of population density (i.e., intra-specific competition). To this end density
manipulations were conducted within an artificial stream comprised of multiple habitat types using stream-fish collected from a single original section. This chapter also explored the degree to which distribution may be influenced by bath habitat conditions, manipulations performed within the artificial stream, as well as factors such as growth rate and sampling capacity, a frequency-dependent game madel developed.
Chapter III further explored the potential for phenotype sorting, here investigating not only the distribution of phenotypes across habitats but also through time as a function of community assembly. Here the goal of this chapter was to bridge the gap between current groups of assembly studies, those which take a snap-shot trait-based approach and those that look at temporal trajectories however with respect to only composition. To do so a defaunation experiment was performed within a stream reach comprised of multiple habitat types and natural fish re-colonization of habitat sites was followed. Here trait analyses looking at overall morphological trends and within community patterns were conducted at bath the leve! of the en tire stream community as weil as using, separately, the two most abundant species.
Chapter IV, lastly, is a perspective paper which discusses, at larger metacommunity scales, the potential difficulty facing researchers in quantifying and measuring dispersal and disentàngling it from other factors which also produce spatial signatures. Here the direct and indirect methods currently available to capture
dispersal within metapopulations and metacommunities and the type of information they allow are presented along with the current challenges still faced and concluding with a wishlist for future technical advancements.
To summarize, these chapters are organized by and can be viewed as increasing in the scale of consideration, ranging from population leve! studies of distribution between resource patches within a habitat section in chapter I, movement and sorting across habitat sections in chapter II to community leve! re-assembly (re-colonization) across a stream reach in chapter III with chapter IV shifting from considerations of
movement within streams to larger scale dispersal at the metacommunity leve] (e.g., between stream systems or lakes). The experimental chapters are additionally linked by the consideration of traits and the potential for both biotic and abiotic factors to structure distribution.
INTRA-SPECIFIC GROWTH AND MORPHOLOGY
B. Jacobson, J.W.A. Grant and P.R. Peres-Neto Will be submitted to the Journal of Animal Ecology
1.1 Summary
How individuals within a population distribute themselves across resource patches of
varying quality has served as the basis of many theories; the Ideal Free Distribution proposing equal fitness among individuals in a 1:1 ratio with resources, resource de fen ce theory predicting different degrees of monopolization (fitness variance) as a function of temporal and spatial resource clumping and population density. One overlooked landscape characteristic which undoubtedly influences within-populatiori growth variance is its spatial structure, patch distribution changing resource
accessibility and thereby the effective number of competitors. Within streams, an individuaJs ability to monopolize resources (grow) is often linked to fish size, when invariant, however, little is known regarding the morphological characteristics dictating competitive ability for a single resource type. Here we tested whether and how the spatial distribution of resource patches and population density interact to influence the leve! and variance of individual growth, and if functional morphology (e.g., swimming capacity) relates to competitive ability. Feeding trials were
conducted within stream channels using young-of-the-year rainbow trout under three spatial distributions of 9 resource patches ( distributed, semi and clumped) at two density levels (9 and 27 individuals). Contrary to expectation, within-trial growth
variance showed opposite patterns across resource distributions, variance decreasing
at low but increasing at high population density as patches became clumped; overall growth greater in high density treatments. Such findings were the result of different levels of aggressive or scramble competition. As predicted, both pre- and post-trial
morphology were related to within-trial growth, competitive individuals those with
larger heads/bodies/caudal fins and Jess angled pectoral fms, associated with
swimming capacity and efficiency. The different degrees ofwithin-population growth variance at the same density level found here, as a function of spatial resource
distribution, provides an explanation as to the inconsistencies in within-site growth variance and subsequent population regulation often noted with regards to density
-dependence in natural landscapes.
1.2 Introduction
The question of how individuals within a population distribute themselves across
resource patches ofvarying quality (typically type and/or amount of food) has served
as the basis of countless studies and many theories across severa! fields of ecology.
Within population ecology, the Ideal Free Distribution (IFD) offers a base-line proposai of this relationship (i.e., distribution ac ross patches) where at equilibrium,
competitively equivalent individuals which have perfect knowledge of and the
cost-free ability to move throughout the landscape distribute themselves in a 1: 1 ratio with
resources such that fitness across individuals is equal (Fretwell and Lucas, 1970;
Kennedy and Gray, 1993; Lomnicki, 1988). Tests of the IFD, however, have often
found good quality patches to be systematically under-used and poor quality patches
over-used, leading to unequal fitness amongst individuals (Abrahams, 1986; Kennedy and Gray, 1993). While it is commonly the violation of the IFDs assumption of equal
competitive abilities which is suggested to produce this deviation (see Kennedy and Gray, 1993 for alternative assumptions; Lessels, 1995 and Tregenza, 1995 for
examples of alternative IFD models), good competitors occupying under-used good quality patches (Ideal Despotic Distribution; Lomnicki, 1988; Tregenza, 1995), the presence ofunequal competitors within a landscape does not necessarily result in variation in resource gain (Grand and Grant, 1994).
Tregenza et al. (1996), for example, found that within their experimental 2-patch system a good competitor on1y had greater fitness than others when densities were low, at high densities fitness differences between individuals decreased due to a switch from contest to scramble competition. Su ch an influence of the environmental properties (sensu Grant, 1993) of a lands cape over the ability for an individual to monopolize resources has been investigated to a great extent within the realm of behavioural ecology. Here, at the scale of an individual resource patch, resource defence theory predicts a dome-shaped relationship (though see Grant, 1993 for the potential presence of upper or lower thresholds) between the economie defendability of a resource patch (i.e., monopolization) and the number of potential competitors for it, as well as the degree of resource temporal and spatial dumping (manipulated via patch size) (Grant, 1993; Grant et al., 2000; Robb and Grant, 1997; Ward et al., 2006). While the amount of aggression (i.e., interference/contest competition) and thus the degree of fitness variation within the system is a function of such
monopolization (Grant and Guha, 1993; Noël et al., 2005; Weir and Grant, 2004) within-population variation will also depend on resource accessibility (Boujard et al., 2002).
The spatial structure of a landscape, the distribution of resource patches within the system irrespective of quality, is an overlooked characteristic of the landscape (but see Silver et al., 2000) that has the undoubted potential to influence the relative fitness amongst individuals, altering the equitability of resource accessibility. Indeed when patches are spread across the landscape, individuals may be able to settle into
patches with few interactions between competitors, thus leading to more even resource partitioning (access) and fitness (Noël et al., 2005). As patches become clumped in space, however, and the area within which foraging occurs decreases, the effective number of competitors within the population will increase (Fausch, 1984; Noël et al., 2005 through patch number), decreasing the equality of resource accessibility and increasing fitness variation. Within streams, where much. of the work regarding density-dependent growth and regulation (i.e., mortality, emigration) has been conducted, within-site growth variance is currently attributed to variation in foraging site quality (Site Quality Hypothesis (SQH); Lob6n-Cervia, 201 0; Newman, 1993; Ward et al., 2007); variance in patch quality due to canopy shading influencing invertebrate abundance, water velocity delivering drift and/or aquatic insect
emergence and behaviour (Gotceitas and Godin, 1992; Lancaster et al., 2003; Ward et
al., 2007; Ward et al., 2009). Thus while variation in patch quality may inherently be linked with variance in the spatial distribution of such patches, patches need not necessarily differ in quality to produce fitness variation. Considerations of the potential influence of spatial resource distribution may provide alternative
explanations for patterns of individual distribution currently attributed solely to patch quality.
Which individuals in the population are able to monopolize resources and/or hold good quality patches is a function of their relative competitive ability where within stream fish competitive dominance (i.e., ability to monopolize) is often linked to length/size, larger individuals able to gain access to the best foraging patches (Fausch, 1984; Ward et al., 2006), older individuals outcompeting younger (Kaspersson et al., 2010; Post et al., 1999). Whether the causal order of this
relationship is true, however, has recently been questioned by Ward et al. (2006) who
asked whether such size was in fact the cause or the effect of competitive ability. This is a particularly relevant question within a single young age-class where size may
initially be somewhat invariant but when growth has large impacts for subsequent survival (e.g., overwintering, within-season mortality; Lob6n-Cervüi, 2010; Ward et al., 2009). White much research, across many species, bas been conducted regarding the influence of morphology on competitive ability for different resources (i.e., resource polymorphism; Araujo et al., 2008; Bolnick, 2004; Edelaar et al., 2008; Smith and Skulason, 1996), less remains known with respect to the characteristics dictating relative competitive ability for a single resource type when size variation is inconsequential. In such cases, competitive ability may be conferred based on an individuals ability to use its environment more efficiently. Within riffles, where greater water velocity is related to increased resource delivery (Gotceitas and Godin, 1992), an individuals ability to gain resources may thereby be linked to its swimrning capacity and ability to hold station against the current (Leavy and Bonner, 2009; Ward et al., 2006).
In this study, we set out to test whether and how the spatial distribution of re source patches and population density interact to influence the leve! and variance of growth within landscapes and if an individual's morphology relates to their ability to obtain resources (i.e., compete). To do so we conducted feeding trials within flow-through stream channels using young-of-the-year rainbow trout, Oncorhynchus mykiss, under three different spatial distributions of 9 resource patch es ranging from evenly
distributed across the system to clumped within a single location (Figure 1.1). Such trials were conducted at two density levels, low at the leve! of one individual per patch versus high, 3 individuals per patch. We expected mean growth to be greater within high-density trials due to a decrease in energy expenditure on aggression, as per resource defence theory (Kim and Grant, 2007). Within low-density distributed trials (1: 1 competitor to resource patch ratio), we expected distribution to follow an IFD and individual's growth to be most similar (Noël et al., 2005), with within trial variance increasing with the spatial dumping of resource patches due to changes in
effective competitor number (Fausch, 1984; Noël et al., 2005). Lastly, we expected
competitive ability, irrespective of density and resource distribution, to be conferred
based on swimming ability (Ward et al., 2006) reflected in functional morphology. The potential patterns in growth variances found, both within and across the density levels tested, may provide an explanation as to the inconsistencies in within-site
variance (Imre et al., 2010) and subsequent degrees of population regulation (i.e.,
emigration, mortality) that are often noted with regards to density-dependence in
natural landscapes.
1.3 Materials and methods
1.3.1 Species and experimental set-up
We acquired 500 young-of-the-year rainbow trout (Oncorhynchus mykiss) (Figure
1.1A) of5cm in length from Pisciculture des Arpents Verts, Québec, Canada for use
in our experiments. When not in use fish were housed within two circular 1331
constant-flow tanks (flow at 50% depth=0.25m/s; water temperature=18-19.5°C) on a
12h light: 12h dark cycle (Brown and Brown, 1993) (lights on at 7am) and fed a
maintenance ration of dry food pellets (Skretting extruded salmonid feed). Housing conditions were monitored and daily feedings provided by animal care staff at Concordia University, Québec, Canada.
Experimental trials were conducted within four flow-through experimental stream
channels (Figure 1.1 B) under the same light regime. Each channel was lined to a
depth of approx. 2.5cm with small natural-coloured aquarium gravel wherein nine terracotta "saucers" were embedded, flush with the bed of grave!, to act as resource
depth=0.15-0.18m/s across chatmels). Water temperature within the system (approx. l8°C; Li and Brocksen, 1977) was controlled by the amount of de-chlorinated city water entering each channel and was continuously recorded every 15mins by a HOBO temperature/light data logger (Onset Computer Corporation) placed in each channel. Loggers were checked in the moming before feeding and again at the end of the light cycle (average across channels ± SD: week 1 19.1± 0.6°C; week 2 18.7 ± 0.2°C; week 3 17.7 ± 0.8°C; week 4 18.2 ± 0.2°C; and week 5 17.7 ± 0.5°C); temperatures remained within the preferred range for rainbow trout (Wood et al., 2012). To record feeding dynamics throughout the light cycle, digital colour CCD bullet cameras were connected to a surveillance system (GeoVision, Inc.) and mounted directly above each chatmel; with the exception of recording periods, channels were covered with large-weave netting to prevent fish from jumping out of the channels.
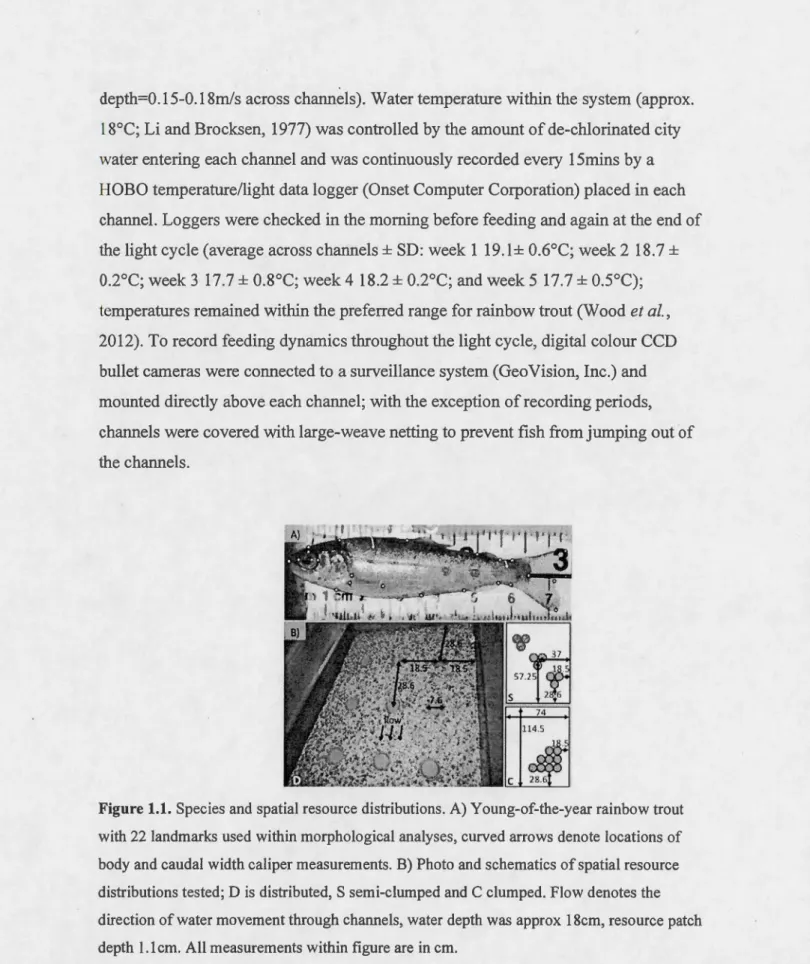
Figure 1.1. Species and spatial resource distributions. A) Young-of-the-year rainbow trout with 22 landmarks used within morphological analyses, curved arrows denote locations of body and caudal width caliper measurements. B) Photo and schematics of spatial resource distributions tested; D is distributed, S semi-clumped and C clumped. Flow denotes the direction of water movement through channels, water depth was approx 18cm, res ource patch depth 1.1 cm. Ali measurements within figure are in cm.
1.3.2 Experimental procedure
In order to determine the influence of resource spatial distribution and competitor density on growth, feeding trials were conducted under a 3x2 factorial design testing three different resource distributions (distributed, semi-clumped and clumped, Figure 1.1 B) at each of two densities (low n=9 and high n=27) with 3 repli ca tes per
treatment. Trials were conducted four at a time from October 14 to November 22 2011, where each week the individuals and treatments tested were both randomly
selected and assigned to each stream channel; although individuals were to a small degree length-matched.
Each triallasted a total of 8 days. On day 1, individuals were selected from housing tanks, anesthetized using a 1 cl ove oil: 10 ethanol mixture (active agent eugenol) (Anderson et al., 1997; Keene et al., 1998) and each given a unique identifier by way of2 subcutaneous VIE tags (visible implant elastomer; Northwest Marine
Technologies) in one or two of 4 fluorescent colours in one or two of severa! body locations. Individuals were then photographed on one lateral side for pre-trial morphology, weighed for initial mass and measured for initial body and caudal widths (Figure 1.1A). After recovering from anesthesia, individuals were introduced into a stream channel and starved for the day (Olsson et al., 2007). On da ys 2-7 resources were added once daily to stream channels, evenly divided across the 9 patches, given at a level of 10% (Brown and Brown, 1993) of the total initial mass of individuals within the trial per day in order to encourage growth. Feeding was
recorded on day 2 and 7, initial and final feeding, from the time food entered the system until the end of the light cycle. Note that while no mortality occurred as the result of handling or experimental treatrnent, there were sorne incidences of
individuals jumping out of the channels during recording and thus fmal densities did not always match initially set levels (low density n=6-10, high density n=21-27; see
also outliers below). When this occurred during day 1 or 2, individuals were identified and the food leve] for the trial adjusted accordingly. Lastly, on day 8 individuals were starved (Noël et al., 2005) to ensure the same level of gastric evacuation (Currens et al., 1989; Fausch, 1984) and near the end of the light cycle were anaesthetized, identified, weighed for final mass and photographed on the same lateral side for post-trial morphology. Individuals were afterwards retumed to a separate holding tank to ensure that no individual was used more than once.
1.3.3 Data analyses
Three growth metrics were calculated for each individual and used as dependent variables within analyses: 1) Individual growth, Gind, calculated as the difference between log10 transformed final and initial mass; 2) Growth variance, Gvar, calculated as the absolute value of the difference between Gind and the average Gind of the trial in which the individual participated; and lastly 3) Relative growth, Gre!, calculated removing the absolute value from Gvar, classified individuals as having either less or greater growth (negative or positive values respectively) relative to their trial average.
In order to determine the influence of treatment type on overall trial growth and the degree of intra-trial variance, Gind and Gvar were used within mixed-model analysis of variances (ANOV As) with density, spatial resource distribution and the density x spatial distribution interaction entered as fixed effects and the week in which the trial was conducted as well as the channel itself entered as random effects. Such random effects were used in order to control for sorne degree of contingency that may have occurred as a function of random sampling for trial participation and the fact that individuals participating in later weeks bad larger initial masses due to growth in housing. In order to ensure that any significant differences between treatment types
with respect to average growth (Gind) or variance (Gvar) were not an artifact of non-random sampling of individuals, mixed-model ANOV As were again run ·using initial mass (Massi) and initial mass variance (Massivar) ( calculated as per Gvar) as response variables.
In order to determine ifthere was an influence of an individual's morphology on their ability to capture. or potentially defend resources (i.e., grow) within trials, geometrie morphometrics were used to transform photographs into morphological information. To do so 22 landmarks were placed on both pre- and post-trial photographs (Figure
l.IA) using the program tpsDIG2 (Rohlf, 2005a) and converted, separately, into partial warps using the programs Coordgen6 and PCAgen6 (Sheets, 2004a, 2004b ). Pre-and post-trial warps were then entered as separate fixed effects within a mixed-model ANOVA using Grel as the dependen.t variable. Note that 3 individuals, randomly distributed across treatments, were identified as outliers with respect to post-trial morphology and were removed from all analyses. To visualize any morphological differences between Grel classifications (i.e., less or greater growth than their trial average), deformation grids were produced for pre- and post-trial morphologies using the pro gram tpsRegr (Rohlf, 2005b ). As competitive ability within fish is often proposed to be a function of length/size (Ward et al., 2006) and the effect of size is removed through standardization with the use of geometrie
morphometrics (Zelditch et al., 2004), a series of regressions were performed for each treatment type testing the relationship between Gind and each of log10 transformed initial mass (Massi), initial standard length (Lengthi), initial body width (BodyWi) and initial caudal width (Cauda!Wi). Correlation significances were determined with the use of mixed-model ANOV As using Gind as the dependent and each variable, separately per treatment, as the fixed effect, the inclusion of random factors (as above) allowing for the consideration that replicates differed in variances; values were zscore transformed prior to use within regressions and mixed-model ANOV As
(Schielzeth, 2010). All Mixed-model ANOVAs were run using the nlme package (Pinheiro et al., 2012) in R version 2.13.0 (R Development Core Team, 2011) and regressions were performed using Statistica 6.0 (StatSoft).
The spatial dynamics of resource patch use and types of competitive interactions used by individuals during feeding were observed from recordings of the final feeding (day 7) only, as it was assumed that recorded behaviour had at this point become
established (Noël et al., 2005). The first hour of all of such videos were observed and showed similar interactions and spatial dynamics; only the final replicate of each treatment type is reported. Spatial feeding dynamics were recorded as the number of seconds within a minute that at !east one individual was at !east Y2 body length within each patch, recorded every 5 minutes for the first 15 minutes of feeding during which time feeding activity was at its highest. Information garnered is presented in Figure
1.3. Due to issues of low video quality and the tightly packed quick movements during feeding at high densities, only qualitative differences in interaction types (agonistic versus scramble) and frequencies across treatments were recorded.
Interactions were considered aggressive if chasing occurred ( defined as per Kim and Grant, 2007; Robb and Grant, 1998) orto reflect scramble (exploitative) competition should no direct interaction occur with individuals only indirectly reducing the amount of available resources (Weir and Grant, 2004).
1.4 Results
Mixed-model ANOVAs indicated that the degree of individual growth (Gind) within trials differed as a function of density alone with average growth greater within high versus low-density treatments, irrespective of the type of resource spatial distribution (Table 1.1 and Figure 1.2A). Most interestingly, the degree to which such growth
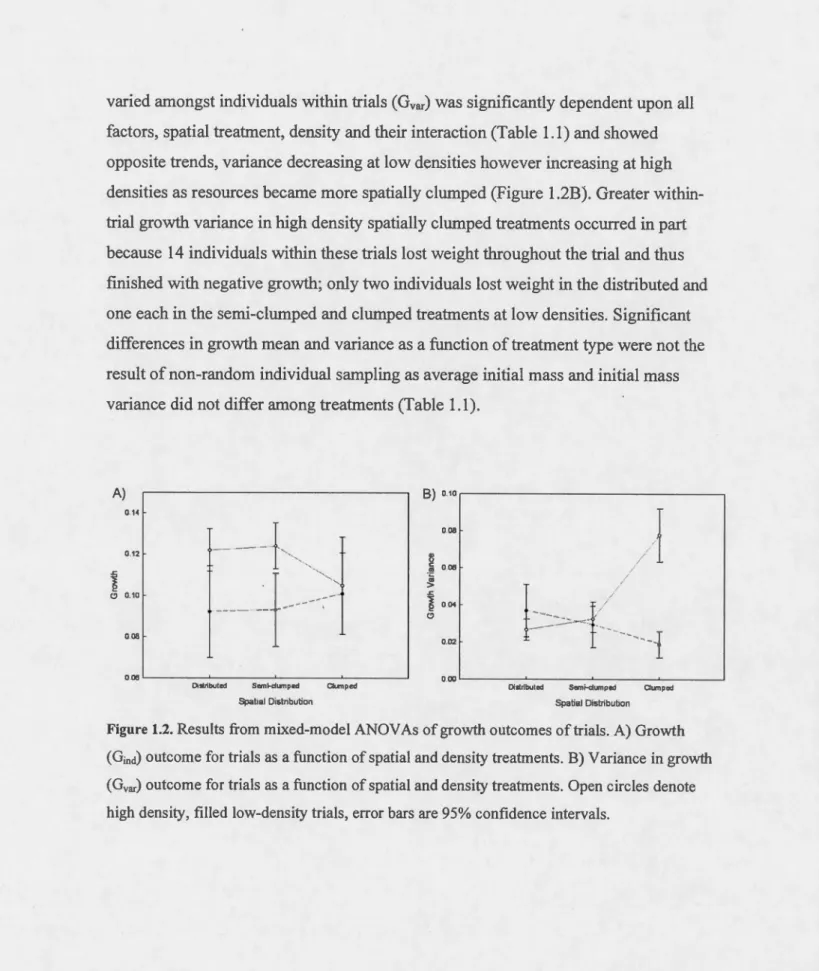
varied amongst individuals within trials (Gvar) was significantly dependent upon ail factors, spatial treatment, density and their interaction (Table 1.1) and showed opposite trends, variance decreasing at low densities however increasing at high densities as resources became more spatially clumped (Figure 1.2B). Greater within-trial growth variance in high density spatially clumped treatments occurred in part because 14 individuals within these trials lost weight throughout the trial and thus finished with negative growth; only two individuals lost weight in the distributed and one each in the semi-clumped and clumped treatrnents at low densities. Significant differences in growth mean and variance as a ftmction of treatment type were not the result of non-random individual sampling as average initial mass and initial mass variance did not differ among treatments (Table 1.1).
A) 01< 0 12
~
Cl 0.10 008 o.œL---~----'----~--~Dlsl:ribuled Semt-clumped aumped Spatial Distnbution B) o.1or-- - - - -- - - -- -- - - , 0.08 8 .~ 006 ~
1
004 Cl 0.02 o.ooL---~----'----~---'Oistribuled Semi·cfumped Ctumped
Spatial Distribution
Figure 1.2. Results from mixed-model ANOV As of growth outcomes of trials. A) Growth (Gind) outcome for trials as a function of spatial and density treatments. B) Variance in growth (Gvar) outcome for trials as a function of spatial and density treatments. Open circ les denote high density, filled low-density trials, error bars are 95% confidence intervals.
Table 1.1. F-values from mixed-model ANOVAs regarding the influence oftreatment type
and morphology on within-trial growth. Numbers in brackets are degrees offreedom.
Factor Dependent
Gind Gvar Mass1 Mass1var
Treatment Space (2) 0.168 8.677* 0.531 0.852 Density (1) 6.938* 5.904* 0.481 0.005 SxD (2) 0.779 9.56* 0.017 1.148 Grel Morpho/ogy Pre-trial (40) 1.628* Post-trial (40) 3.230** * p:50.05 ** p:50.001
Observation of feeding videos recorded during the final feeding revealed diffei·ent
spatial dynarnics (Figure 1.3) and types of individual interactions as a function of density and resource distribution. Overall more agonistic interactions (interference competition) were noted within low-density trials, decreasing as spatial resource
dumping increased. Within distributed trials, a single individual tended to chase and
exclude others from the entire resource arena, wherein foraging attempts were made
mainly at patches where foraging had already occurred (reflected in the location and
shading of patch use within Figure 1.3). Conversely, individuals within clumped
resource distributions circulated through patches utilizing only scramble/exploitative competition; semi-clurnped distributions were intermediate with scramble around and minor chases between patch clurnps across which individuals tended to again move and forage together. Opposite interactions were observed from videos of high-density treatments where scramble competition predominated in ali resource distribution
types, individuals divided relatively evenly arnongst and continually circulating over
ali patches. Despite such prevalence, minor chases were noted within semi-clurnped
trials when an individual would attempt to monopolize a single clurnp of patches
(upper left-hand grouping Figure 1.3). Severa! instances of aggression also occurred,
clumped resource trials wherein, throughout, several individuals never appeared to
attempt foraging. Across all treatments, when not foraging, individuals remained
within the downstream portion of the stream channel.
Low Density 0 0 0 0 0 0 0 0
•
ce
ce
Cf?
0 0 Smm 10m1n 0 0 0 0 0 0ce
C6
15mm 0•
0•
High Density•
0•
0 00 ~.5~n~,i~n--~--~10~n~,.~ln __ L _ _ _ 1~5~m~i~n~Do
D
1-1sD
16-3orn
31-45 • 46-59 ~!::: 60Figure 1.3. Spatial feeding dynamics of individuals throughout the first 15 min offeeding. Shading is based on the number of seconds within 1 min that at !east Y2 body length of at least one individual was within the resource patch.
The degree to which individuals grew within a trial, irrespective of treatment, was
found to be a function of their morphology, as evidenced by outcomes from a
mixed-model ANOVA, both pre- and post-trial morphology differentiating between
individuals of opposite relative growth (Gre!) (Table 1.1 ). Such effects could also be
seen in deformation grids of pre- and post-trial morphology as a function of Grel
(Figure 1.4) where the prirnary differences between groups in pre-trial morphology
were differences in pectoral fm angle, head/body and caudal fm size and head shape
exceptions, unrelated to initial fish length/size, regressions overalllargely
non-significant (Table 1.2).
Negative Relative Growth Positive Relative Growth
-
--
---
- ~-Pre-trial - - -1- -
-
---
-
-
·
-
·
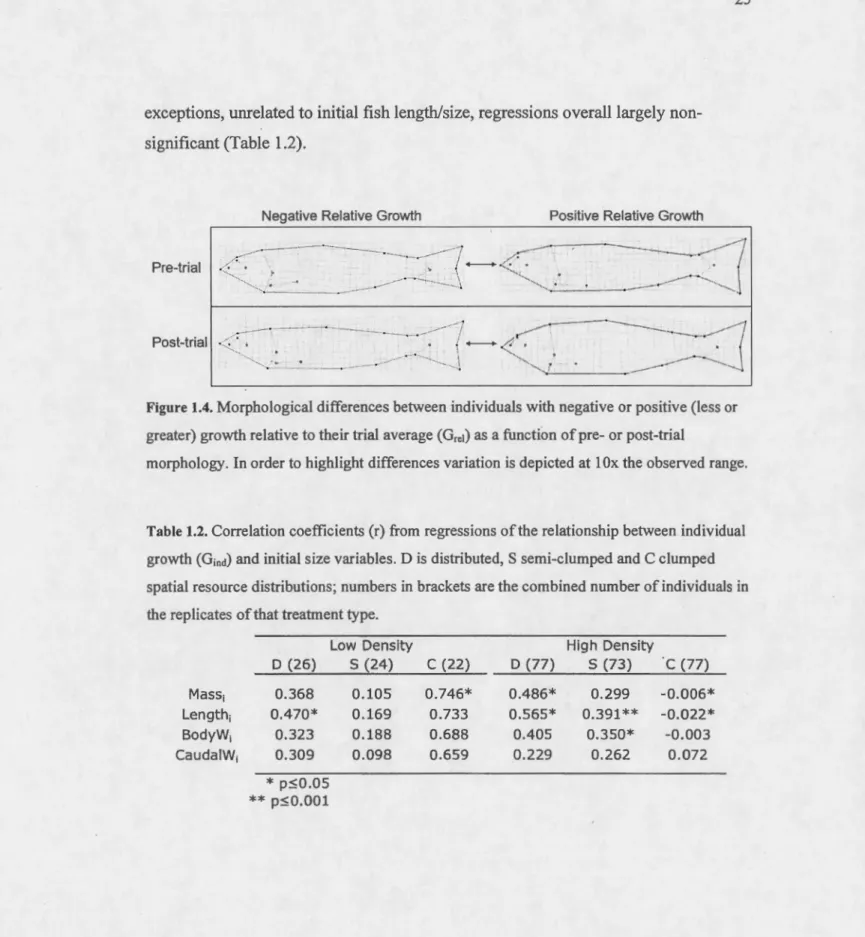
---Post-trial '---·~----·--Figure 1.4. Morphological differences between individuals with negative or positive (less or
greater) growth relative to the ir trial average (Grel) as a function of pre- or post-trial
morphology. In order to highlight differences variation is depicted at 1 Ox the observed range.
Table 1.2. Correlation coefficients (r) from regressions of the relationship between individual
growth (Gind) and initial size variables. D is distributed, S semi-clumped and C clumped
spatial resource distributions; numbers in brackets are the combined number of individuals in the replicates ofthat treatment type.
Low Density High Density
D (26)