Original
article
Relationships
among
estimates
of
inbreeding
depression,
dominance
and
additive variance
for linear traits
in Holsteins
I Misztal
TJ
Lawlor
N
Gengler
1
1 Ani!nal
andDairy
ScienceDepartment, University of Georgia, Livestock- Poultry
Building, Athens,
GA30602;
2
Holstein
Association,
Brattleboro, VT05302,
USA(Received
26 November1996; accepted
20May
1997)
Summary - Estimates of dominance and additive variances were obtained for 14 linear
traits. The data included 600 678 first
parity
records on 14 linear traits in Holsteins. The model included management groups, age atcalving,
additive and dominanceeffects,
andregression
oninbreeding
percentage. The estimate of the dominance variance was 9.8%of the
phenotypic
variance forbody depth,
8.0% forstrength,
6.9% for stature, and wasless than 5% for the
remaining
traits. The additive varianceranged
from 12.2% for footangle
to 45.3% for stature. No clearrelationship
was found between the estimates of dominance and additive variance;larger negative
estimates of theinbreeding depression
were associated with
higher
estimates of the dominance variance.type traits
/
dominance/
inbreeding/
variance componentsRésumé - Relations entre estimées de dépression de consanguinité, de variances
génétiques additives et de dominance pour les caractères de conformation en race
Holstein. Des estimées de variances
génétiques
additives et de dominance ont été obtenuespour 14
caractères deconformation
en race Holstein(600
678 résultats depremière
lactation).
Le modèle incluait leseffets
groupes deconduite, l’âge
auvêlage,
leseffets
génétiques additifs
et de dominance et larégression
sur le taux deconsanguinité.
La variancegénétique
de dominance a été évaluée à 9,8 % de la variancephénotypique
pour laprofondeur
du corps, à 8,0 % pour la puissance, 6,9 % pour la taille et moins de 5 % pour les autres caractères. La variancegénétique
additive a varié de12,2
% pourl’angle
dupied
à 45,3 % pour la taille. On n’a pas trouvé de relation claire entre les estimées de variance additive et de variance de dominance. On a trouvé que la
dépression
deconsanguinité
étaitd’autant
plus forte
que l’estimée de variance de dominance était élevée.caractère de conformation
/
dominance/
consanguinité/
composantes de variance*
On leave from Facult6 universitaire des sciences
agronomiques,
B-5030Gembloux,
INTRODUCTION
Genetic evaluations for farm animals are
currently
based on the additive model(Henderson, 1985).
Dominance effects wereignored
for two reasons.First,
compu-tations of evaluations with dominance were unfeasible
computationally
forlarger
pedigrees. Second,
theimportance
of dominance for the evaluation was not wellestablished;
thisimportance
can be ratedby
the fraction of the dominance variancein the total variance for a
given
trait.However,
good
estimates of the dominancevariance were not available because of a lack of reliable
procedures
that would1)
usethe animal model to
exploit
all the dominance information in thedata,
2)
be resis-tant to selectionbias,
and3)
be able to uselarge
andcomplete
data to ensure a lowsampling
error(Misztal
etal,
1995).
Forcomparable
accuracy, the estimates of the dominance variance need to be derived from data sets 20-200 timeslarger
than theestimates of the additive variance
(Chang,
1988: Hoeschele andVanRaden,
1991).
Estimates of dominance variance were obtained in thepast
either withsimplified
models
(eg,
VanRaden etal,
1992),
or from small data sets(eg,
Rodriguez-Almeida
etal,
1995).
Recent
developments
have madecomputations
with dominance in the model feasible. Thediscovery
of rules to invert the dominancerelationship
matrix andde-velopments
withcomputing
algorithms
have made the creation of the mixed modelequations
with the dominance effect feasible for verylarge
data sets(Hoeschele
andVanRaden,
1991).
Computing
refinements resulted in evaluation with dominance inthe model
requiring
less than twice the memory andcomputing
time of the additiveonly procedures
(Misztal, 1997).
The use of method R has allowed for estimationof variance
components
for verylarge
data sets(Reverter
etal,
1994);
method Rwas shown to be as resistant to several
types
of selection bias as REML(Snelling,
1994;
Kaiser andGolden,
1994).
The
feasibility
ofcomputations
with dominance has created an interest inidentifying
traits that have asignificant
dominance variance and thus could benefitfrom evaluation with dominance in the model. Predictions of the dominance effects could be utilized as
special
combined abilities in amating
system
(DeStefano
etal,
1992).
One
large
source of traits istype
traits. Since1983,
the Holstein Association ofAmerica has collected data on 14 linear
type
traits(Thompson
etal,
1983).
Thesetraits are scored on a unified scale of one to
50,
and have a similarphenotypic
standard deviation of about
6.0,
thussimplifying comparisons
among them.Type
evaluations are used in an index withproduction
traits to maintain a functionalcow. The first
goal
of this paper was to estimate dominance variances for lineartype
traits.A
large
number of linear traitsprovides
theopportunity
forexamining
rela-tionships
between dominance and other effects. Assuggested
for fitness traitsby
Falconer
(1989),
if the gene action is close tooverdominant,
it ispossible
that the dominance variance ishigh
for traits with a low additive variance. This leads to atheory
that traits with lowheritability
in the narrow sense are morelikely
to havea
high heritability
in the broad sense. Indairy cattle,
thattheory
wassupported
by
Since
type
traits have a wide range of different additivevariances,
the secondgoal
of the paper was to examine thistheory
inapplication
totype
traits.Because
precise
estimates of the dominance variancerequire
large
datasets,
and such sets may not beavailable,
it would beinteresting
to find out whether the dominance variance can bepredicted indirectly.
One suchpossibility
isthrough
theuse of
inbreeding
depression,
which can bepredicted accurately
from much smallerdata sets. It would be
expected
that ahigher
dominance variance wouldcorrespond
to a
higher magnitude
ofinbreeding
depression.
The lastgoal
of the paper was toexamine the
relationship
between estimates of dominance variance andinbreeding
depression.
MATERIALS AND METHODS
The data included first-records on the 14 linear traits for the first 600 678 Holsteins selected from a data set sorted
by
herd number and usedby
the Holstein Association of America forgenetic
evaluation inJuly
1995.Additionally, pedigrees
of most sireswere available. Each trait was
analyzed separately using
the modelwhere y is a 600 678 x 1 vector of
records, (3
is a 23 697 x 1 vector ofmanagement
andage at
calving effects,
0 is the coefficient ofinbreeding
depression,
a is a 732 644 x 1 vector of additive animaleffect,
f is a 1 269 690 x 1 vector of dominanceparental
effect,
b is a 600 678 x 1 vector ofinbreeding
coefficients,
andX,
Z andQ
arematrices or vectors that relate records to
respective
effects. The variances arewhere
CF’2
is
the additive variance andor’
is
the dominancevariance,
A is an additiverelationship matrix,
and F is a dominanceparental relationship
matrix as definedin Hoeschele and VanRaden
(1991).
The averageinbreeding
for animals was0.7%
for all animals but increased to
2.4%
for animals born in1992;
inbreeding
wasconsidered in A but not in F.
Estimates were obtained
by
method R as in Misztal(1997).
Each trait wasanalyzed
sixtimes,
each time with a different subset of the datagenerated
by
arandom number
generator;
each subset contained50%
of the full data set. Theconvergence criterion was ri = 1 !
0.0001,
where ri is theregression
for random effecti,
whichcorresponds
to a numerical error in the estimates of variances of0.5%
or less of the total variance.Sampling
standard deviation of the estimatesRESULTS AND DISCUSSION
Table I
presents
estimates ofinbreeding depressions
and variances as well as ratios of the estimates of variances for the 14 traits. All variances areexpressed
aspercentages
of thephenotypic
variance. While standard deviations in estimates forinbreeding
depression
among the sixsamples
were nolarger
than 0.001 and thereforestable,
they
were up to0.6%
for the additive variance and up to1.2%
for the dominance variance. Most of the standard deviations for the additive
variance were due to
incomplete
convergence(r
i
differed from 1by
up to0.0001).
However,
thechanges
for the dominance variance reflected a limited amount of dominance information in the dataand,
therefore, relatively large
sampling
variances. Estimates of theinbreeding
depression
weresmall,
with thelargest
magnitude being
forbody depth
at -0.07.Only
two other estimates had amagnitude
larger
than 0.05: stature andstrength.
The estimates werepositive
forseveral
traits,
thelargest
being
for udderdepth
at 0.03. Positive estimates could result from scalereversal,
where lower scores are more desirable. An alternativeexplanation
for udderdepth
wasprovided by
areviewer,
whosuggested
that inbred cows milk less so the udders are less full and not asdeep.
The estimates of the
additive
variance weremostly
similar to earlier estimatesusing
first records andthe
animal model(Misztal
etal,
1992).
Heritabilities were0.07
larger
for udderheight
and uddercleft,
0.06larger
for rumpangle,
and 0.05larger
for udderdepth.
Heritability
was smallerby
0.06 fordairy form;
otherto new age
adjustment
factors. After ageadjustments
were included in themodel,
Lawlor et al
(1995)
foundlarge changes, particularly
fordairy
form and udderdepth.
An increase in the estimate ofheritability
of 0.05 to 0.20 for stature whenage
adjustments
were fit in the model was found in astudy
on various dominancemodels
(Misztal
etal,
1997).
The estimate of the dominance variance was
8%
of thephenotypic
variance orlarger
foronly
two traits:body depth
andstrength.
Two otherestimates,
for stature anddairy
form,
were above5%.
Theremaining
ten estimates were below5%.
Alltraits with
larger
estimates of dominance werebody
traits.The estimates of the dominance variance were within
10-29%
of the estimates of the additivevariance,
with a mean of17%.
Thus,
fortype traits,
the dominancevariance
is,
on average, six times lower than the additivevariance,
andonly
a smallpart
of the totalgenetic
variance.The
inbreeding
depression,
a linear measure, is more related to standarddevi-ation,
a linear measure, than tovariance,
aquadratic
measure.Therefore,
testson
relationships
between theinbreeding
depression
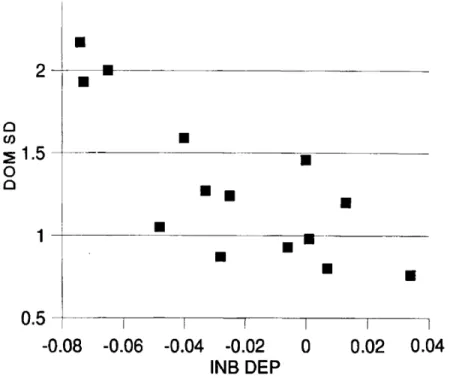
and the dominance variancein-volved estimates of the dominance standard deviation. Table II shows estimates of the
phenotypic
and dominance standard deviations and the ratio of the estimates ofinbreeding
depression
to dominance standard deviation. In absoluteterms,
theav-erage ratio of estimates of
inbreeding
depression
per1%
ofinbreeding
to estimatesFigure
1plots
estimates of theinbreeding
depressions against
those of thedomi-nance standard deviations.
Larger
inbreeding
depressions
weregenerally
associated withlarger
dominance variances. Allpositive
estimates ofinbreeding depression
areassociated with low estimates of dominance variance. On average, the dominance standard deviation could be
predicted
as 1.03-10.94 xinbreeding
depression,
withan
R
2
= 0.63(table III).
Thus,
theprediction
accuracy is moderate.
Figure
2plots
estimates of the dominance varianceagainst
those of theaddi-tive variance. On average, the estimates of the dominance variance increase
slightly
on additive variances is
significant,
but has a lowR
Z
of
0.31(table III).
Higher
estimates of the additive variancegenerally
corresponded
tohigher
estimates of the dominance variance.Thus,
thehypothesis
that traits with lowheritability
in thenarrow sense are more
likely
to have ahigh heritability
in the broad sense cannot be confirmed fortype
traits.Some of the less conclusive results of this
study
could be due to the use of aninsufficiently large
data set.First,
many full sibs obtainedthrough embryo
transfer are in differentherds,
and many of them have not been selected in the data set.Subsequently,
the ’dominance content’ in the data was small and thesampling
variance of the dominance estimates washigh. Second, inbreeding
wascalculated without
considering
themissing
pedigrees
as in VanRaden(1992).
Alsomost
pedigrees
of females bornprior
to 1980 weremissing.
Subsequently inbreeding
depression
was underestimated.In
conclusion,
the estimates of the dominance variance fortype
traits are mediumfor some traits and small for most.
Larger negative
estimates of theinbreeding
depressions
were associated withhigher
estimates of the dominance variance.Larger
estimates of dominance variances weregenerally
associated withhigher
additiveACKNOWLEDGMENTS
Helpful
commentsby
KeithBertrand,
Matt Culbertson and the two anonymous reviewersare
greatfully appreciated. Ignacy
Misztalacknowledges
the financial support of the Holstein Association of America. NicolasGengler,
who isCharge
de Recherches of the Fonds National de la RechercheScientifique, Belgium, acknowledges
its financial support.Partial
computing
support wasby
the National Center forSupercomputing Applications.
REFERENCES
Chang
HA(1988)
Studies on estimation ofgenetic
variances under non-additive geneaction. Ph D dissertation,
University
of Illinois,Urbana,
USADeStefano
AL,
H6schele I(1992)
Utilization of dominance variancethrough
mate alloca-tionstrategies.
JDairy
Sci 75, 1680-1690Falconer DS
(1989)
Introduction toQuantitative Genetics,
3rd ed.Longman,
BurntMill,
HarlowHenderson CR
(1985)
Best linear unbiasedprediction
of nonadditivegenetic
merits in noninbredpopulations.
J Anim Sci60, 111-117
Hoeschele
I,
VanRaden PM(1991)
Rapid
inversion of dominancerelationship
matrices for noninbredpopulations by including
sireby
dam subclass effects. JDairy
Sci 74,557-569
Hoeschele I
(1991)
Additive and nonadditivegenetic
variance in femalefertility
of Holsteins. JDairy
Sci74,
1743-1752Kaiser
CJ,
Golden BL(1994)
Heritability
estimation andbreeding
valueprediction using
selected data. J Anim Sci 72(Suppl 1),
147(Abstr)
Lawlor
TJ, Weigel KA,
Misztal I(1995)
Accounting
for age and stage of lactation at time of classification ingenetic
evaluations of type trait. JDairy
Sci 78(Suppl 1),
156 Misztal I(1997)
Estimation of variance components withlarge-scale
dominance models.J
Dairy
Sci 80, 965-974Misztal
I,
FernandoRL,
GrossmanM,
Lawlor TJ, Lukaszewicz M(1995)
Dominance andepistatic
effects ingenetic
evaluation. Animal SciPapers Reports 13,
251-266Misztal
I,
LawlorTJ,
Fernando RL(1997)
Dominance modelsby
Method R for stature in Holsteins. JDairy
Sci 80, 975-978.Misztal
I,
LawlorTJ,
ShortTH,
VanRaden PM(1992)
Multiple-trait
estimation of variance components ofyield
and type traitsusing
an animal model. JDairy
Sci75,
544-551
Reverter
A,
Golden BL, Bourdon RM(1994)
Method R variance componentsprocedure:
application
on thesimple breeding
value model. J Anim Sci 72, 2247-2253Rodriguez-Almeida FA,
Van VleckLD,
WilhamRL,
Northcutt SL 1995. Estimation ofnon- additive
genetic
variances in threesynthetic
lines of beef cattleusing
an animal model. J Anim Sci 73, 1002-1011 1Snelling
WM(1994)
Geneticanalyses
ofstayability
measures of beef females. Ph DDis-sertation Colorado State
Univ,
Fort CollinsThompson JR,
LeeKL,
FreemanAE,
Johnson LP(1983)
Evaluation of a linearized typeappraisal
system for Holstein cattle. JDairy
Sci 66, 325-331VanRaden PM
(1992)
Accounting
forinbreeding
andcrossbreeding
ingenetic
evaluation oflarge populations.
JDairy
Sci 75, 3136-3144VanRaden