Int. J. Environ. Res., 10(4):583-592, Autumn 2016 ISSN: 1735-6865
Received 17 Aug. 2016; Revised 23 Sep. 2016; Accepted 1 Oct. 2016
*Corresponding author E-mail: langsemb@yahoo.fr
The Effect of Nutrients on the Degradation of Hydrocarbons in Mangrove
Ecosystems by Microorganisms
Semboung Lang, F.1*, Tarayre, C.1, Destain, J.1, Delvigne, F.1, Druart, P.2, Ongena, M.1 and Thonart, P.1
1Université de Liège - Gembloux Agro Bio-Tech. Centre Wallon de Biologie Industrielle. Passage des Déportés, 2. B-5030 Gembloux, Belgium
2Centre Wallon de Recherche Agronomique (CRA-W). Chaussée de Namur, 24. B-5030 Gembloux, Belgium
ABSTRACT:Mangrove ecosystems are areas prone to various types of pollution, especially hydrocarbons. These hydrocarbons mostly stem from human activities such as spills coming from offshore oil operations, runoff from surrounding urban areas or atmospheric deposition. This pollution causes the decline of mangroves, which results in an imbalance in the functioning of this particular ecosystem with damages to the microbiota. Biodegradation allows to restore these ecosystems. This biodegradation can only be effective in specific environmental conditions. The presence of nutrients, which stimulate bacterial growth and promote biodegradation, is a key parameter to be considered. During this experiment, we achieved biodegradation tests to assess the effect of nitrogen and phosphorus on the process. The results showed that the biodegradation rates were strongly bound to the presence of nutrients. The degradation rates depended on the medium. The treatment that reached the best rate of degradation of diesel after 10 days was the one using 20% of a nutrient solution (MSM) containing nitrogen and phosphorus. This treatment led to a maximal degradation of 84.7% ± 4.7% obtained in the flasks containing 20% of a nutrient solution (MSM) containing nitrogen and phosphorus. Key words: Biodegradation, Microorganisms, Nutrients
INTRODUCTION
Hydrocarbons are currently the main source of energy obtained by combustion. This also makes them the World’s main source of pollution (spills, waste products, etc.). Hydrocarbons can affect the environment and many ecosystems such as mangroves ecosystems. More specifically, Polycyclic aromatic hydrocarbons (PAHs) are hydrophobic and readily adsorb onto particulate matter. As a consequence, coastal and marine sediments become the ultimate sinks, leading to a strong accumulation of hydrocarbons (Hughes et al., 1997). Mangrove biotopes, which are estuarine wetlands along coastlines of tropical and subtropical regions, are closely tied to human activities and are subject to contamination. Soil disruptions caused by pollution decreases biodiversity and promotes the growth of specific microbial species (Lindstrom et al., 1999; Kozdroj and Van Elsas 2001). A combination of biological, chemical and physical processes can contribute to the degradation of hydrocarbon contaminants, but soil microbial activity is a key parameter for these processes (Alexander, 1999; Gogoi et al., 2003; Greenwood et al., 2009).
Bioremediation of petroleum hydrocarbon contaminated soils has been recognized as an efficient, economic, versatile, and environmentally adapted treatment (Margesin and Schinner, 2001; Pao-Wen et al., 2008). Indigenous microorganisms, including bacteria and fungi, are able to degrade PAHs in soils, leading to the in situ rehabilitation of the soils (Margesin et al., 2000). Three types of bioremediation are predominant today; natural attenuation, bioaugmentation and biostimulation (Iwamoto and Nasu, 2001). Natural attenuation utilizes intrinsic degradation capability of the autochthonous microorganisms to degrade contaminants and is a natural degradation process (Mills et al., 2003). This strategy is advantageous as it avoids damaging the ecologically sensitive mangrove habitats (Dowty et al., 2001). Biostimulation requires some adaptations of the site (contaminated soil or water) in order to provide bacterial communities with a favourable environment, leading to an effective degradation of hydrocarbons. This includes the addition of nitrogen, phosphorus, and trace minerals with a suitable pH value, improving the proliferation of indigenous
microorganisms, hence speeding up the bioremediation process (Venosa et al., 1996; Salanitro et al., 1997). Bioaugmentation is the introduction of microorganisms with specific catabolic abilities into the contaminated environment in order to supplement the indigenous population and to speed up or enable the degradation of pollutants (Perelo, 2010). Traditional techniques for isolating and culturing microorganisms depend on the presence of soluble carbon sources. Recent studies have demonstrated the existence of aerobic heterotrophic bacteria, in pure cultures and consortia, capable of degrading the majority of hydrocarbon products, such as diesel and polycyclic aromatic hydrocarbons (Baker et al., 1994). Some of these bacterial cultures could be isolated from marine environments (Dean-Ross et al., 2001; Moody et al., 2001). They are able to survive in polluted environments and metabolize hydrocarbons as the sole carbon source. This study aims to control the influence of nutrients (more specifically nitrogen and phosphorus) on the rate of biodegradation of oil in mangrove biotopes and to determine the impact of such a treatment on the bacterial microbiota. This study aims to highlight the relationship between the microbiota and nutrients such as nitrogen and phosphorus in terms of hydrocarbon degradation applied to sediments of mangroves. The use of nutrients has been highlighted in previous studies (Semboung Lang et al., 2016). This study has shown that the oil degradation rate is highly dependent on environmental conditions and, in particular, the presence of nitrogen and phosphorus. The bioaugmentation with the addition of exogenous bacteria able to biodegrade hydrocarbons and adapted to the marine environment has been effective in the presence of nutrients. This experiment was performed in flasks in laboratory. Key parameters, such as temperature, oxygenation of the medium and pH, were controlled during the whole study.
MATERIALS&METHODS
The experiment was performed with artificial sea water (in MilliQ water (g/l): NaCl, 10; KCl, 0.74; CaCl2, 0.99; MgCl2, 6.09; MgSO4, 3.94; pH: 7.8 (pH was adjusted with NaOH or HCl)). The bottle was sterilized by autoclave. Mineral salt medium (MSM) had the following composition (mg/l): (NH4)2SO4, 1000; K2HPO4, 800; KH2PO4, 200; MgSO4.7H2O, 200; CaCl2.2H2O, 100; trace elements (FeSO4.7H2O, 12; MnSO4.7H2O, 3; ZnSO4.7H2O, 3; CoSO4.7H2O, 1; (NH4)6Mo7O24.4H2O, 1); 15 g agar. The pH was 7.0-7.2. MSM was prepared in deionized water except when salinity effects were examined. The diesel used in this study was commercial diesel; it contained 75.2% of aliphatic hydrocarbons, carbon chains were C11 to C24 and 24.7% aromatic hydrocarbons.
The bacterial consortium used in this study was developed by Semboung Lang et al., (2016). According to these authors, the active bacterial starter is obtained through a specific selection from the total microflora present in the sediments of mangroves. This consortium is made up of bacteria capable of degrading diesel. The bacterial concentration of the starter was 3 x 10¹¹ CFU/g of powder. This starter was used to inoculate flasks containing diesel.
The aim of this experiment was to find out the necessity of nutrients in hydrocarbon degradation. A series of tests in flasks was undertaken. The flasks contained the artificial sea water and nutrients in different concentrations. The experiment was carried out by series of three flasks (3 repetitions). In a series of three flasks of 250 mL, we introduced 160 ml of liquid containing 90% of artificial seawater and 10% of nutrient solution (MSM). In a second series, the flasks contained 80% of artificial seawater and 20% MSM. In the third series, the flasks contain 70% of artificial seawater and 30% MSM. In the fourth series, the flasks contain 60% of artificial seawater and 40% MSM. In the fifth series, the flasks contain 50% of artificial seawater and 50% MSM. In the sixth series, flasks contain 100% artificial seawater. The last series was the control series. In each of the flasks we added 10,000 ppm diesel. Except for the control flasks, we introduced into each of the flasks of the six series a bacterial consortium capable of degrading hydrocarbons. This consortium was isolated from mangrove sediment. The flasks were then incubated in an oven at 30 ° C for two weeks.The determination of NH4+ and PO
4
3- aimed to follow the evolution of nitrogen and phosphorus in the medium. The determination of ammonium and phosphate were achieved with the 1-05 Nanocolor Test kit and the Test 1-78 Nanocolor, respectively (Macherey-Nagel GmbH & Co. KG, Germany).
Accuri CFlow® or CFlow Plus software (CFlow) was used to control the C6 Flow Cytometer® system, acquire data, generate statistics and analyze results. Cytometric analyses allow to characterize the consortium under diesel stress. The viability and the membrane integrity were measured with propidium iodide (PI). Flow cytometry was also used to count the microorganisms. The analysis was performed every day throughout the entire experiment. The sample preparation was carried out as follows: one ml of each sample was transferred into two microtubes: the first was heated at 90°C for 30 minutes in a water bath (heat shock) and the second was placed on ice (reference sample). For each sample, 500 µL of the solution were introduced into another microtube, and then 500 µL of PBS were added (0.2-µ m filtered). The mixture was vortexed and centrifuged at 10,000 rpm for 2 min. The
Int. J. Environ. Res., 10(4):582-592, Autumn 2016
pellet (desired range 106 CFUs/mL) was recovered, 1,000 µL of PBS and 10 µ L of PI were added, and the cells were re-suspended using a vortex. The mixture was incubated at 37°C for 15 minutes and then centrifuged at 10,000 rpm for 2 min. The pellet was recovered, 1,000 µL of PBS were added and the cells were re-suspended using a vortex before cytometry analysis.
The analysis of the hydrocarbons required a purification step before gas chromatography analysis. During the purification, 100 ml of sample were used. The pH of each sample was adjusted to 2 using HCl. Then we added 4.45% MgSO
4.7H2O and, after an agitation step of 30 minutes, the contents was introduced into a separatory funnel. An equivalent volume of hexane solution saturated with acetonitrile was added to each sample. The mix was stirred for 10 minutes and yielded two phases: the hexane phase above containing hydrocarbons and impurities and the acetonitrile phase below. 1.5 g of Florisil (15% MgO, 85% SiO
2,MACHEREY-NAGEL GmbH and Co.KG, Germany) and 1.5 g of Na
2SO4 were placed in a settling leg made of fritted glass. The acetonitrile phase (below) was recovered first. The hexane phase containing hydrocarbons was next recovered in another flask. The flasks containing the hexane phase were then dried and heated in an oven at 105 °C for 3 hours and then cooled in a desiccator. The solution in each flask was then evaporated using a rotary evaporator heated at 50°C to a volume of about 2 ml. The final sample volume was measured and an aliquot was introduced into a vial stored at 4°C before GC injection. The remaining diesel oil was quantified by weight. The percentage of diesel oil degradation was determined on the basis of the original concentration.The dosage of hydrocarbons in soils and water was performed using a gas chromatograph (HP 5890 Series II Gas Chromatograph). An external calibration was made with standard diesel (Diesel Oil Additives Without DIN H53) and mineral oil (Mineral Oil Additives Without DIN H53). Analysis conditions and the characteristics of the column were as follows: Pre-column: deactivated fused silica; Column Macherey Nagel Optima 1 (99% polydimethylsiloxane, 1% diphenyl); Column length: 30 m; Internal diameter of column: 250 microns; Stationary phase thickness: 0.25 microns; Injection volume: 1 µl; Injector: on-column; Carrier gas: helium at 0.8 bar; Hydrogen fueling the detector: 1.15 bar; FID detector at 300°C; Oven temperature: 40°C for 5 minutes, temperature rise for 26 minutes at a rate of 10°C/min, 300°C for 30 minutes. Oil content was measured by the hydrocarbon index, considering all the peaks between decane and tetracontane.
The metabolism of C and N was analysed with Biolog ECO microplates® and the data were processed with the MINITAB® software. The bacterial suspensions obtained right after the inoculation of the
bacterial consortium into the flasks were considered the initial consortium with different nutrient concentrations. These suspensions were diluted in sterile physiological water (NaCl 9 g/l) and inoculated into the microplates at the right dilution. Other samples were taken from the flasks after 10 days of culture and were considered the final consortium, once again at different nutrient concentrations. The microplates were incubated at 30oC in darkness. The results were analysed following the procedure described by Tarayre et al. (2015) through principal component analysis and calculation of similarity rates.
Mean values were compared with the ANOVA test with a p-value d” 0.05. The differences in the various rates of diesel reduction were also analyzed by the same test. An analysis of variance (ANOVA) was performed to test the differences between initial and final TPH concentrations between the treated flasks and the control flasks. All statistical analyses were performed with the MINITAB 15 statistical software.
RESULTS& DISCUSSION
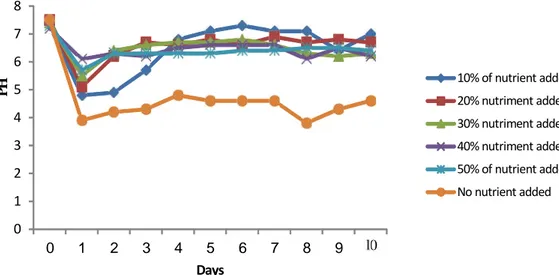
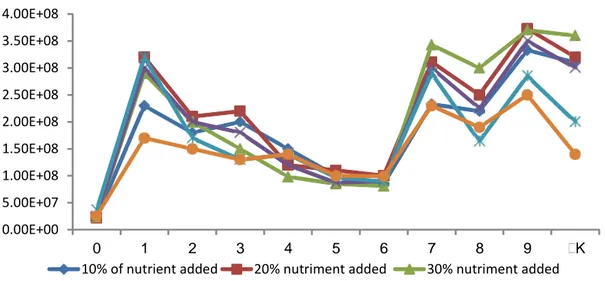
The experiment was carried out with a starting pH of 7-7.5. The evolution of pH is comparable in the different flasks. The pH decreased during the first two days of the experiment. It rose gradually after the second day to reach a stable value in the fourth day. In the flasks containing no nutrients, pH was from between 4.2 and 4.6 after the second day to the tenth day of the experiment. The pH was more acidic in flasks not containing nutrients. On the other hand, all the flasks added with nutrients showed a similar change in pH. Monitoring the evolution of pH is useful to assess the degradation of diesel. Determining the pH during this experiment showed that nutrients play an important role in the evolution of pH. In the flasks containing nutrients, the pH was between 6 and 7, supporting cell growth. Most microorganisms grow at pH 5.0 to 9.0 with optimal values close to neutrality. Fungi are often more tolerant to acidic conditions (pH <5) as bacteria (pH 6 to 8). The pH also affects the microorganisms and microbial enzymes, but also the dissociation and solubility of many molecules that act directly on micro-organisms. The pH determines the CO2 solubility and the availability of nutrients such as ammonium and phosphates. The solubility of phosphorus is thus maximized at pH 6.5 (Sims et al., 1990).The figure below (Fig. 2) shows the development of biomass in the flasks over a period of 10 days. The bacterial growth seems to be comparable whatever the treatment is. The statistical analysis of the results indicates that there is no significant difference between different flasks whatever the treatment. However, the bacterial concentration was higher in the flasks containing the nutrients. Nutrients added into some flasks in various
0 1 2 3 4 5 6 7 8 0 1 2 3 4 5 6 7 8 9 K Days 10% of nutrient added 20% nutriment added 30% nutriment added 40% nutriment added 50% of nutrient added No nutrient added P H
Fig. 1. Evolution of pH during the degradation of hydrocarbons
proportions have an accelerating effect of bacterial growth. The bacterial consortium benefited from the oxygen brought by the agitation and carbon brought in diesel. In literature, it has been reported that a large fraction of the soil microbial population uses oxygen as the terminal electron acceptor in its metabolism. However, experiments show that the presence of nutrients is also important for bacterial growth. According to Sims et al., 1990, the growth of microorganisms may also depend on other factors such as salinity, the presence of nutrients (nitrogen and phosphorus), temperature and even the interaction between microorganisms. Salinity in the medium has an osmotic effect on microorganisms which also have biological requirements in sodium chloride (NaCl), potassium chloride (KCl) and magnesium chloride (MgCl
2). The nitrogen contained in the flasks is important for the biosynthesis of proteins. Phosphorus is needed for ATP production and synthesis of the phospholipid membrane. However, high concentrations can inhibit microbial growth. This can explain the fact that the cell concentration is higher in the flasks receiving a small proportion of nutrients (10, 20 and 30% of the volume of liquid in the flask) compared with the concentration of cells in flasks with more nutrients (40 and 50% by volume). The addition of nitrogen and phosphorus improves cell growth and therefore the decomposition of organic pollutants. For example, according to Atlas 1977, the rate of oil biodegradation in seawater is limited both by the nitrogen and phosphorus content; this barrier can be removed by the addition of nitrogen and phosphorus oleophilic fertiliser. As a part of our experiment, we used a bacterial consortium to degrade diesel. In the flasks it is possible that interactions occur between different microorganisms constituting the consortium. Various
types of interactions exist between microbial populations such as mutualism and commensalism.
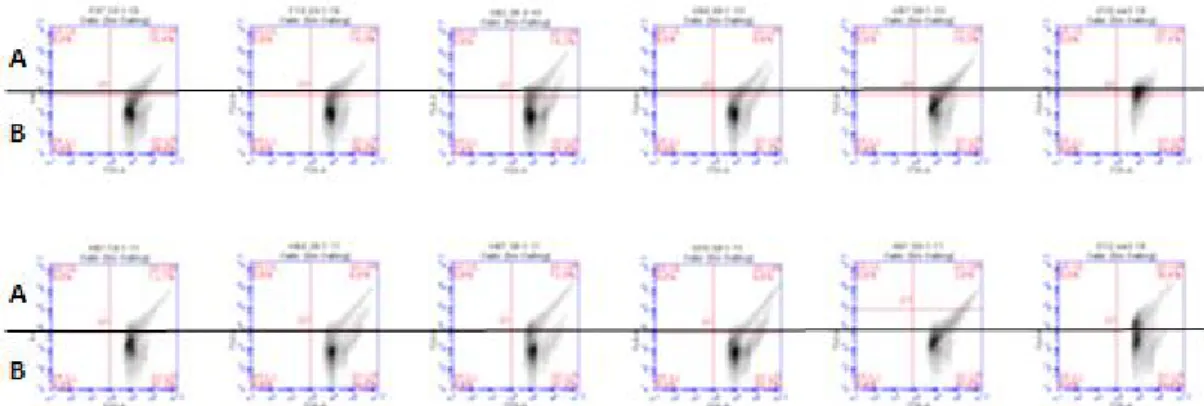
The objective consortium monitoring by flow cytometry was to assess the effect of stress caused by diesel, with or without nutrients. Diesel is a pollutant that induces a stress on the microbiota in the medium. This stress can cause death of some or all bacteria composing the consortium, or may cause damages to the membrane integrity of the cells. Propidium iodide (PI) is used as a staining agent which binds to the DNA. Only cells that are dead or the membrane integrity of which is damaged get stained with PI. The cells in good condition do not stain with PI because their membrane does not let the dye in. In the flow cytometry analysis, two kinds of subpopulations can be highlighted: a subpopulation stained with PI and another which is not. This analysis can also help us to understand the diesel degradation processes. There could be a correlation between the diesel degradation rate and the rate of living cells present in the flasks that are not coloured with PI. Fig. 3 shows the different percentages of cells that are not stained by PI. The observation of the different curves shows that the concentration of cells that do not interact with PI is higher in the flasks that were added with nutrients. In flasks with nutrients, the rate of living cells decreases progressively from the first day until the sixth day of treatment with the lowest concentration level observed (54.8% in the flasks that received 30% MSM medium). This rate increases again until the tenth day for the same flasks, with a concentration ratio of 87%. This clearly shows that, at the beginning of the experiment, the diesel induces a significant stress to the consortium. This stress causes the death of many cells, making them inactive. The presence of nutrients
Int. J. Environ. Res., 10(4):582-592, Autumn 2016 0.00E+00 5.00E+07 1.00E+08 1.50E+08 2.00E+08 2.50E+08 3.00E+08 3.50E+08 4.00E+08 0 1 2 3 4 5 6 7 8 9 K
10% of nutrient added 20% nutriment added 30% nutriment added 40% nutriment added 50% of nutrient added No nutrient added Fig. 2. Evolution of cells counted by flow cytometry during the biodegradation of hydrocarbons promotes cell growth and allows the cells to withstand
the presence of pollutant. The results of flow cytometry confirmed that hydrocarbons have adverse effects on cells. Hydrocarbons are cytotoxic and cause cell death (fig. 4). The cytograms obtained here showed that the nutrients inhibit the cytotoxic effect of diesel and limit its impact on cell death.
Several strategies can be used to degrade the hydrocarbons contained in mangrove ecosystems biologically. These strategies include natural attenuation, biostimulation and bioaugmentation. Natural attenuation uses indigenous microorganisms to degrade contaminants and has the advantage of being natural, adding no external elements into the environment (Mills et al., 2003). Biostimulation, based on supplying additional nutrients or substrates to
0 10 20 30 40 50 60 70 80 90 100 1 2 3 4 5 6 7 8 9 K Days MSM 10% MSM 20% MSM 30% MSM 40% MSM 50% SW 100% P e rc en ta g e o f m ic ro o rg an is m s
stimulate the degradation of native microorganisms, can also be used to promote biodegradation (Riser-Roberts, 1998). Bioaugmentation, based on inoculating microorganisms with the required degradation capability, might be a way of enhancing the biodegradability of toxic contaminants. As a part of our experiment, we used an endogenous bacterial consortium selected and developed as a starter, capable of degrading hydrocarbons and in particular diesel, and a nutrient solution as described in the methodology. The results at the end of the experiment showed that after 10 days of diesel degradation, the rates were different. These degradation rates differ depending on the medium. Fig. 5 shows that, after 10 days, the treatment with the best rate of degradation of diesel was 84.7% ± 4.7 and obtained in the flasks
Fig. 4. Cytograms with the consortium’s behavior into the flasks (A: Sub-population with poor membrane integrity; B: Sub-viable population or one with good membrane integrity)
Int. J. Environ. Res., 10(4):582-592, Autumn 2016
Fig. 4. Cytograms with the consortium’s behavior into the flasks (A: Sub-population with poor membrane integrity; B: Sub-viable population or one with good membrane integrity)
that were added with 20% of a nutrient solution (MSM) containing nitrogen and phosphorus. The flasks fed with 30% MSM solution had a degradation rate of 76.5 ± 6.0. Statistical analyzes indicate that there is no significant difference in the diesel degradation rate in both sets of flasks. However, the other degradation rates were significantly different (64.7 ± 4.0 for the series of flasks that received 40% of middle MSM, 58.1% ± 6.3 for the series receiving 10% medium MSM, 53.3% ± 10.5 for the series of flasks that received 50% MSM medium and finally 22.8% ± 6.3 for the series of flasks having no received an addition of MSM environment). Several strategies can be used to degrade the hydrocarbons contained in mangrove ecosystems biologically. These strategies include natural attenuation, biostimulation and bioaugmentation. Natural attenuation uses indigenous microorganisms to degrade contaminants and has the advantage of being natural, adding no external elements into the environment (Mills et al., 2003). Biostimulation, based on supplying additional nutrients or substrates to stimulate the degradation of native microorganisms, can also be used to promote biodegradation (Riser-Roberts, 1998). Bioaugmentation, based on inoculating microorganisms with the required degradation capability, might be a way of enhancing the biodegradability of toxic contaminants. As a part of our experiment, we used an endogenous bacterial consortium selected and developed as a starter, capable of degrading hydrocarbons and in particular diesel, and a nutrient solution as described in the methodology. The results at the end of the experiment showed that after 10 days of diesel degradation, the rates were different. These degradation rates differ depending on the medium. Fig. 5 shows that, after 10 days, the treatment with the best rate of degradation of diesel was 84.7% ± 4.7 and obtained in the flasks that were added with 20% of a nutrient solution (MSM) containing nitrogen and phosphorus. The flasks fed with 30% MSM solution had a
degradation rate of 76.5 ± 6.0. Statistical analyzes indicate that there is no significant difference in the diesel degradation rate in both sets of flasks. However, the other degradation rates were significantly different (64.7 ± 4.0 for the series of flasks that received 40% of middle MSM, 58.1% ± 6.3 for the series receiving 10% medium MSM, 53.3% ± 10.5 for the series of flasks that received 50% MSM medium and finally 22.8% ± 6.3 for the series of flasks having no received an addition of MSM environment).
These results showed that the nutrients, particularly nitrogen and phosphorus, are very important elements for the success of the biodegradation of diesel. The addition of nitrogen and phosphorus in limited proportions significantly improved the biodegradation of diesel. In mangrove ecosystems, the presence of hydrocarbons results in a significant reduction in the amount of nutrients available in the mangroves. (Sims et al., 1986). Nutrients are also required for microbial growth and cell growth. Appropriate amounts of nutrients for microbial growth are usually present in low amounts, but the nutrients may be added in a usable form by a modification of the organic substrate. This substrate is also used as an electron donor to stimulate bioremediation. Indeed, hydrocarbons are a major source of carbon but contain no nitrogen or phosphorus. When microorganisms degrade PAHs, they consume the nutrients available in the environment, causing deficiencies and increasing the existing competition phenomena (Kaye & Hart, 1997). In addition, the hydrocarbon contamination may be toxic to certain bacterial and fungal organisms involved in biogeochemical cycles, amplifying the deficiencies of nutrients in plants (Muratova et al., 2003). In general, a C/N/P ratio of 120/10/1 [mg] is considered optimal for the growth of bacteria in the presence of contaminants (Wilson and Jones, 1993). More specifically to the bioremediation of soils, most studies show an optimal C/N/P ratio of 120/14/3 [massic ratio]
0 10 20 30 40 50 60 70 80 90 100 10% of MSM 20% ofMSM 30% ofMSM 40% ofMSM 50% ofMSM of SW100% Medium P e rc en ta g e o f d e g ra d a ti o n
Fig. 5. Biodegradation of diesel obtained after 10 days
and 100/10/1 [molar ratio] (Bouchez et al. 1995; Cookson, 1995). However, these ratios must be adapted because of the complexity of some ecosystems such as mangroves. Similarly, it is important to take into account the specific ecosystem conditions: salinity, temperature and sometimes oxygen deficiency, presence of specific microorganisms to degrade hydrocarbons, etc. These conditions must be considered to adjust the quantities of nutrients needed to promote biodegradation. Nutrients such as nitrogen and phosphorus can be limiting factors affecting the biodegradation process. When an oil spill occurs in an ecosystem in marine or fresh water, carbon increases significantly and the availability of nitrogen and phosphorus is usually the limiting factor for the degradation of hydrocarbons. Mangrove ecosystems and wetlands freshwater areas are generally considered nutrient deficient because of strong demands of nutrients by (Ryan et al., 1987) plants. Therefore, nutrient additions are needed to enhance the biodegradation of petroleum products (Sims, 1986; Coover et al., 1987). On the other hand, excessive concentrations of nutrients can also inhibit the biodegradation activity (Sims, 1986). Several authors have reported the negative effects of high levels of NPK on the biodegradation of hydrocarbons (Park et al., 1988), particularly aromatic (Lynch et al., 1989).The metabolic properties of the bacterial consortium were assessed with Biolog ECO microplates®. The data were analysed in two ways: principal component analysis (PCA) and calculation of similarity rates. Figure 6 shows the values of the first two principal components calculated on the basis of the consumption of C and N substrates.
The values of the first and second principal components suggest a clear separation between the
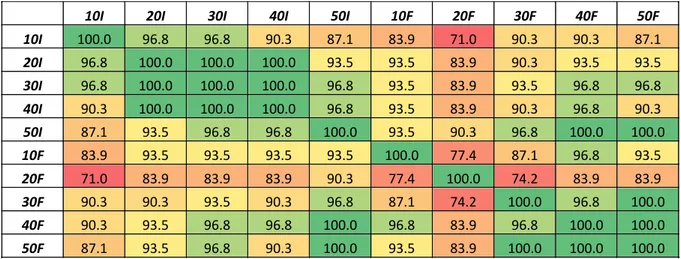
initial and final consortia. This can be explained by a common evolution of bacteria during the biodegradation process. This is linked to a difference in the value of the first principal component (Z1). Indeed, a value superior to -0.15 corresponds to the final consortia (except for 3 samples 30F), while a value inferior to -0.15 is rather linked to the initial consortia. However, such a difference cannot be highlighted with the 2nd principal component. At this level, it is not possible to identify subgroups characterized by different nutrient concentrations. However, the calculation of similarity rates, based on statistical inference, allows to go deeper in these differences. Table I below shows a heat map of the similarity rates calculated for each couple of samples.
These similarity rates show a close profile in the data obtained from the original consortium at different MSM concentrations. The differences observed here are due to the culture medium, more concentrated in nutrients in the samples 30, 40 and 50I. The strongest difference can be observed between the samples 10I and 50I, characterized by the lowest and the highest nutrient concentration, respectively. It must be noted that the consortium inoculated into the microplates is exactly the same in samples 10, 20, 30, 40 and 50I, which means that the significant differences observed here are only due to the composition of the culture medium. As for the final consortium, there is a strong similarity between the samples 30, 40 and 50F. The two other final consortia show many more significant differences in the metabolism of C and N. It seems that the samples 10 and 20F have their own metabolic profiles, and
Fig. 6. First (Z1) and second (Z2) principal components calculated on the basis of the metabolism of C and N sources by the bacterial consortium – 10, 20, 30, 40 and 50I correspond to the initial consortium with 10, 20, 30, 40 and 50%
of MSM solution; 10, 20, 30, 40 and 50F correspond to the final consortium with 10, 20, 30,
Int. J. Environ. Res., 10(4):582-592, Autumn 2016
Table 1. Heat map of similarity rates calculated on the basis of the metabolism of C and N sources by the bacterial consortium – 10, 20, 30, 40 and 50I correspond to the initial consortium with 10, 20, 30, 40 and 50% of MSM solution; 10, 20, 30, 40 and 50F correspond to the final consortium with 10, 20, 30, 40 and 50% of MSM solution
10I 20I 30I 40I 50I 10F 20F 30F 40F 50F
10I 100.0 96.8 96.8 90.3 87.1 83.9 71.0 90.3 90.3 87.1 20I 96.8 100.0 100.0 100.0 93.5 93.5 83.9 90.3 93.5 93.5 30I 96.8 100.0 100.0 100.0 96.8 93.5 83.9 93.5 96.8 96.8 40I 90.3 100.0 100.0 100.0 96.8 93.5 83.9 90.3 96.8 90.3 50I 87.1 93.5 96.8 96.8 100.0 93.5 90.3 96.8 100.0 100.0 10F 83.9 93.5 93.5 93.5 93.5 100.0 77.4 87.1 96.8 93.5 20F 71.0 83.9 83.9 83.9 90.3 77.4 100.0 74.2 83.9 83.9 30F 90.3 90.3 93.5 90.3 96.8 87.1 74.2 100.0 96.8 100.0 40F 90.3 93.5 96.8 96.8 100.0 96.8 83.9 96.8 100.0 100.0 50F 87.1 93.5 96.8 90.3 100.0 93.5 83.9 100.0 100.0 100.0
consequently their specific bacterial consortium with a similarity rate of only 77.4%. Some C and N substrates were involved in many significant differences between the samples, while other substrates were degraded by all consortia in the same way. The substrates linked to the most significant differences (more than 6 significant differences out of 45 comparisons) between the pairs of samples were pyruvic acid methyl ester, cyclodextrin, 2- and 4-hydroxybenzoic acid, α-ketobutyric acid, asparagine, phenylalanine, L-threonine and glycyl-L-glutamic acid. It is interesting to note that 4 of these substrates contain nitrogen.
CONCLUSIONS
The biodegradation of mangrove sediments polluted by diesel involves a set of factors which must be monitored to be effective. Previous works have shown similar results using endogenous or exogenous microorganisms. The success of the biodegradation of mangrove sediments polluted by oil depends on the ability of bacteria to degrade hydrocarbons, the control of temperature and pH of the medium, and the presence of nutrients such as nitrogen and phosphorus. These two elements play a key role in bacterial growth. The results confirm the importance of the presence of nutrients in the biodegradation process. However, the concentration in key elements (nitrogen and phosphorus) to be added must take into account that the polluted sediments already contain these elements. A high concentration in these nutrients seems to affect the biodegradation process. However, an optimal addition of nitrogen and phosphorus stimulates bacterial growth and promotes good hydrocarbon degradation.
REFERENCES
Alexander, M. (Ed.) (1999). Biodegradation and Bioremediation. (San Diego, CA: Academic Press).
Baker, K.H. and Herson, D.S. (1994). Microbiology and Biodegradation. (In K.H. Baker, & D.S. Herson (Eds.), Bioremediation (pp.9-60). New York (USA): McGraw-Hill, Inc.)
Bouchez, M., Blanchet, D. and Vandecasteele, J.P. (1995). Degradation of polycyclic aromatic hydrocarbons by pure strains and by defined strain associations: inhibition phenomena and cometabolism. Applied of Microbiology and Biotechnology, 43(1), 156-164.
Cookson, J.T. (Ed.) (1995). Bioremediation engineering : design and application. (New York: McGraw-Hill). Coover, M.P. and Sims, R.C. (1987). The effect of temperature on polycyclic aromatic hydrocarbon persistence in an unacclimated agricultural soil. Hazardous Waste & Hazardous Materials, 4, 69-82.
Dean-Ross, D., Moody, J.D., Freeman, J.P., Doerge, D.R. and Cerniglia, C.E., (2001). Metabolism of anthracene by Rhodococcus species. EMS Microbiology Letters, 204(1), 205-211.
Dowty, R.A., Shaffer, G.P., Hester, M.W., Childers, G.W., Campo, F.M. and Greene, M.C. (2001). Phytoremediation of small-scale oil spills in fresh marsh environments: a mesocosm simulation. Marine Environmental Research, 52,
195–211.
Gogoi, B.K., Dutta, N.N., Goswami, P. and Krishna, T.R.M. (2003). A case study of bioremediation of petroleum-hydrocarbon contaminated soil at a crude oil spill site. Advances in Environmental Research, 7, 767–782. Greenwood, P.F., Wibrow, S., George, S. J. and Tibbett, M. (2009). Hydrocarbon biodegradation and soil microbial community response to repeated oil exposure. Organic Geochemistry, 40(3), 293-300.
Hughes, J. B., Beckles, D. M., Chandra, S.D. and Ward, C.H. (1997). Utilization of bioremediation processes for the treatment of PAH-contaminated sediments. Journal of Industrial Microbiology and Biotechnology, 18, 152–160.
Iwamoto, T. and Nasu M. (2001). Review: current bioremediation practice and perspective. Journal of Bioscience and Bioengineering, 92, 1–8.
Kaczorek, E. and Olszanowski, A. (2011). Uptake of Hydrocarbon by Pseudomonas fluorescens (P1) and
Pseudomonas putida (K1) Strains in the Presence of
Surfactants: A Cell Surface Modification. Water, Air & Soil Pollution, 214, 451–459.
Kaye, J.P. and Hart, S.C. (1997). Competition for nitrogen between plants and soil microorganisms. Trends ecology Evolution, 12(4), 139-143.
Kozdroj, J. and Van Elsas, J.D. (2001). Structural diversity of microorganisms in chemically perturbed soil assessed by molecular and cytochemical approaches. Journal of Microbiology Methods, 43, 197–212.
Lindstrom, J.E., Barry, R.P. and Braddock, J.F. (1999). Long-term effects on microbial communities after a subarctic oil spill. Soil Biology Biochemistry, 31, 1677–1689.
Lynch, J. and Genes, B.R. (1989). Land treatment of hydrocarbon contaminated soils. (In P.T. Kostecki, & E.J. Calabrese (Eds.), Petroleum Contaminated Soils, Vol I: Remediation Techniques, Environmental Fate, and Risk Assessment. (pp. 163-174). Chelsea, MI: Lewis Publishers). Margesin, R., and Schinner, F. (2001). Bioremediation (Natural Attenuation and Biostimulation) of Diesel-Oil-Contaminated Soil in an Alpine Glacier Skiing Area. Applied Environmental Microbiology, 67, 3127.
Margesin, R., Zimmerbauer, A. and Schinner F. (2000). Monitoring of bioremediation by soil biological activities. Chemosphere, 40, 339–346.
Mills, M.A., Bonner, J.S., McDonald, T.J., Page, C.A. and Autenrieth, R.L. (2003). Intrinsic bioremediation of a petroleum-impacted wetland. Marine Pollution Bulletin, 46,
887–899.
Moody, J.D., Freeman, J.P., Doerge, D.R. and Cerniglia, C.E. (2001). Degradation of phenanthrene and anthracene by cell suspensions of Mycobacterium sp. strain PYR-1. Applied Environmental Microbiology, 67, 1476.
Muratova, A., Bner, T., Narula, N., Wand, H., Turkovskaya, O., Kuschk, P., Jahn, R. and Merbach W. (2003). Rhizosphere microflora of plants used for the phytoremediation of bitumen-contaminated soil. Microbiology Resource, 158(2), 151-161.
Pao-Wen G.L., Liang-Ming W., Ming-Chieh Y., Sheng-Shung C., (2008). Biodegradation of diesel-contaminated soil: A soil column study. Journal of the Chinese Institute of Chemical Engineers, 39, 419-428.
Park, K.S., Sims, R.C., Doucette, W.J. and Matthews, J.E. (1988). Biological transformation and detoxification of 7,12-dimethylbenz(a)anthracene in soil systems. Journal of Water Pollution Control Federation, 60, 1822-1825.
Perelo, L.W. (2010). Review: In situ and bioremediation of organic pollutants in aquatic sediments. Journal of Hazardous Materials, 177, 81-89.
Riser-Roberts, E. (1998). Remediation of petroleum contaminated soils: biological, physical, and chemical processes. (Boca Raton: Lewis Publishers).
Ryan, J., Loehr, R. and Sims, R. (1987). The Land Treatability of Appendix VIII Constituents Present in Petroleum Refinery Wastes: Laboratory and Modelling Studies. American Petroleum Institute, Land Treatment Committee, 1220 L. Street, Washington, D.C.
Salanitro, J.P., Dorn, P.B., Huesemann, M.H., Moore, K.O., Rhodes, I.A., Jackson, L.M.R., Vipond, T.E., Western, M.M. and Wisniewwski, H.L. (1997). Crude oil hydrocarbon bioremediation and soil ecotoxicity assessment. Environmental Science Technology, 31, 1769-1776. Semboung Lang, F., Destain, J., Delvigne, F., Druart, P., Ongena, M. and Thonart P. (2016a). Characterization and evaluation of the potential of a diesel-degrading bacterial consortium isolated from fresh mangrove sediment. Water Air Soil Pollution, 227, 58. DOI 10.1007/s11270-016-2749-7.
Semboung Lang, F., Destain, J., Delvigne, F., Druart, P., Ongena, M. and Thonart P. (2016b). Biodegradation of polycyclic aromatic hydrocarbons in mangrove sediments under different strategies: natural attenuation, biostimulation and bioaugmentation with Rhodococcus erythropolis t 902.1.
Water Air Soil Pollution, 227, 297. DOI 10.1007/s11270-016-2999-4.
Sims, J.L., Sims, R.C. and Matthews, J.E. (1990). Approach to bioremediation of contaminated soil. Hazardous Waste & Hazardous Materials, 7(2), 117 -149.
Sims, R.C. (1986). Loading rates and frequencies for land treatment systems. (In R.C. Loehr & J.F. Malina, Jr. (Eds.), Land Treatment: A Hazardous Waste Management Alternative. Water Resources Symposium No. 13, Center for Research in Water Resources, The University of Texas at Austin, (pp. 151-170). Austin, TX).
Sims, R.C., J.L. Sims, and R.R. Dupont. (1986). Human health effects assays. Journal Water Pollution Control
Federation 58, 703-717.
Sims, R.C. (1986). Soil Treatability Study Results-Coal Gasification Process Water Pond Residuals. Utah Water Research Laboratory, Utah State University, Logan, UT.
Tarayre, C., Bauwens, J., Mattéotti, C., Brasseur, C., Millet, C., Massart, S., Destain, J., Vandenbol, M., De Pauw, E., Haubruge, E., Francis, F., Thonart, P., Portetelle, D. and Delvigne, F. (2015). Multiple analyses of microbial communities applied to the gutof the wood-feeding termite Reticulitermes flavipes fed on artificial diets.Symbiosis, DOI 10.1007/s13199-015-0328-0.
Venosa, A.D., Suidan, M.T., Wrenn, B.A., Strohmeier, K.L., Haines, J.R., Eberhart, B.L., King, D.W. and Holder, E. (1996). Bioremediation of experimental oil spill on the shoreline of Delaware Bay. Environmental Science and Technology, 30, 1764-1775.
Wilson, S.C. and Jones, K.C. (1993). Bioremediation of soil contaminated with polynuclear aromatic hydrocarbons (PAHs): a review. Environmental Pollution, 81(3), 229-49.