1
This is a post-peer-review, pre-copyedit version of an article published in
Applied Spatial Analysis and Policy. The final authenticated version is available
online at: https://doi.org/10.1007/s12061-019-09316-4
Please cite as:
Martori, J. C., et al. (à paraître). Spatial Potential Accessibility of Playgrounds in
Barcelona City. Applied Spatial Analysis and Policy.
2
Spatial Potential Accessibility of Playgrounds in Barcelona City
Joan Carles Martori
University of Vic (Barcelona), Spain
Philippe Apparicio
INRS Urbanisation Culture Société
Anne-Marie Séguin
INRS Urbanisation Culture Société
Abstract:
There has been an extensive tradition of geographical studies conducted to analyse the access to
urban parks or green spaces. Several studies deploy approaches to measure the potential spatial
accessibility and congestion of children’s playgrounds in urban areas. Identifying inequalities in
terms of spatial access to children’s playgrounds is an important issue that could be useful for
urban planners. The main objective of this paper is to measure the potential spatial accessibility
and congestion of playgrounds in Barcelona City. A second objective is to analyse the factors
that may explain differences between neighbourhoods in spatial access to playgrounds. Several
analyses were carried out. First, two indicators of spatial potential accessibility are computed at
the census tract level. Next, a mapping technique is used based on a cross tabulation of the
quintiles of two indicators. A typology of census tracts can then be developed according to the
various possible combinations between playground accessibility and congestion. Third, two
spatial models—spatial lag and spatial error—are estimated in order to introduce socioeconomic
factors into the explanation of accessibility and congestion. Finally, a multinomial logistic model
is estimated to explain the typology of Barcelona census tracts based on potential playground
congestion and accessibility. The results show that in Barcelona City, there are no important
spatial disparities in terms of access to children’s playgrounds.
Keywords: Playgrounds, accessibility and congestion measures, spatial models, multinomial
logistic regression, Barcelona city.
3
Introduction
The United Nations Convention on the Rights of the Child (UNCRC) in the article 31 recognised play as a fundamental right of all children. Playgrounds are important environments where many children play during their childhood. Research has shown that in playgrounds children have opportunities to develop different skills, learn social norms and values, take risks, test their limits, and interact with other children (Fjortoft, 2001; Turner et al., 2009; Siu et al., 2017). Playgrounds contribute to children’s health by increasing physical activity (Giles-Corti et al., 2005; Kaczynski and Henderson, 2007) and motor development and they play a main role in prevention of childhood overweight (Veugelers et al., 2008; Cosco, et al., 2015; McCarthy et al., 2017). Playgrounds are also beneficial for social interaction between children and parents of different social and ethnicity characteristics (Moore and Cosco, 2010; Bennet et al., 2012) and playgrounds are also identified as a significant factor in enabling inclusion of children with disabilities ( Olsen and Dieser, 2012; Siu et al., 2017).
The case of Barcelona is particularly relevant for three reasons. First, Barcelona has had a rapid growth of immigrant population over a very short period. From 6.34 per cent of immigrants of the total population in 2001 to 16.62 per cent in 2016. Second, the birth rate is 8.9 (births/1,000) one of the lowest in the big European cities (European Union 10, Spain 9), but the 33.4 per cent of the births have an immigrant parent. Third, Barcelona City Council promotes a specific plan to improve the provision of children's play areas in the city with the participation of schools and citizens. This plan promotes the incorporation of new areas into green spaces, renovating and updating existing areas by incorporating Information and Communication Technologies (ICT). The activities carried out from 2014 to 2019 have a budget of 20.2 million Euros. The plan was developed in two phases. During the first (2014-2015) 10 new playgrounds (one per district) were built, 44 existing areas were renovated and technological elements were introduced. In the second phase (2016-2019), the plan went one step further because the playgrounds became a space for intergenerational contact between children and the elderly. Renovation work will continue in existing areas. The plan has three main goals. First, to improve the supply of playgrounds in the city and promote outdoor play. Second, to introduce innovative elements linked to ICT issues and actions that encourage the use of these play areas, designed mainly for children but also used by adolescents. Third, to integrate elements designed for children with elements designed for the elders accompanying them, encouraging the practice of conjoint and intergenerational physical activity.
The main objective of this paper is to measure the spatial potential accessibility and congestion of playgrounds in Barcelona City. A second objective is to analyse the factors that may explain differences between neighbourhoods in spatial access to playgrounds. Specifically, we focus on whether low income-population and immigrant income-population live in areas with lower level of potential spatial accessibility and congestion to playgrounds. Finally, another aim is to evaluate the implementation of Barcelona City Council playground plan.
4
This paper addresses these questions through a quantitative analysis. While a number of studies have been conducted on spatial accessibility to urban parks and urban green spaces, e.g. Apparicio et al., (2010), Wen et al., (2013), Reyes et al.,(2014), Ngom et al.,(2016) or Tang (2017), little research on spatial accessibility to playgrounds has been conducted (e.g. Talen and Anselin (1998) and Smoyer-Tomic et al., (2004)). The methods used to analyse the spatial accessibility to playgrounds use buffer zones and gravity measures. The analysis of the equity to spatial accessibility has been carried out with exploratory spatial data analysis. Congestion is not analysed and explanatory models have not been conducted. This study aims to fill this research gap. First, enhanced two-step floating catchment area method (Luo and Qi, 2009) is used to study the potential congestion to the playgrounds. Second, two spatial models are estimated in order to introduce socioeconomic factors into the explanation of accessibility and congestion. Finally, potential congestion and potential spatial access to the playgrounds are analysed conjointly using a multinomial logistic model to determine the typology of Barcelona census tracts based on spatial potential playground accessibility and congestion.
The organization of the article is as follows. The second section gives a brief overview of the literature on spatial accessibility to parks and playgrounds. The third section presents an overview of Barcelona city data and methodology used. Section four presents the main results. Finally, the last section summarizes the main points and provides hints for further extensions.
Literature review: accessibility to parks and playgrounds
A considerable amount of literature has been published on accessibility to urban parks. These studies constitute a general framework for digging deeper on the spatial potential accessibility and congestion of children’s playgrounds in urban areas. They use explanatory variables related to population characteristics to detect inequity situations. We summarize the recent contributions of this field below, and then we present a specific literature review on spatial accessibility to playgrounds.
Apparicio et al., (2010) evaluate the accessibility to parks for children in Montreal and verify the presence of some environmental inequity. They demonstrate that, even though there are variations in accessibility to parks and their facilities in Montreal, children are not victims of patent environmental injustice. Wen et al. (2013) use census tract data to analyse associations of access to parks with low income and ethnic minority population. They note that there are important, but the associations vary across the urbanization levels. Reyes et al. (2014) evaluate the relationship between the distribution of children population and conditions of accessibility to urban parks to understand their potential use and possible spatial disparities in the distribution of urban parks. They use household data and the expansion method (Casetti,1972) to assess possible variations in accessibility due to location and other individual and contextual attributes. Smiley et al. (2016) introduce a different aspect to the inequity to the access: the opinions and preferences of minorities about park usage. They investigate the preferences of low socioeconomic status and ethnic minorities. Based on 49 empirical studies, Rigolon (2016) shows that
5
there are inequities in terms of congestion to the urban parks. Low socioeconomic and ethnic minority people have access to fewer acres of parks per person than more privileged population.
However, the use of spatial accessibility measures alone in environmental equity studies has been the focus of recent criticism. Some scholars advocate combining potential park congestion along with park proximity (Boone et al. 2009 ; Sister, Wolch et Wilson 2010 ; Wolch, Wilson et Fehrenbach 2005). The postulate here is that parks in central neighbourhoods with high residential densities are likely to have far higher volumes of users, which could reduce their attractiveness and lead to an accelerated degradation of their facilities (i.e. park pressure). In this sense, studies in Baltimore and Los Angeles indicate that, compared with the white population, visible minorities live closer to parks which are however potentially more congested, i.e. with a high number of users in their immediate environment (Boone et al. 2009 ; Sister, Wolch et Wilson 2010).
The studies presented thus far provide evidence that the population characteristics in terms of income or minorities are relevant to detect inequities to the spatial potential accessibility and congestion to the parks. Nevertheless, the results of these studies are not conclusive and it is not possible to detect inequity associated with population characteristics in all cases.
Fewer studies on spatial potential accessibility to playgrounds have been conducted through a quantitative analysis. In their seminal paper Talen and Anselin (1998) use a spatial analytical perspective to evaluate distribution of children playgrounds in Tulsa, Oklahoma. They consider a potential measure based on the gravity model, the average travel distance and the distance to the nearest playgrounds as indicators of accessibility. The main result of this paper is methodological, the choice of accessibility measures has to be considered very carefully when the main goal is to analyse the spatial equity of a given resource distribution. Smoyer-Tomic et al. (2004) use local spatial autocorrelation to investigate the association between neighbourhood accessibility to playgrounds and demographic and social variables in Edmonton, Canada. Their results indicate that playgrounds are equitable distributed.
The majority of studies on playgrounds have been conducted through a qualitative analysis. Albert et al. (2011) analyse cultural differences between Jewish and Arab population on playground use in Haifa (Israel). Their results show significant differences regarding frequency of playgrounds visits and the extent of playground satisfaction. The accessibility of children with disabilities has been the focus of research on playgrounds and there is a broad literature on this subject (Tamm and Prellwitz, 1999; Prellwitz and Skär, 2007; Moore and Lynch, 2015). Olsen and Dieser (2012) following the previous studies of Tamm and Prellwitz (1999), Prellwitz et al. (2001) and Prellwitz and Skär (2007) found significant barriers that people with disabilities face including their access to playground spaces. Ripat and Becker (2012) study the experiences of playground use for children with disabilities and their caregivers. They conclude that few playgrounds are accessible to children with restricted mobility and the creation of playgrounds for all children will provide them with a venue to develop physically, socially and emotionally. Bennet et al.
6
(2012) introduce a new research field related to playgrounds. They examine how access to playground spaces is related to social interaction between parents. They use two measures, walking distance to the closest playground, as accessibility measure, and playground service area and population density, as potential congestion measures. Dewi (2012) explains the importance of the playgrounds in a developing country as Indonesia and he exposes a government plan to build playgrounds with high level of accessibility. Dietze (2013) investigates accessibility and usability of playgrounds for children or adults with mobility restrictions. Roemmich et al. (2014) analyse which measures must be adopted to improve children and adult’s physical activity at a playground. Moore and Lynch (2015) review the previous literature about accessibility and usability of playground environments. Findings indicate that numerous environmental barriers contribute to making playground environments inaccessible and unusable for children with disabilities. Siu et al. (2017) review the playgrounds in Hong Kong in terms of accessibility and availability and identify the inclusive issues that are found in the densely-populated city playgrounds. They also identify strategies to build and promote inclusive playing. McCarthy et al. (2017) study socio-demographic differences in the accessibility to playgrounds and their relationship with childhood obesity. In their work, no disparities were found by gender, socioeconomic status or race/ethnicity.
Summarizing this section, the studies focusing on green parks and playgrounds are mostly qualitative. The quantitative approach use spatial indicators constructed in GIS and is especially interested in the situation of ethnic groups and/or low-income populations. They point to
contradictory results,
depending on the study areas and population groups examined.
Data and Methods
An overview of the Barcelona City
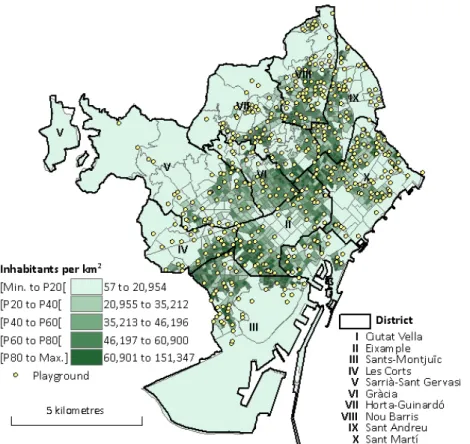
This study focuses on Barcelona city (Spain), which in 2016 was home to 1.60 million people spread across 101.9 km2 and where 8.40% of the population is younger than 10 years old. This municipality is the central part of Barcelona Metropolitan Area (BMA), which is the second most populous metropolis in Spain (with 3.23 million inhabitants). Barcelona represents the most densely populated city in Spain (15,702 inhabitants/ km2). We have only considered Barcelona city because playground data were available only for that geographic area. Barcelona city has 513 playgrounds. The City council‘s definition of playground is an area of public space located outdoors, specifically designed for children’s recreational use, which usually contains elements of equipment intended exclusively for playing. The municipality area is divided into 10 districts, 73 neighbourhoods and 1,061 census tracts, which are the spatial units of analysis in this study. Census tracts are small areas containing between 500 and 2000 residents designed for organizing pooling tables for elections. They provide the most suitable disaggregation level for the study of urban areas in Spain and they are small enough to capture spatial details.Figure 1 shows the location of the playgrounds and population density for Barcelona district division.
7
The city of Barcelona experienced many demographic changes during the decades 1990-2010 (Bayona-i-Carrasco and Pujadas-i-Rúbies, 2014). Urban saturation, immigration and the economic crisis changed urban towards a sprawl model as in other Mediterranean cities. The mononuclear compact city and the accompanying continuous metropolis lost its previous and almost absolute dominance. Sub-centres, with an important historical background, located out of the classical center took over the urban expansion. Concerning immigration, the case of Barcelona is particularly relevant: the percentage of immigrants over the total population has increased significantly within a very short period (from 6.34% in 2001 to 16.62% in 2016). The percentage of immigrants from non-EU countries in the total population increased from 4% in 2001 to 12.92% in 2011. Currently, immigrants are concentrated in two types of zones: the historical center, where housing is of poor quality, and the peripheral districts close to public transport and composed of relatively cheap housing built in the 1960s and 1970s. Martori and Apparicio (2011) demonstrate that rapid and strong population growth have resulted in significant changes in patterns of segregation and the emergence of ethnic enclaves.
Two sources of data, both at the census tract level, were obtained from the Spanish National Statistics Office: Censo de Población (2011), and the immigration data taken from the continuous registry of population (2001-2011) known as Padrón Municipal. The latter is a municipal (non-state) registry that includes both regular and irregular migrant populations. It contains data on the population by sex, age, place of birth, place of residence and nationality. It is available from 1996 onwards and is easily accessible for research purposes.
8
Methods
In order to evaluate the spatial potential accessibility of playgrounds, we use two measures: the minimum street network distance to the nearest playground and population group accessibility, calculated through the enhanced two-step floating catchment areas method. For the first measure, we computed the minimum network distance between census tracts centroids and playgrounds for each census tract in the study area. This measure, however, does not take account of the varying distribution of different population groups in the city. To examine this, catchment areas for different demographic groups are calculated. In this paper, the enhanced two-step floating catchment areas method was implemented in two steps following Luo and Qi (2009) and Ngui and Apparicio (2011). First, the catchment of playground location i is defined as all census tracts within a threshold network distance (1,000 metres). Within each catchment, we compute four network distances zones (0-250, 251-500, 501-750, 751-1000m). We account for all census tracts (k) that are within the threshold network distance zone (Dr) from playground i, and compute the weighted playground-to-population ratio Ri, within the catchment area as follows:
where Pk is the population of census tract k falling within the catchment i (𝑑𝑑𝑘𝑘𝑘𝑘∈ 𝐷𝐷𝑟𝑟), Si the number of playgrounds at location i, 𝑑𝑑𝑘𝑘𝑘𝑘 the network distance between k and j, and 𝐷𝐷𝑟𝑟 the rth network distance zone within the catchment. Wr is the distance weight for the rth network distance zone calculated from Gaussian function, capturing the distance decay of access to the playground i.
The second step consisted in summing up the final accessibility measure Aj at the census tract level. For each census tract j, we computed playgrounds that were within the threshold network distance (1,000 metres) in order to sum up the initial ratio Ri:
{
∑
≤ } ∈=
r ij d d j i jR
A
The higher the values of this measure are, the lower the potential playground congestion is, and vice versa. Social science regression models commonly applied to cross-section assume observations on decision-making units are independent of one another. This assumption is important to contemplate since violation results in regression estimates that are biased and inconsistent.
Due to the nature of spatial data, spatial autocorrelation needs to be taken into account for two main reason. First, it seems reasonable to think that when families undertake their location decision, they take account of the level of income, i.e. the decision of other families. In the same way, there could be factors located in closer zones that may have important influence in the location decision. Both arguments point to the inclusion of what has been called interacting agents or social interaction, see Anselin (2002) and
{
∑
∈ } ∈{∑
∈ } ∈{∑
∈ } ∈{∑
∈ } ∈{∑
∈ } ∈ + + + = = 3 4 2 1 4 3 2 1 d d k k d d k k d d k k d d k k i D d k r k i i kj kj kj kj r kj W P W P W P W P S W P S R9
LeSage and Pace (2009). Second, Martori et al (2011) demonstrate the importance of the clustering process to explain the location patterns of the immigrant population in Barcelona.
Social science regression models commonly applied to cross-section assume observations on decision-making units are independent of one another. This assumption is important to contemplate since violation results in regression estimates that are biased and inconsistent. Therefore, the presence of spatial autocorrelation in the data must be dealt with by means of spatial models.
First, we analyse the spatial autocorrelation of potential spatial accessibility, and the 0-9 years-old population, low income population and immigrant population. Therefore, we address the presence of spatial autocorrelation by capturing the spatial effects by means of spatial lag and spatial error models.
To introduce spatial effects, we estimated two models: The spatial lag model and the spatial error model. The spatial lag model is the most frequently encountered specification in spatial econometrics:
𝒚𝒚 = 𝜌𝜌𝑾𝑾𝒚𝒚 + 𝑿𝑿𝑿𝑿 + 𝜺𝜺,
where y is a (N ×1) vector of observations on a dependent variable measured at each of N locations,
X is a (N×k) matrix of independent variables, β is a (k×1) vector of parameters, ε is a (N×1) vector of
independent and identically distributed disturbances and ρ is a scalar spatial lag parameter. In our case, this means that the spatial potential accessibility and congestion of playgrounds in each unit (i.e. census tract) is modeled so as to depend on spatial potential accessibility and congestion on the neighbouring units captured by the spatial lag vector 𝑾𝑾𝒚𝒚. The spatial error model may be written out as follows:
𝒚𝒚 = 𝑿𝑿𝑿𝑿 + 𝒖𝒖, 𝒖𝒖 = 𝜆𝜆𝑾𝑾𝒖𝒖 + 𝜺𝜺,
where 𝝀𝝀 is a scalar spatial error parameter, and u is a spatially autocorrelated disturbance vector. In this model, the spatial influence comes only from the error terms. This means that the spatial potential accessibility and congestion of playgrounds in each unit is modeled so as to depend on the error terms in neighbouring units captured by the spatial error vector 𝑾𝑾𝒖𝒖.
Specification searches in spatial econometrics are a topic that has been discussed in the urban and regional literature. The standard approach in most empirical work is to start with a non-spatial linear regression model (OLS) and then to determine (e.g. by using the Moran’s I test) whether or not the model needs to be extended with spatial effects. Afterwards, if it is confirmed, the introduction of spatial effects is required to determine what kind of model should be used.
The results of the Lagrange Multiplier tests (LM-Lag and LM-Error) and their robust versions (RLM-Lag and RLM-Error) may be used to decide what kind of spatial dependence is the most appropriate to control for the presence of spatial dependence in the OLS residuals. Following the decision rule suggested by Anselin and Florax (1995), if LM-Lag is more significant than LM-Error and RLM-Lag is significant but RLM-Error is not (or is less significant), then the appropriate model is the spatial lag model. Equally, if LM-Error is more significant than LM-Lag and RLM-Error is significant but RLM-Lag is not (or is less
10
significant), then the appropriate model is the spatial error model. This classic approach is well known and has been widely used in econometric studies, e.g., Brasington and Hite (2005), Martori et al. (2016) or Akçagün (2017).
Finally, another approach is deployed. A multinomial logistic regression is applied and estimated with the different types of census tracts as the dependent variable, qualified according to spatial accessibility and spatial congestion of the playgrounds. The same socioeconomic variables that we use as independent variables in the spatial models are also introduced in this approach. This will enable us to assess whether these variables increase the probability of residing in a particular type of census tract depending on spatial accessibility and spatial congestion to the playgrounds. This second approach is well known and has been recently used in urban studies, e.g., Kryvobokov et al. (2015) and Apparicio et al. (2016).
Results
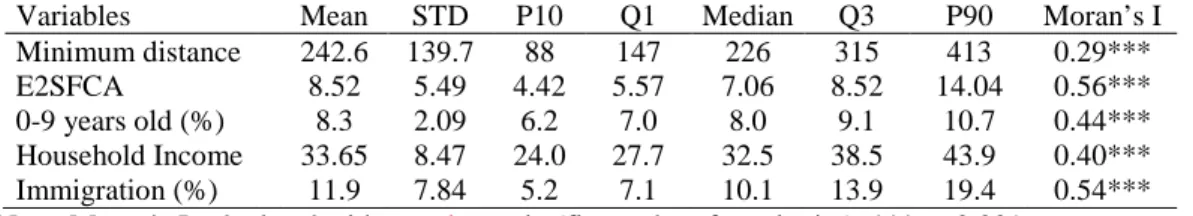
Results are divided into four parts. We first calculate univariate statistics for the spatial accessibility and potential congestion measures, 0-9 years-old population, low income population and immigrant population. We present empirical evidence of the presence of spatial autocorrelation in all variables analysed. To carry out this analysis we use a row standardized contiguity matrix of first-order rook weights. Other forms of contiguity matrix were tested, yielding similar qualitative and quantitative results. Second, we specify an econometric model to analyse the presence of inequities and we present empirical evidence of the presence of spatial autocorrelation in the OLS residuals. Third, we use LM test to choose the most accurate model. Finally, a multinomial logistic model is estimated to explain the typology of Barcelona census tracts based on potential playground congestion and accessibility. Table 1shows the univariate statistics for the variables used in the models, i.e. a measure of potential spatial access (Minimum distance) and a measure of potential congestion. Using Moran’s I, all variables are spatially autocorrelated.
Table 1. Univariate statistics for the variables used in the models
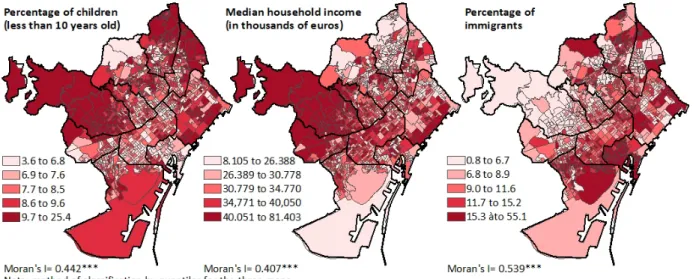
Variables Mean STD P10 Q1 Median Q3 P90 Moran’s I Minimum distance 242.6 139.7 88 147 226 315 413 0.29*** E2SFCA 8.52 5.49 4.42 5.57 7.06 8.52 14.04 0.56*** 0-9 years old (%) 8.3 2.09 6.2 7.0 8.0 9.1 10.7 0.44*** Household Income 33.65 8.47 24.0 27.7 32.5 38.5 43.9 0.40*** Immigration (%) 11.9 7.84 5.2 7.1 10.1 13.9 19.4 0.54*** Note: Moran’s I calculated with a rook matrix (first order of contiguity). *** p<0.001
11
Figure 2. a) Accessibility measure b) Congestion measure
Figures 2a-2b, show that the spatial potential accessibility and congestion measures vary
considerably across the Barcelona city. The potential congestion measure presents a very clear
pattern, the census tracts in the central area of the city (Districts of Ciutat Vella and Eixample)
present more congestion than peripheral areas in the north (Nou Barris, Sant Andreu and Sant
Martí) and in the south (Sants-Montjuïc). Other districts with high potential congestion are Sarrià
– Sant Gervasi and Gràcia. Accessibility measured with minimum distance to nearest playground
does not show such a clear pattern. Although some features can be detected: districts of Sant
Martí and Nou Barris also present a high level of accessibility but, in both areas, there are several
census tracts with very low accessibility. Another area with high level of accessibility is the
geographical intersection of Eixample, Les Corts and Sants-Montjuïc districts. Other areas with
the same feature are located in the north Horta-Ginardó and Sant Andreu districts.
12
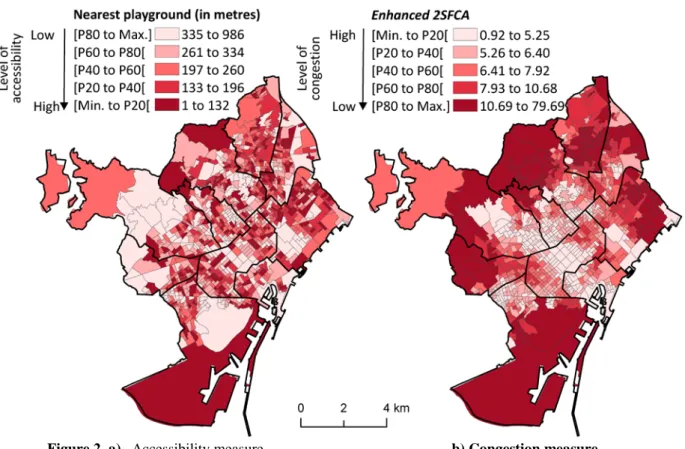
Figure 3. Typology of census tracts according accessibility and congestion
The quintiles cross tabulation of two measures (minimum distance to nearest playground and results of the enhanced two-step floating catchment areas method) is mapped in Figure 3. Nine categories of census tracts are thus obtained. Census tracts in dark grey (Q5 for the spatial accessibility and Q1 for the potential congestion), i.e. low accessibility and high congestion) cover 7.70% of the surface area of Barcelona city, 7.23% of the population and 6.69% of the population between 0-9 years old. Census tracts in light grey, cover 8.80% of the surface, 13.16% of the population and 12.70% of the population between 0-9 years old. These two types of census tracts are mostly in central districts of Barcelona: that is, Eixample district in its central area which is a paramount commercial area in Barcelona (with low population density) and Sarrià - Sant Gervasi, which is a district of high household income. Sants - Montjuïc district has 34.1% of its census tract with low accessibility and high congestion but the largest green park of the city, El Parc de Montjuïc, is located there (in dark red near to the sea in Figure 3).
Conversely, census tracts in green belong to the first and second quintile for the accessibility and fourth and fifth for the potential congestion: that is, high level of accessibility and low level of congestion. These census tracts cover 27.68% of the surface area of Barcelona city, 18.81% of the population and the 20% of the population between 0-9 years old. They are concentrated in the peripheral areas of the city and characterized by low levels of income and high percentage of immigrant population. Nou Barris district has 45.69% of its census tracts with high level of accessibility and low level of congestion. Other districts in this situation are Sant Martí (36.37%) and Sant Andreu (23.15%).
13
In Figure 3, in red (dark and light), we can see the census tracts with low level of accessibility (quintiles Q4 and Q5) but low level of congestion (quintiles Q3, Q4 and Q5). They cover 25.8% of the surface of Barcelona city and 19.61% of the population. Even more relevant is that they concentrate the 19.93% of the population between 0-9 years old of the city. These are mainly census tracts in districts of high level of income and low population density such as Sarrià-Sant Gervasi or Les Corts. Nonetheless, this type of spatial potential accessibility and congestion are also located in other areas of the city.
The areas in blue have high levels of congestion (Q1 and Q2), but high or medium levels of accessibility (Q1 to Q3). They only cover 9% of the surface of Barcelona city and 19.23% of the population, and they concentrate the 18.83% of the population between 0-9 years old. These areas can be found in the central Eixample and Gracia districts. Finally, census tracts in yellow have medium levels of accessibility and congestion. They cover 20.99% of the area of Barcelona City, 21.91% of the population and 21.77% of the population between 0-9 years old.
The main conclusion of this exploratory analysis is that the situation of the potential accessibility and congestion of playgrounds in Barcelona City is very unequal. Another conclusion is that the number of areas with low levels of accessibility and high congestion is very low (only 77 census tracts, 7.25% of the total).
To analyse the inequity in the potential spatial accessibility and congestion of the playgrounds in Barcelona City the next step is to carry out an econometric model where the dependent variable is minimum distance and results of the enhanced two-step floating catchment areas method and the explanatory variables follow the literature about environmental equity: percentage of children 0-9, household income and immigration population. In Figure 4, we show the spatial distribution for the three explanatory variables.
14
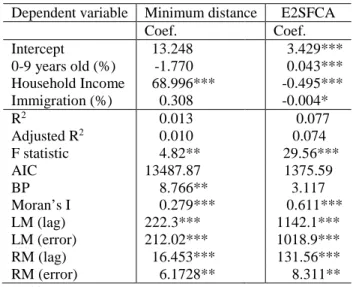
The results of the OLS estimation and the results of the Lagrange Multiplier tests (Lag and LM-Error) and their robust versions (RLM-Lag and RLM-LM-Error) are presented in table 2.
Table 2. OLS results and LM for spatial effects Dependent variable Minimum distance E2SFCA
Coef. Coef. Intercept 13.248 3.429*** 0-9 years old (%) -1.770 0.043*** Household Income 68.996*** -0.495*** Immigration (%) 0.308 -0.004* R2 0.013 0.077 Adjusted R2 0.010 0.074 F statistic 4.82** 29.56*** AIC 13487.87 1375.59 BP 8.766** 3.117 Moran’s I 0.279*** 0.611*** LM (lag) 222.3*** 1142.1*** LM (error) 212.02*** 1018.9*** RM (lag) 16.453*** 131.56*** RM (error) 6.1728** 8.311** Signif. codes: '***' 0.001 '**' 0.01 '*' 0.05 '
Results in Table 2 show, the initial analysis of the OLS results reveal the presence of spatial autocorrelation in the residuals. Note also that R2 coefficient indicates that the relationship between measures of spatial potential accessibility, congestion and explanatory variables is very weak. Finally, the Moran’s I indicate the presence of spatial autocorrelation in the residuals (the significance of Moran’s I is obtained by bootstrap). The presence of heteroscedasticity (for the minimum distance), the small R2 statistic and, especially, the presence of spatial autocorrelation, point to the necessity of reconsidering the model, which is the purpose of the next step in our empirical strategy.
Since we are dealing with a known spatial phenomenon, it is important to introduce spatial effects into the specifications. Following the classic approach, we compute the robust versions of the Lagrange Multiplier tests (LM) for the spatially lagged dependent variable (RLM-Lag) and for error dependence (RLM-Error). The results presented in Table 2 show that LM-Lag and LM-Error are significant and indicate the need to include a spatial component in the model. Generally, in this situation, statisticians choose the spatial model with the most significant LM or robust version of the LM test. In our case, RLM-Lag is significant but RLM-Error is not. These results indicate that the spatial lag model is preferable to a spatial error model. The results shown in this section were obtained by using the R library, spdep developed by Bivand, et al. (2013) and Bivand and Piras (2015).
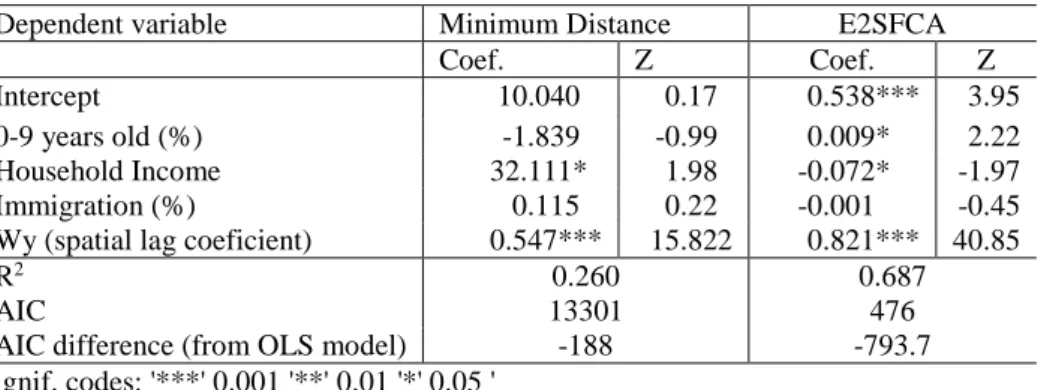
15 Table 3. Spatial models
Dependent variable Minimum Distance E2SFCA
Coef. Z Coef. Z
Intercept 10.040 0.17 0.538*** 3.95
0-9 years old (%) -1.839 -0.99 0.009* 2.22
Household Income 32.111* 1.98 -0.072* -1.97
Immigration (%) 0.115 0.22 -0.001 -0.45
Wy (spatial lag coeficient) 0.547*** 15.822 0.821*** 40.85 R2 AIC 0.260 13301 0.687 476
AIC difference (from OLS model) -188 -793.7
Signif. codes: '***' 0.001 '**' 0.01 '*' 0.05 '
Table 3 shows the results of lag model. We have estimated two models using a maximum likelihood (ML). However, because non-normality of the error terms and heteroscedasticity may affect the results, we have also estimated the lag model using Generalized Methods of Moments (GS2SLS) as proposed by Arraiz et al. (2010). The results obtained are qualitatively and quantitatively similar. The spatial lag coefficient is positive and highly significant, indicating strong spatial autocorrelation in the two dependent variables. A statistically significant positive spatial lag coefficient provides evidence that spatial dependence is correctly modeled and that there is a relationship between potential accessibility and potential congestion of playgrounds measured for each census tract and the state in the surrounding census tracts.
For the two models only household income is significant; the percentage of children is only significant for the measure of potential congestion. The percentage of immigration are not significant. The positive value of the household income coefficient for minimum distance means that census tracts with high level of income have more minimum distance to access to the playgrounds. The negative value of the household income coefficient for the potential congestion indicates that an increase in the income level in the census tract is positively associated with higher level of potential congestion (lower values of the enhanced two-step floating catchment areas method). The square of Pearson’s correlation coefficient (R2) between the measures of accessibility and congestion and the fitted values obtained from each model are also presented as a measure of goodness of fit. Notice that the spatial models fit much better than the OLS models.
16
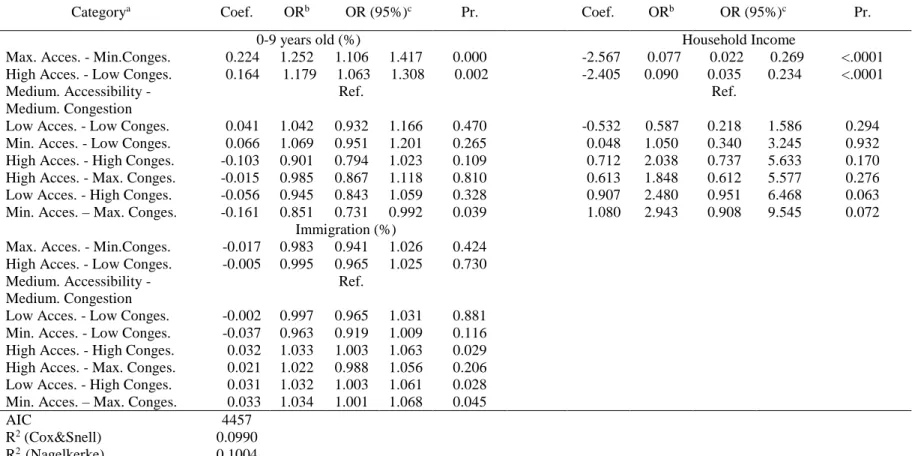
Table 4. Multinomial logistic regression (dependent variable: classification of two playgrouns indicators)
Categorya Coef. ORb OR (95%)c Pr. Coef. ORb OR (95%)c Pr.
0-9 years old (%) Household Income
Max. Acces. - Min.Conges. 0.224 1.252 1.106 1.417 0.000 -2.567 0.077 0.022 0.269 <.0001 High Acces. - Low Conges. 0.164 1.179 1.063 1.308 0.002 -2.405 0.090 0.035 0.234 <.0001 Medium. Accessibility -
Medium. Congestion
Ref. Ref.
Low Acces. - Low Conges. 0.041 1.042 0.932 1.166 0.470 -0.532 0.587 0.218 1.586 0.294 Min. Acces. - Low Conges. 0.066 1.069 0.951 1.201 0.265 0.048 1.050 0.340 3.245 0.932 High Acces. - High Conges. -0.103 0.901 0.794 1.023 0.109 0.712 2.038 0.737 5.633 0.170 High Acces. - Max. Conges. -0.015 0.985 0.867 1.118 0.810 0.613 1.848 0.612 5.577 0.276 Low Acces. - High Conges. -0.056 0.945 0.843 1.059 0.328 0.907 2.480 0.951 6.468 0.063 Min. Acces. – Max. Conges. -0.161 0.851 0.731 0.992 0.039 1.080 2.943 0.908 9.545 0.072
Immigration (%)
Max. Acces. - Min.Conges. -0.017 0.983 0.941 1.026 0.424 High Acces. - Low Conges. -0.005 0.995 0.965 1.025 0.730 Medium. Accessibility -
Medium. Congestion
Ref.
Low Acces. - Low Conges. -0.002 0.997 0.965 1.031 0.881 Min. Acces. - Low Conges. -0.037 0.963 0.919 1.009 0.116 High Acces. - High Conges. 0.032 1.033 1.003 1.063 0.029 High Acces. - Max. Conges. 0.021 1.022 0.988 1.056 0.206 Low Acces. - High Conges. 0.031 1.032 1.003 1.061 0.028 Min. Acces. – Max. Conges. 0.033 1.034 1.001 1.068 0.045
AIC 4457
R2 (Cox&Snell) 0.0990 R2 (Nagelkerke) 0.1004
a See the categories in Fig. 3. Reference category: Yellow. b Odds ratio. c 95% Wald confidence limits. Max. Acces: maximun accessibility. Min. Conges.: minimum congestion.
17
Finally, a multinomial logistic regression model is built with the yellow areas in Figure 3 (census tracts with medium level of accessibility and medium level of potential congestion of playgrounds) as the reference category. This model allows us to determine whether the proportion of each of the three explanatory variables increases the probability that the census tract belongs to one of the categories in the cross tabulation of potential accessibility and congestion, compared with the yellow category in the tabulation. The results shown in this section were obtained by using the R library nnet (Venables and Ripley, 2002).
The results indicate that the odd ratio for children (0-9 years old) is greater than one and significant for the census tracts with low potential congestion and high accessibility (census tracts in green in Figure 3). However, the coefficients are not significant at a threshold of 5% for categories that represent other situations of census tract. This means that, all other things being equal, a raise in the percentage of children increases the probability of their census tracts belonging to high potential accessibility and low potential congestion (dark green: 1.252; light green: 1.179) shift to medium situation (yellow), i.e. do not improve their situation.
The situation is different for household income. The odds ratios are significant for the same categories of census tracts (green) but now the odds ratios are less than one. This means that an increase in the household income decreases the probability of their census tracts being in areas characterized by intermediate situation in terms of potential accessibility and congestion.
Finally, the results indicate that for the immigrant population percentage only the blue, grey and dark
grey categories are significant at a threshold of 5%. For these categories of census tracts, the odd ratios
are greater than one. This means that an increase in the percentage of immigrant population increases the probability of their census tracts being in areas characterized by medium situation in terms of potential accessibility and congestion. In the case of grey and dark grey it implies an improvement in their situation in terms of potential accessibility and congestion. The blue census tracts improve their situation only for their potential congestion.
Discussion and conclusion
We have presented different types of analysis to study the spatial potential accessibility of playgrounds in Barcelona City, for different demographic groups. The main objective of our analysis is to explain differences between neighbourhoods in spatial access. Previous studies have not taken these differences into account. To study these differences based on socioeconomic characteristics of the population it is necessary to introduce spatial effects in the empirical approach. The results indicate that there is spatial autocorrelation for the measures of spatial potential accessibility, potential congestion and socioeconomic variables. Moreover, the present work provides an empirical strategy to explain in conjoint form playground spatial potential accessibility and potential congestion through the quintile cross tabulation of two measures: the minimum distance to the playground (potential spatial access) and the
18
enhanced two-step floating catchment area method (potential congestion). A multinomial logistic model is estimated to explain the typology of Barcelona census tracts based on spatial potential accessibility and congestion of playgrounds.
The OLS model results show that it is necessary to introduce spatial effects in the model. When we introduce spatial effects, the explanatory power is much higher. It is interesting to note that the household income is significant to explain spatial potential playground accessibility and potential congestion but with the opposite sign. In general terms, census tracts with high levels of income have more minimum distance (less spatial accessibility) and less value of the enhanced two-step floating catchment area method so high level of potential congestion. Conversely, census tracts with low household income have better accessibility and potential congestion. These results are not in line with Rigolon's (2016) findings which showed that areas with low income have access to fewer acres of parks per person. On the other hand, Wen et al., (2013) note that the associations of access and low income population vary across urbanization levels.They found that non-rural census tracts of higher poverty were closer to parks. Similarly, our results show that low household income population have better accessibility to the playgrounds.
In line with McCarthy et al., (2017) our study also found that the percentage of immigration population is not significant to explain differences in spatial potential accessibility and potential congestion to the playgrounds. Analysing the explanatory power of the percentage of children, the results show a significant and positive association only with the potential congestion.
Ours results also showed that a key policy priority in the Barcelona City Council plan must be to increase the number of playgrounds in areas with low income populations to reduce the potential congestion (Districts of Ciutat Vella and some areas of Sants – Montjüic). Clearly, future research should attempt to replicate these results when the City Council plan had finished to evaluate whether the potential congestion in these districts is reduced. In terms of directions for future research, further work could be enhanced by including characteristics of playground facilities.
References
Akçagün, Pelin. 2017. “Provincial Growth in Turkey: A Spatial Econometric Analysis.” Applied Spatial
Analysis and Policy 10 (2): 271–99.
Albert, G., H. Abo-Kalla, and M. Baron. 2011. “Transport and Environmental Variables and the Impact of Cultural Differences on Playground Use.” Journal of Urban Planning and Development 137 (3): 291–97.
Anselin, L, and RJGM Florax. 1995. “Small Sample Properties of Tests for Spatial Dependence in Regression Models: Some Further Results.” In New Directions in Spatial Econometrics. Springer 21-74.
Anselin, L. 2002. "Under the hood issues in the specification and interpretation of spatial regression models." Agricultural Economics 27(3), 247–267.
Apparicio, Philipp, Marie-Soleil Cloutier, Anne-Marie Séguin, and Josefina Ades. 2010. “Accessibilité Spatiale Aux Parcs Urbains Pour Les Enfants et Injustice Environnementale. Exploration Du Cas
19
Montréalais.” Revue Internationale de Géomatique 20 (3): 363–89.
Apparicio, Philippe, Thi Thanh Hien Pham, Anne Marie Séguin, and Jean Dubé. 2016. “Spatial Distribution of Vegetation in and around City Blocks on the Island of Montreal: A Double Environmental Inequity?” Applied Geography 76: 128–36.
Arraiz, Irani, David M Drukker, Harry H Kelejian, and Ingmar R Prucha. 2010. “A Spatial Cliff and Ord Type Model with Heteroskedastic Innovations: Small and Lartge Sample Results.” Journal of
Regional Science 50 (2): 592–614.
Bayona-i-Carrasco, Jordi, and Isabel Pujadas-i-Rúbies. 2014. “Movilidad Residencial Y Redistribución de La Población Metropolitana: Los Casos de Madrid Y Barcelona.” EURE (Santiago) 40 (119): 261–87.
Bennet, Scott A., Nikolaos Yiannakoulias, Allison M. Williams, and Peter Kitchen. 2012. “Playground Accessibility and Neighbourhood Social Interaction Among Parents.” Social Indicators Research 108: 199–213.
Bivand, Roger, Jan Hauke, and Tomasz Kossowski. 2013. “Computing the Jacobian in Gaussian Spatial Autoregressive Models: An Illustrated Comparison of Available Methods.” Geographical Analysis 45 (2): 150–79.
Bivand, Roger, and Gianfranco Piras. 2015. “Comparing Implementations of Estimation Methods for Spatial Econometrics.” Journal of Statistical Software 63 (18): 1-36.
Brasington, David M, and Diane Hite. 2005. “Demand for Environmental Quality: A Spatial Hedonic Analysis.” Regional Science and Urban Economics 35 (1). Elsevier: 57–82.
Boone, Christopher, Geoffrey. L. Buckley, J. Morgan Grove and Chona Sister. 2009. " Parks and people: an environmental justice inquiry in Baltimore, Maryland." Annals of the Association of
American Geographers 99 (4): 767-787.
Casetti, E. 1972. “Generating Models by the Expansion Method: Applications to Geographic Research.”
Geographical Analysis 28: 281–298.
Dewi, Santy Paulla. 2012. “How Does The Playground Role in Realizing Children-Friendly-City?”
Procedia - Social and Behavioral Sciences 38: 224–33.
Dietze, Beverlie. 2013. “How Accessible and Usable Are Our Neighbourhood Playgrounds for Children Who Have Mobility Restrictions or Use Mobility Devices?” Canadian Children 38 (2): 14–20. Fjortoft, Ingunn. 2001. “The Natural Environment as a Playground for Children: The Impact of Outdoor
Play Activities in Pre-Primary School Children.” Early Childhood Education Journal 29 (2): 111– 17.
Giles-Corti, Billie, Anna Timperio, Fiona Bull, and Terri Pikora. 2005. “Understanding Physical Activity Environmental Correlates: Increased Specificity for Ecological Models.” Exercise and
Sport Sciences Reviews 33 (4): 175–81.
Kaczynski, Andrew T., and Karla A. Henderson. 2007. “Environmental Correlates of Physical Activity: A Review of Evidence about Parks and Recreation.” Leisure Sciences 29 (4): 315–54.
Kryvobokov, Marko, Alain Bonnafous, and Dominique Bouf. 2015. “Simulating Residential Location Choice at Different Geographical Scales: The Case of Lyon.” Applied Spatial Analysis and Policy 8 (4): 351–70.
20
LeSage, J.P., Pace, R.K. 2009. Introduction to spatial econometrics. CRC Press, Boca Raton
Luo, Wei, and Yi Qi. 2009. “An Enhanced Two-Step Floating Catchment Area (E2SFCA) Method for Measuring Spatial Accessibility to Primary Care Physicians.” Health and Place 15: 1100–1107. Martori, Joan Carles, and Philippe Apparicio. 2011. “Changes in Spatial Patterns of the Immigrant
Population of a Southern European Metropolis: The Case of the Barcelona Metropolitan Area (2001-2008).” Tijdschrift Voor Economische En Sociale Geografie 102 (5): 562–581. Martori, Joan Carles, Rafa Madariaga, and Ramon Oller. 2016. “Real Estate Bubble and Urban
Population Density: Six Spanish Metropolitan Areas 2001–2011.” Annals of Regional Science 56(2): 369-392.
McCarthy, Shea M., S. Morgan Hughey, and Andrew T. Kaczynski. 2017. “Examining
Sociodemographic Differences in Playground Availability and Quality and Associations with Childhood Obesity.” Childhood Obesity 13 (4): 1–8.
Moore, R. C., & Cosco, N. G. 2010. “Using Behaviour Mapping to Investigate Healthy Outdoor Environments for Children and Families: Conceptual Framework, Procedures and Applications.” In Innovative Approaches to Research Excellence in Landscape and Health. London: Taylor & Francis.
Moore, Alice, and Helen Lynch. 2015. “Accessibility and Usability of Playground Environments for Children under 12: A Scoping Review.” Scandinavian Journal of Occupational Therapy 22 (5): 331–44.
Ngom, Roland, Pierre Gosselin, and Claudia Blais. 2016. “Reduction of Disparities in Access to Green Spaces: Their Geographic Insertion and Recreational Functions Matter.” Applied Geography 66: 35–51.
Ngui, André Ngamini, and Philippe Apparicio. 2011. “Optimizing the Two-Step Floating Catchment Area Method for Measuring Spatial Accessibility to Medical Clinics in Montreal.” BMC Health
Services Research 11:166.
Olsen, Heather M., and Rodney B. Dieser. 2012. “I Am Hoping You Can Point Me in the Right Direction Regarding Playground Accessibility”: A Case Study of a Community Which Lacked Social Policy toward Playground Accessibility.” World Leisure Journal 54 (3): 269–79.
Prellwitz, Maria, and Lisa Skär. 2007. “Usability of Playgrounds for Children with Different Abilities.”
Occup. Ther. Int 14 (3): 144–55.
Prellwitz, Maria, Maare Tamm, and Rafael Lindqvist. 2001. “Are Playgrounds in Norrland (Northern Sweden) Accessible to Children with Restricted Mobility?” Scandinavian Journal of Disability
Research 3 (1): 56–68.
Reyes, Mario, Antonio Páez, and Catherine Morency. 2014. “Walking Accessibility to Urban Parks by Children: A Case Study of Montreal.” Landscape and Urban Planning 125: 38–47.
Rigolon, Alessandro. 2016. “A Complex Landscape of Inequity in Access to Urban Parks: A Literature Review.” Landscape and Urban Planning 153: 160–69.
Ripat, Jacquie, and Pam Becker. 2012. “Playground Usability: What Do Playground Users Say?”
Occupational Therapy International 19: 144–53.
Roemmich, James N., Joley E. Beeler, and LuAnn Johnson. 2014. “A Microenvironment Approach to Reducing Sedentary Time and Increasing Physical Activity of Children and Adults at a
21
Sister, Chona, Jennifer Wolch and John P. Wilson. 2010. "Got green? addressing environmental justice in park provision." GeoJournal 75 (3): 229-248.
Siu, Kin Wai Michael, Yi Lin Wong, and Mei Seung Lam. 2017. “Inclusive Play in Urban Cities: A Pilot Study of the Inclusive Playgrounds in Hong Kong.” Procedia Engineering 198 (September 2016): 169–75.
Smiley, Kevin T., Tanvi Sharma, Allen Steinberg, Sally Hodges-Copple, Emily Jacobson, and Lucy Matveeva. 2016. “More Inclusive Parks Planning.” Environmental Justice 9 (1): 1–7.
Smoyer-Tomic, Karen E., Jared N. Hewko, and M. John Hodgson. 2004. “Spatial Accessibility and Equity of Playgrounds in Edmonton, Canada.” Canadian Geographer 48 (3): 287–302. Talen, E., and Luc Anselin. 1998. “Assessing Spatial Equity: An Evaluation of Measures of
Accessibility to Public Playgrounds.” Environment and Planning A 30: 595–613.
Tamm, Maare, and Maria Prellwitz. 1999. “Attitudes of Key Persons to Accessibility Problems in Playgrounds for Children with Restricted Mobility: A Study in a Medium-Sized Municipality in Northern Sweden.” Scandinavian Journal of Occupational Therapy 6 (4): 166–73.
Tang, Bo sin. 2017. “Explaining the Inequitable Spatial Distribution of Public Open Space in Hong Kong.” Landscape and Urban Planning 161: 80–89.
Turner, Joan. 2009. “ Everybody Needs a Break! Responses to a Playgarden Survey. ” Pediatric Nursing 35 (1): 27–34.
Venables, W. N. & Ripley, B. D. 2002. Modern Applied Statistics with S. Fourth. New York: Springer. Veugelers, Paul, Fortune Sithole, Sharon Zhang, and Nazeem Muhajarine. 2008. “Neighborhood
Characteristics in Relation to Diet, Physical Activity and Overweight of Canadian Children.”
International Journal of Pedistric Obesity 3: 152–59.
Wen, Ming, Xingyou Zhang, Carmen D. Harris, James B. Holt, and Janet B. Croft. 2013. “Spatial Disparities in the Distribution of Parks and Green Spaces in the USA.” Annals of Behavioral
Medicine 45 (S1): 18–27.
Wolch, Jennifer, John P. Wilson and Jed Fehrenbach. 2005. "Parks and park funding in Los Angeles: An equity-mapping analysis." Urban Geography 26 (1): 4-35.