HAL Id: hal-02562406
https://hal-mines-albi.archives-ouvertes.fr/hal-02562406
Submitted on 4 May 2020
HAL is a multi-disciplinary open access
archive for the deposit and dissemination of
sci-entific research documents, whether they are
pub-lished or not. The documents may come from
teaching and research institutions in France or
abroad, or from public or private research centers.
L’archive ouverte pluridisciplinaire HAL, est
destinée au dépôt et à la diffusion de documents
scientifiques de niveau recherche, publiés ou non,
émanant des établissements d’enseignement et de
recherche français ou étrangers, des laboratoires
publics ou privés.
Microstructure Evolution of Selective Laser Melted
Inconel 718: Influence of High Heating Rates
Seyedmohammad Tabaie, Farhad Rezai-Aria, Mohammad Jahazi
To cite this version:
Seyedmohammad Tabaie, Farhad Rezai-Aria, Mohammad Jahazi. Microstructure Evolution of
Se-lective Laser Melted Inconel 718: Influence of High Heating Rates. Metals, MDPI, 2020, 10 (5),
pp.1-21/587. �10.3390/met10050587�. �hal-02562406�
Metals 2020, 10, 587; doi:10.3390/met10050587 www.mdpi.com/journal/metals
Article
Microstructure Evolution of Selective Laser Melted
Inconel 718: Influence of High Heating Rates
Seyedmohammad Tabaie 1,*, Farhad Rézaï-Aria 2 and Mohammad Jahazi 1,*
1 Department of Mechanical Engineering, École de Technologie Supérieure (ÉTS), Montreal, QC H3C 1K3, Canada
2 Institut Clément Ader (ICA), Université de Toulouse, CNRS, IMT Mines Albi, INSA, UPS, ISAE, Campus Jarlard, 81013 Albi, France; farhad.rezai-aria@mines-albi.fr
* Correspondence: Seyedmohammad.tabaie.1@etsmtl.net (S.T.); Mohammad.Jahazi@etsmtl.ca (M.J.);
Tel.: +1-514-396-8974
Received: 3 April 2020; Accepted: 28 April 2020; Published: 29 April 2020
Abstract: Inconel 718 (IN718) superalloy samples fabricated by selective laser melting (SLM) were
submitted to different heating cycles and their microstructural characteristics were investigated. The selected heating rates, ranging from 10 °C/min to 400 °C/s, represent different regions in the heat-affected zone (HAZ) of welded additively manufactured specimens. A combination of differential thermal analysis (DTA), high-resolution dilatometry, as well as laser confocal and electron microscopy were used to study the precipitation and dissolution of the secondary phases and microstructural features. For this purpose, the microstructure of the additively manufactured specimen was investigated from the bottom, in contact with the support, to the top surface. The results showed that the dissolution of γ” and δ phases were delayed under high heating rates and shifted to higher temperatures. Microstructural analysis revealed that the Laves phase at the interdendritic regions was decomposed in specific zones near the surface of the samples. It was determined that the thickness and area fraction of these zones were inversely related to the applied heating rate. A possible mechanism based on the influence of heating rate on Nb diffusion in the interdendritic regions and core of the dendrites is proposed to interpret the observed changes in the microstructure.
Keywords: selective laser melting; Inconel 718; high heating rate; differential thermal analysis;
phase transformation
1. Introduction
Selective laser melting (SLM) is an additive manufacturing (AM) process which uses a laser as a source to melt the metal powder in the form of deposited successive layers on top [1]. This technology has been used to fabricate components with complex geometries (e.g., gas turbine blades, injection molds, heat exchangers) with a close to full density (close to 99.7%), which is difficult and costly to acquire, as well as through conventional casting routes and, in exceptional cases, even with forging routes [2–5]. IN718 alloy is the workhorse superalloy extensively used in energy and transportation industries and therefore is a promising candidate for an advanced manufacturing technology such as SLM method in aerospace applications [6–8]. Despite its good weldability, IN718 is known for its susceptibility to welding defects such as strain age-cracking and hot cracking, particularly, hot cracking in the heat-affected zone (HAZ) during welding [9,10]. Considering the continuous expansion of additively manufactured components from IN718 and the inherent heterogeneous nature of an AM microstructure, it is of both scientific and technological interest to better understand
the evolution of an AM microstructure to rapid thermal cycling and characteristic of welding operations.
Typically, the low melting point compounds can liquate within the HAZ during conventional fusion welding operations such as gas tungsten arc welding (GTAW) and electron beam welding (EBW). The temperature in the HAZ for wrought IN718 and SLM IN718 during fusion welding is in the range of 950–1200 °C with the heating rate in the range of 50–350 °C/s [9,11–14], while it is between 950 and 1100 °C (with the heating rate in the range of 100–500 °C/s) in solid-state welding methods, such as linear or inertia friction welding [15–17]. At these temperatures, grain boundary liquation in HAZ could cause the constitutional liquation of Niobium (Nb)-rich particles such as Laves phase, carbides, and interdendritic γ/Laves eutectic formed during rapid solidification. These phases are usually found in high concentrations in the interdendritic regions in the microstructure of conventionally as-printed parts [6,18–20]. Sui et al. [18] investigated the formation of δ phase and proposed two possible mechanisms. The first one relates the formation of the δ phases around the interdendritic Laves phases to the existence of a chemical gradient that promotes the diffusion of Nb to the grain boundaries and become nucleation sites for the δ phase. The second mechanism is based on the lack of coherency between Laves phase and matrix that promotes the diffusion of Nb and formation of Nb rich zones (~10 wt.%) that become nucleation sites for the δ phase.
Qian and Lippold [21] related intergranular HAZ liquation cracking to the combined effects of δ phase dissolution, boron carbide constitutional liquation, and grain boundary segregation. On the other hand, Zhang and Ojo [22,23] reported that the δ phase could actually constitutionally liquate in the HAZ during welding above their solvus (about 1010 °C in IN718) and enrich the grain boundary with Nb. Thrappel et al. [24] and Muralidharan et al. [25] reported that during rapid heating, second phase eutectic grain boundary precipitates such as γ/Laves or γ/NbC (at 1200 °C) present in the HAZ of wrought IN718 melted due to the lack of time for dissolution into the matrix. In very recent studies, Raza et al. [9,11] studied the cracking in the HAZ of GTAWed SLM IN718 samples and related it to the melting of the Laves phase in the interdendritic regions. However, in the above works the influence of heating rate on microstructure evolution was not investigated.
The influence of heating rate on the evolution of the secondary phases in the microstructure of wrought IN718 has been investigated by many researchers. For instance, Roder et al. [26] reported that δ and γ” particles are dissolved in HAZ zone during friction welding of wrought IN718. Niang et al. [27] reported that the dissolution kinetics of γ″ and δ phases is quite sluggish in forged IN718 and not change by increasing the heating rate. Antonsson and Fredriksson [28] reported that the diffusion rate and/or the solubility of Nb in the γ phase increased at higher cooling rates. Knorovsky et al. [29] and Zhang et al. [23] reported that, during rapid heating (more than 100 °C/s), the chemical composition of formed phases are under non-equilibrium thermodynamic states and can significantly deviate from the assumed solid-state equilibrium dissolution conditions, which may drastically contribute to HAZ micro-cracking. Under rapid heating conditions, due to limited available time for homogenization by diffusion of atoms, δ phases can survive above their thermodynamic equilibrium solvus temperature which is beyond the γ-Laves eutectic temperature. However, no data is available on the influence of heating rate on the dissolution and reprecipitation kinetics of the above phases. It must be noted that the solidification thermal regime during conventional casting and additive manufacturing are expected to be very different and hence influence the phase changes. For example, the primary interdendritic distance in conventionally cast IN718 parts ranges between 80 and 220 µm (primary dendrite arm spacing) [30] while it is expected to be much smaller (0.4–3 µm) in as-SLM parts due to the difference in the solidification and subsequent thermally induced regimes [31].
In the present investigation, the evolution of second phase particles in the microstructure of SLM IN718 submitted to rapid thermal cycling will be addressed. A better understanding of the response of an AM structure to rapid heating rates is crucial for predicting HAZ and HAZ cracking susceptibility in welded AM parts, where very little data are available. The obtained results will also help design procedures for welding of additively manufactured components.
2. Materials and Methods
2.1. Materials
The recommended SLM parameters for fabrication IN718 superalloy specimens are reported in (Table 1). SLM-125HL machine (SLM Solution, Lübeck, Germany) at IMT-Mines Albi, France was used for the manufacturing of the specimens.
Table 1. SLM parameters to fabricate Inconel 718 alloy specimens.
P (W) v (mm/s) H (μm) t (μm)
275 760 120 50
In the above table, P is laser beam power, v is laser-scanning velocity, while H and t are the hatch spacing and the thickness of the deposited layers, respectively.
The volume energy density (VED) was estimated using the following relation: =
. . = 60.307 (1)
IN718 powders had spherical shape with a particle size distribution between 20–70 µm. Two cylindrical specimens with two different diameters (d = 6 mm and d = 3 mm) and identical length (L = 40 mm) were fabricated for the thermal analysis experiments. A thin disk-shaped specimen (d = 25 mm and thickness = 3 mm) was also fabricated for room temperature (RT) post-fabrication chemical analysis by Atomic Emission Spectroscopy (AES). The results are reported in Table 2 and are based on an average of five measurements in different locations of the disk shape sample. The laser beam scanning orientation and the building direction were collinear with the Z-direction displacement and perpendicular to fabrication platform. The laser beam scanning was rotated successively for 67° in each layer to reduce microstructural anisotropy.
Table 2. The average chemical composition of SLM IN718 (wt.%).
Ni Fe Cr Co Al Ti Nb Mo C B Zr Si
Bal. 15.7 20.54 0.1 0.34 1.17 5.1 3.13 0.04 0.002 0.018 0.01
2.2. Thermal Analysis
The low to medium heat treatment cycles were performed using a Diamond PerkinElmer differential thermal analysis (DTA). To this end, 2 mm thick disk-type samples were sliced by Electro Discharge Machining (EDM) from the top area of the fabricated cylinders with d = 3 mm. The samples were heated in platinum crucibles and flowing air up to 1200 °C (before melting) with rates of 10, 15, 25, 50, 80, and 100 °C/min and then cooled down to room temperature with an identical rate. The DTA tests were repeated two times for heating rates lower than 80 °C/min (10, 15, 25, and 50 °C/min) and three times for the 80 and 100 °C/min.
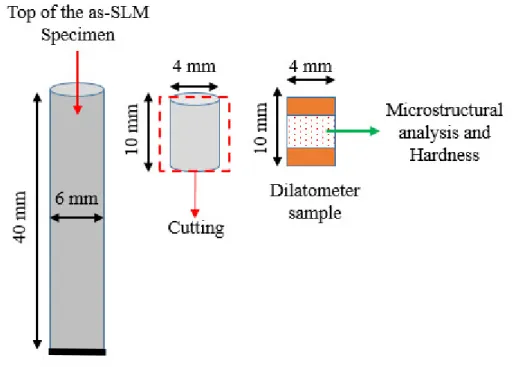
For the high heating rate experiments, three thermal cycles with rapid heating rate of 100, 200, and 400 °C/s with an identical dwell time (10 s) and a quenching rate of 65 °C/s by Helium gas were applied, as schematically shown in Figure 1, using the high resolution TA Instrument A/D 805 dilatometer (New Castle, DE, USA). The 4 mm × 10 mm dilatometry samples were extracted by EDM from the 6 mm diameter fabricated bars. These samples were heated to 1000 °C by induction heating in the dilatometer machine and for each test. The heating and cooling profiles were recorded using a S-type thermocouple welded to the center of the specimen. It must be noted that in the present work the dilatometer was only used for applying the selected high heating rates and no analysis was carried out in relation to the dilatometry curves.
Figure 1. The time-temperature cooling cycles of SLM IN718 specimens with three
heating-up rates to achieve 1000 °C and a dwell time of 10 s and a final identical quenching constant rate of 65 °C/s.
Figure 2. Schematic of dilatometer samples and their designated location for microstructural analysis
and micro-hardness measurements.
2.3. Microstructural Investigations
The as-SLM IN718 and post-dilatometry tested specimens were characterized by LEXT OLS4100 laser confocal optical microscopy (OM) (Olympus, Tokyo, Japan) as well as scanning electron microscopy (SEM) (Hitachi TM3000 and SU-8230 field emission-SEM equipped with a Bruker EDS detector) (Tokyo, Japon). Examination of the as-SLM samples was conducted in the transverse and longitudinal directions (Figure 2). The OM and SEM samples were cold etched to reveal the dendritic microstructure and precipitates using standard metallographic procedures in Kalling No.2′s reagent (5 g CuCl2, 100 mL HCl, and 100 mL ethanol). The size and morphology of the precipitates was characterized at micro scales via OM and SEM images analysis. The average dendrite arm spacing
(DAS) and volume fraction of all precipitates were quantified and calculated on the basis of digitized micrographs and standard image analysis software (Image J). Finally, hardness testing was conducted on the middle of longitudinal cross-section of as-fabricated samples after high heating rate tests (Figure 2). A Future-Tech Vickers micro-hardness machine under a dead-load of 200 gf and a dwell time of 15 s was used for the tests. The measurements were repeated at least three times for each condition and the average values are reported.
3. Results and Discussion
3.1. Characterization of the As-SLM Samples
The initial microstructure of the as-SLM fabricated, built-in the Z direction, is shown in Figure 3 where the periodic melt pools generated after each deposited layer is clearly revealed. For each layer, the melting pool embodies the molten powder particles of the freshly deposited layer along with the previously sub layer material already solidified. As an example, a melt pool along with its measured depth and width is shown in Figure 3a,b where a fish-scale feature is revealed in the longitudinal cross-section of the sample which has been observed before [7,32]. The wide columnar grains crossing multiple layers are due to the thermal gradient along the SLM building direction. The area fraction of the porosities measured all over the as-SLMed IN718 specimen after SLM was about 0.4% in the bottom (B) and about 0.28 % in the top (T) layers.
Due to the steep temperature gradient and high solidification rate during the SLM process, a supersaturated solid-solution matrix is expected to be formed with Laves phase precipitating in the sub-grain boundaries. In addition, a gradient of microstructure along the build direction, as well as from the dendrite cores to the interdendritic regions was observed. Similar observations were also reported by Kumara et al. during the solidification of electron beam melted IN718 alloy [20].
Figure 3. OM of as-Fabricated SLM-IN718 along the building direction (Z): (a) measured width and
depth of a melt pool; (b) wide columnar grains elongated in the building direction; (c) 3D-reconstruction of cross-sectioned & polished planes of a SLM specimen.
Figure 4 shows the variation of primary dendrite arm spacing (DAS), λ, along with the height of the as-printed specimen. The average DAS at the bottom (B) of the specimen is the lowest (0.789 ± 0.136 µm) and increased in the middle (M) (1.153 ± 0.132 µm) and then decreased again at the top (T) (0.820 ± 0.130 µm). The parallel white lines in each image are the remaining interdendritic Laves phase (Ni2Nb) that rapidly solidified after AM processing. Their volume fraction increased from 13.2% (B) to 15.46% (M) and then decreased to 14.6 % in the top region (T). These variations could be explained by the equivalent time-temperature histories that are generated by the changes of the thermal gradients and the difference in cooling rate throughout the sample during the SLM fabrication process. In fact, the higher cooling rate at the bottom and top of the sample results in a finer dendritic (smaller DAS) structure, leaving less time for elemental diffusion from the interdendritic zones to the core of dendrites. The high cooling rate normally results in the suppression (or at least reduction) of the segregation of elements [33] and the formation of Laves phase in the interdendritic solidifying regions [33]. As a result, in the bottom and the top (where the samples for thermal analysis were extracted) of the sample where DAS is smaller, the Nb concentration
homogenizes faster and therefore the Laves (Ni2Nb) fraction decreased. This finding is further
confirmed by examining Figure 5, where it can be seen that the volume fraction of the Laves phase increased from the bottom to the middle of the sample (Figure5).
Figure 4. Variation of DAS and Laves fraction along the as-SLM IN718 specimen height. The BM to
MT area is the middle region between the bottom (B) and the top (T) of the examined samples.
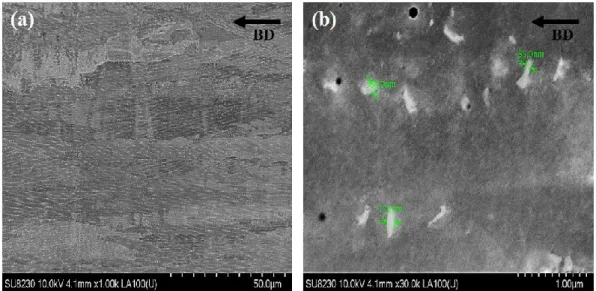
Figure 6 shows the microstructure of the as-SLM sample in the top (T) region. The microstructure in the bottom region (B) was similar to the top region and is not shown here to avoid repetition. The γ″ and δ particles observed in this study are similar in shape and size (80 ± 34 nm), which have also been observed in the works [7,32,34–38]. These phases are mostly confined at the bottom and top of the SLM samples by precipitation at the interdendritic zones close to the Laves. Jia et al. [7] reported that, during the solidification of the upper layers, the previously solidified layers experience an aging
heat treatment resulting in the precipitation of γ′ and γ″ (Ni3Nb) phases. Therefore, more γ′ and γ″
(less likely δ particles [32]) precipitate in the B region of the as-fabricated parts. Hence, the concentration of Laves in the B region is expected to be less than in the M or T regions. These microstructural differences could induce differences in hardness between the zones, as will be shown below.
Figure 6. FE-SEM micrographs from the microstructure of the as-SLM IN718 sample. (a) Dendritic
structure and (b) particles at the interdendritic regions.
Figure 7 shows micro-hardness evolution from the bottom to the top of the as-SLM IN718 sample. The average hardness value decreases from ~290 HV in B region to about 270 HV in M region and increases again to reach ~287 HV in the T region. These considerable variations of the hardness throughout the height of the sample could be induced by the thermal gradient in the Z-direction (vertical) and the presence of different microstructural features such as precipitates, DAS, and changes in Laves volume fraction. Indeed, as discussed in the previous section and shown in Figure
7, a more rapid heat extraction provokes as higher temperature drop rate (105–106 °C/s) and therefore
smaller DAS as well as finer precipitation of strengthening phases, γ′, γ”, and δ in B and T regions, which contributes to the higher hardness in these regions. In contrast, for the middle layers, the cooling rate being slower, the material remained longer time at elevated temperatures (>900 °C) which is high enough to dissolve, fully or partially, the strengthening phases formed during the printing process, and ultimately reduces its hardness. The above findings are also in agreement with those reported by Chen et al. [39], Moussaoui et al. [40], and Bayerlein et al. [41] who observed similar DAS values and precipitation of the strengthening phases in the regions with the highest thermal gradients.
Figure 7. Variation of the micro-hardness measured from bottom to the top of as-SLM sample.
3.2. Low Heating Rate Tests
The DTA results are shown in Figure 8 where the precipitation and dissolution temperatures of phases are extrapolated according to the exothermic and endothermic peaks, respectively. The corresponding determined temperatures are also provided in Table 3. The results show that the first peak temperature is around 540 °C for the sample heated with the rate of 10 °C/min. Niang et al. [27] in their work on kinetics of precipitation in wrought IN718, reported that this peak corresponds to γ’ precipitation (p). The other peaks correspond to the dissolution (d) of γ’, transformation of γ″ to δ, and finally dissolution of the δ phase. It must be noted that the very small size of the γ’ particles, suggests that they are most probably of tertiary type, as also reported in [42]. The results also show that, increasing the heating rate from 10 to 100 °C/min, both the dissolution and precipitation reactions shift to higher temperatures. For example, the dissolution temperature of the γ’ particles increased by 112 °C, and those of γ”, and δ phases increased by 72 °C, and 73 °C, respectively. In this study, the focus was before liquation and melting because the melting temperature is principally independent of the heating rate.
Figure 8. DTA records obtained on the as-SLM IN718 upon heating at scanning rates of 10, 15, 25, 50,
80, and 100 °C/min up to 1200 °C. The subscripts “d” and “p” represent the dissolution and precipitation temperatures of the corresponding phase.
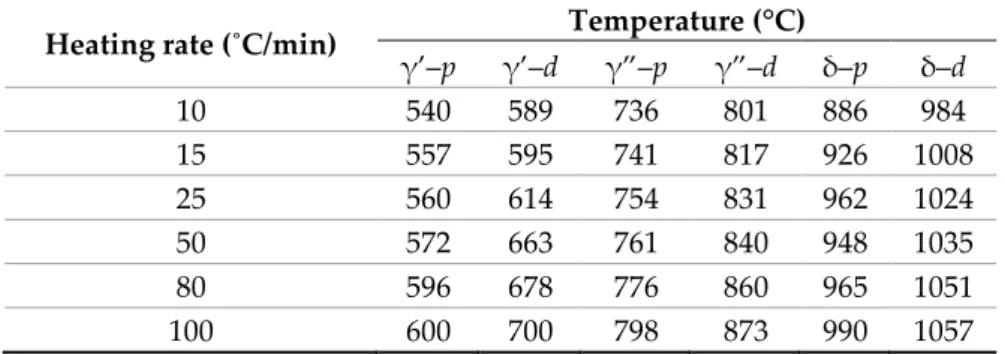
Table 3. Variation of precipitation (p) and dissolution (d) temperatures of γ’, γ”, and δ phases in the
SLM-IN718, for different heating rates.
Heating rate (˚C/min) Temperature (°C)
γ’–p γ’–d γ”–p γ”–d δ–p δ–d 10 540 589 736 801 886 984 15 557 595 741 817 926 1008 25 560 614 754 831 962 1024 50 572 663 761 840 948 1035 80 596 678 776 860 965 1051 100 600 700 798 873 990 1057
It has been reported [43–45] that changes in the heating rate modified the microstructure and the distribution of elements in the matrix resulting in changes in the chemical reaction temperatures and hence the DTA results. The results, reported in Table 3, quantify these changes for the examined samples in the present study and show that indeed the precipitation temperatures of γ’, γ” and δ phases increased by increasing the heating rate because there was less time for elemental diffusion and chemical reactions for precipitation of each phase at higher rates.
Based on the obtained results, the dissolution rate for the three precipitating phases were determined and the results are reported in Figure 9. The dissolution rate of γ’ follows a parabolic
pattern, as shown in Figure 9a, and described by the following equation: T = 485.49 × Hr0.0778. The γ”
dissolution evolution is shown in Figure 9b where a parabolic (T = 742.61 × Hr0.0339) trend can also be
seen. This behavior can also be considered as two linear regimes ranging between 25 to 50 °C/min (S1) and 80 to 100 °C/min (S2). It must be noted that the γ” solvus temperature depends on the initial size of the precipitates; therefore, the greater the size of the precipitates, the larger the deviation will be. Soucail et al. [46,47] observed similar behavior for the dissolution rate of secondary γ’ in Astroloy during heating. In particular, they found that the departure from equilibrium dissolution temperature was lower for smaller secondary γ’ precipitates but increased with the heating rate in
the interval 1–300 °C/s. As shown in Figure 9c, the δ phase dissolution temperature presents a non-linear dependence to the heating rate (T = 928.51 × Hr0.0284).
It is also important to note that, the above relations indicate that γ” and δ particles could still be present up to 1000 °C under high heating rates (e.g., 100 °C/s or more), while the much finer γ’ particles dissolve. As reported by several authors [32,48–50], γ” particles as metastable phase, start to decompose to the more stable δ phase at temperatures around 750 °C. However, their SEM examinations revealed that γ” phase was still present at 900 °C, which is above the γ” solvus temperature. Furthermore, the dissolution temperature of the δ phase has been reported to be between 990 °C and 1020 °C [32,50]. However, this study shows that the initial dissolution temperature of δ increased from 984 to 1057 °C when the heating rate was increased from 10 to 100 °C/min, respectively.
S1
Figure 9. Variations of: (a) γ’, (b) γ”, and (c) δ phase dissolution temperature (T) with heating rate
(Hr) at the top section of the SLM IN718 sample.
3.3. High Heating Rate Tests
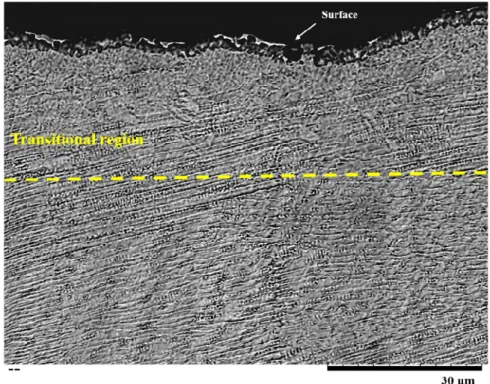
Microstructure examinations of the observed zones (identified in Figure 2) revealed a specific variation from the surface to the center, as indicated by the arrow in Figure 10. These features, located from just few micrometers below the surface until a depth of about 100 µm, called blocky zones, appeared along the dendrites from the surface toward the center. Only dendritic microstructure was observed below this zone (yellow line) down to the center of the sample. This change could be attributed to the transient thermal gradient from the surface to the center of the samples during rapid heating.
Figure 10. SEM image showing the microstructure near to the surface area of the sample heated to
1000 °C with 100 °C/s and dwell time 10 s followed by cooling at a constant rate of 65 °C/s.
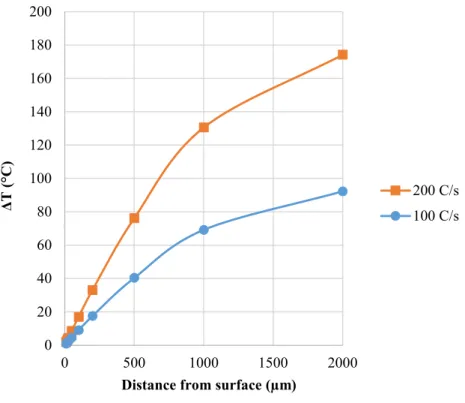
In order to assess whether the presence of a temperature gradient could be the cause for the observed features, a model proposed by Semiatin et al. [51] that predicts the radial temperature gradient developed in a round-bar sample was used. The analysis was based on a one-dimensional heat conduction equation for a round bar of infinite length and used direct local temperature measurements corroborated by microstructural observations, as in the present study. Using the above model and considering similar physical properties for IN718 and SLM IN718 (e.g., thermal conductivity, thermal convection, and emissivity [52]) the radial thermal gradient from the surface to center was estimated for heating rates of 100 °C/s and 200 °C/s and the results are reported in Figure 11. In this figure, (ΔT) represents the difference between the temperature applied to the sample surface (1000 °C, measured by the thermocouple) and the center of the sample during the heating cycle defined in the radial direction (based on the model proposed in reference [49]). It can be seen that ΔT is very small in the first 250 µm below the surface and starts to increase afterward, reaching its maximum value at the center. Therefore, the microstructural features observed in the near surface region of samples are most probably not related to a temperature gradient effect.
Figure 11. Estimated radial temperature gradients in 4-mm diameter SLM IN718 dilatometer samples
for two heating rate. Surface temperature is 1000 °C.
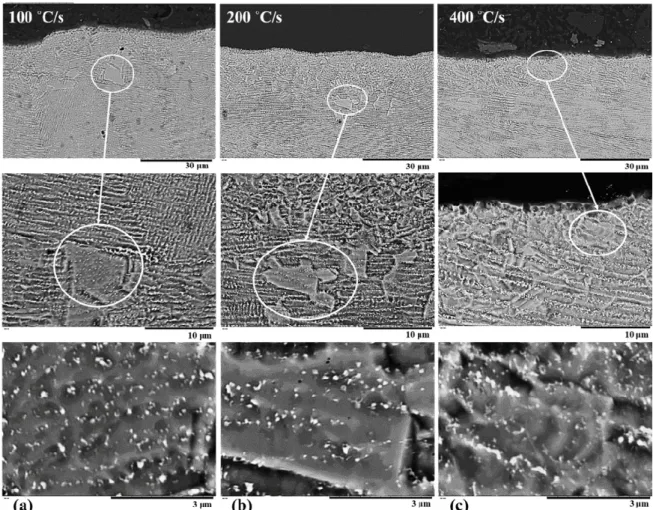
Figure 12a–c shows the microstructural features revealed along the longitudinal direction near the surface at mid-span of dilatometer SLM-IN718 samples (as indicated in Figure 2) exposed to heating rates of 100, 200, and 400 °C/s, respectively. The blocky zones are circled in the three micrographs and were observed in between the dendrites as well as very close to them. The Laves phase (white particles) were also observed at interdendritic regions close to these zones and even elongated into them.
0 20 40 60 80 100 120 140 160 180 200 0 500 1000 1500 2000 Δ T (° C)
Distance from surface (µm)
200 C/s 100 C/s
Figure 12. SEM images showing blocky zones in the sub-surface area at the mid-span of longitudinally
cut samples heated to 1000 °C at the rates of (a) 100, (b) 200, (c) 400 °C/s and 10 s holding time, and cooled by constant rate 65 °C/s.
These blocky zones contain different particles that were analyzed by EDS and the results are reported in Table 4. The map analysis, Figure 13, shows the presence of Nb and Mo-rich particles within these zones and at their boundaries for the all different heating rates. The Laves (white particles) were detected and had fine and granular shaped for 100 and 200 °C/s heating rates, while
they became irregular and long-striped shaped particles for the 400 °C/s.As reported by Sui et al.
[48], this change (Laves phases from long-striped to granular shapes) could be related to Laves phase dissolution process during heating. Indeed, the interdendritic Laves phases contain a certain amount of micro-segregated niobium that could dissolve and diffuse into the matrix or contribute to the formation of γ” precipitates (for longer time exposure). Furthermore, δ and γ” particles were observed alongside the Laves particles at higher magnifications in transitional zones, as reported in Figures 12 and 14. A comparison between the average size of γ” particles prior to the heating (80 ± 34 nm) and after heating (96 ± 30 nm) in the top of SLM samples reveals that the smaller γ” particles were dissolved for the heating rate of 100 °C/s.
Table 4. Chemical composition (wt.%) in sample heated at 100 °C/s.
Elements
Phases Ni Cr Fe Nb Mo Ti Al Matrix in blocky zone Bal. 16.56 16.21 4.98 2.89 1.28 0.31
Laves in interdendritic region Bal. 10.98 10.80 34.05 5.85 3.98 0.0
MC carbide Bal. 3.08 2.96 47.71 6.10 10.78 0.0
δ–precipitate Bal. 17.93 17.26 9.09 5.06 1.68 0.06
The formation and dissolution of precipitates such as γ”, Laves, and δ phases are directly related to the amount of the Nb in the microstructure [53,54]. The stress field induced by dislocations and vacancy inside the Laves phase act as driving forces for generating the migration of the dislocations and solute atoms (e.g., Nb and Mo) [55]. Moreover, the non-coherent interface between the Laves phase and γ-matrix enhances the concentration of vacancies, which facilitates the movement of solute atoms of constitutional elements to γ matrix thereby increasing the dissolution rate of the Laves phase. Nb and Mo are also the most severely segregated elements in the IN718 alloys, and thus it is relatively easy to measure their segregation [20]. An examination of the microstructure in the blocky zones revealed that the interdendritic Laves phase is dissolved in the γ-matrix. Similar findings were also reported by Raza et al. [9] and Owczarski et al. [10] in a fusion welded IN718 alloy by GTAW. It is interesting to note that partial or even full dissolution of the Laves phase has also been reported. However, such dissolution was not observed under the experimental conditions examined in the present study.
Based on the above analysis, it is expected that Nb and Mo, as the two main constituent elements, diffuse back into the matrix and stay in solid solution or could participate in the composition of δ and γ” due to the change the precipitation and the dissolution temperatures of these phases. However, despite the fact that it is intuitively evident that heating rate should influence the dissolution process through the diffusion distance (x), this needs to be quantified if microstructure evolutions are to be modeled. Soucail and Bienvenu [46] proposed an additive time-temperature incremental approach that takes into account the contributions from the dwell time and heating (and/or cooling) rates. Specifically, they used an “effective diffusion” time using the classical “equivalent time” (te) and
activation energy concepts.
The equivalent time te was estimated by the integration of an Arrhenius type diffusion law from
an initial time (ti) and initial temperature Ti to a final time (tf) and final temperature Tf:
= − 1− 1 (2)
In the above equation, R is the universal gas constant, Qe is the equivalent activation energy for
the diffusion process, and Th is the temperature at holding time (th). The influence of the heating rate
(Hr) is represented as: = − 1 − + − 1 (3) = ⎝ ⎜ ⎛ − 1 ( − ) + 1 − 1 ⎠ ⎟ ⎞ (4) Because: ( ) = and ≪ 1 (5)
Equation (4) simplifies into:
=
1
− ( − ) (6)A similar equation for the cooling cycle will be obtained by replacing Hr by Cr. Thus, the total
equivalent time including the heating stage, holding time and cooling would be obtained by summing the two te times for heating and cooling and the for the (th) for the holding time. In the
examined temperatures. Therefore, te for heating becomes ( ≈ ), and ( ≈ ) for cooling. The
equivalent holding time for the entire diffusion process becomes:
= 1 + 1 + (7)
On the basis of the above discussion, the diffusion distance (x) of Nb from the Laves phase in the interdendritic regions to the γ-matrix (core of the dendrites) is controlled by te which can be
determined using Fick’s second law, = .
In the above equations, the diffusion coefficient of Nb in Ni was calculated according to the following equation, obtained from the literature [30,52–55]:
( ⁄ ) = 1.04 × 10 exp (−201700⁄ ) (8)
where De is the diffusion coefficient of the considered element during the equivalent time. Using the
above equations, the diffusion distance (x) of Nb at 1000 °C was calculated. For example, this value was estimated to be in the interval 260 to 230 nm for heating rates from 100 to 400 °C/s and equivalent time (te) values ranging between 11.7 to 11.1 s, respectively. These values could justify the small
transitional areas (~one third of DAS or interdendritic zone) and localized dissolution of the Laves phase. It should be noted that the average DAS (λ) of all samples was about 0.832 µm ± 0.147, which was close to the DAS value measured within MT and T regions in the as-SLM specimens (as reported in Figure 4).
From Equations (7) and (8) as well as relation, = , a logarithmic relation (Equation (9))
between diffusion distance (x) and heat rate (Hr) can be established:
( ) = −0.006 × + 0.2827 (9)
The TTT diagram presented by Ning et al. [27] also confirms that even at rapid heating (1–10 °C/s) and at appropriate temperatures (>900 °C), γ” and δ phases can form and therefore delay the dissolution of existing second phase particles. These findings are in contrast with those of Roder et al. [26] who did not observe any delay in the dissolution of the γ” and δ phases in a wrought IN718 after the application of high heating rates, thus demonstrating the difference in the response of SLM material as compared to a wrought one.
Figure 13. Chemical EDS mapping of some principal elements of as-SLM IN718 sample heated to 1000
Figure 14. SEM images of the blocky zone show the presence of different precipitates such as
semi-spherical γ ״ and δ particles for sample heated to 1000 °C at a rate of 100 °C/s.
Table 5 shows the influence of the heating rate on microstructural features. For example, the thickness of the zone over which blocky zones were observed decreased from 12.08 ± 2.01 to 4.23 ± 1.01 µm when the heating rate increased from 100 to 400 °C/s, respectively. This trend was also observed in the average area fraction of the blocky zones with increasing heating rates. The data reported in Table 5 also shows that Nb concentration in Laves phase with spherical shape in the interdendritic region was significantly higher than in the blocky region. For instance, for the 100 °C/s heating rate, this concentration is around 34.05 wt.%, while it decreases to 15 ± 3.8 wt.% in white Laves particles within the blocky zones. The concentrations of Nb and Mo (wt.%) at the center of the dendrite core in the top section of the SLMed samples were measured to be 3.33 wt.% and 1.75 wt.%,
respectively. These amounts increased to 4.98 wt.% (Nb) and 2.89 wt
.
% (Mo) after heating at a rate of100 °C/s in the matrix of the transitional region (about 100 µm below the surface). However, for the heating rate of 400 °C/s, the intensity of these changes was reduced, so that the level of Nb and Mo in the matrix of the transitional region reached 4.51 and 2.46 (wt.%), respectively. Due to the increased heating rate, the time is much shorter for Nb diffusion from the Laves phase into the matrix or to γ” and δ phases. Hence, the measured average concentration of Nb in the Laves phase was higher for higher heating rates (15 ± 3.8% to 17 ± 3.9 wt.% for 100 and 400 °C/s, respectively). The changes in Nb concentration exhibited an inverse relationship to the variations in the Laves volume fractions. This probably indicates that the Nb trapped inside the Laves phase in the “solidified” microstructure was released and diffused back into the dendrite core as a consequence of the very fast heating and cooling [20]. Therefore, there was still enough time for elemental diffusion for high heating rates (i.e., 20 s for 100 °C/s), but its severity decreased for the higher rate of 400 °C/s (12.5 s).
Table 5. Microstructural characteristics of the SLMed IN718 for different heating rates.
Heating rate (°C/s) Thickness (μm) Area of blocky zones (μm2) Laves (wt.%) NbLaves (wt.%) Shape of Laves phase 100 12.08 ± 2.01 13.5 ± 10.24 5.45 ± 0.67 15 ± 3.8 Fine and granular 200 9.61 ± 1.97 6.65 ± 3.64 4.14 ± 0.28 14 ± 4.6 Fine and granular 400 4.23 ± 1.01 5.76 ± 4.49 3.25 ± 0.53 17 ± 3.9 Irregular and long-striped
3.4. Hardness Variations
Figure 15 shows the hardness distribution curves measured from the surface to the center of the dilatometer specimens for three heating rates (100, 200, and 400 °C/s) in the area considered to be the possible HAZ after the welding processes. The hardness was higher in the transitional region located near the surface (100 µm) affected by heating compared with the rest of the SLM part. The hardness decreased when moving out of the transitional region and became very close to the hardness value measured in the dashed line area in Figure 7 (before applying the heating). The higher hardness in the transitional region is probably due to the combination of three mechanisms: (1) the decomposition of Laves phase at the blocky zones; (2) the diffusion of Nb and Mo into the γ-matrix resulting in γ” and δ precipitations, and (3) the stability of the γ” and δ precipitates for temperatures up to 1000 °C.
Figure 15. Hardness distribution curves of the SLMed IN718, from the surface to the center of the
sample for different heating rates in area showed in Figure 7.
4. Conclusions
In this study, various heating rates were applied to additively manufactured IN718 samples. The evolution of the microstructure, hardness, and phase changes were analyzed and discussed before and after heating for different heating rates. The main findings are:
(1) A transitional zone characterized with the presence of blocky zones was identified in the subsurface region of the samples.
(2) It was demonstrated that the transitional zone was not due to a thermal gradient in the sample but to microstructural changes.
(3) The evolution of γ” and δ phases in the SLM samples is different when compared to wrought materials when submitted to high heating rates.
(4) The solubility of Nb is based on the diffusion rate of this element in different heating rates and
stability of all phases (Laves, δ, and γ
״
) which contained Nb. The diffusion rate and/or the solubilityof Nb in the γ phase increased at higher heating rates. The remaining Nb content in the interdendritic areas was determined to be insufficient for the Laves phase to form. The morphology of the Laves
phase changed from fine and granular for 100 °C/s to long-striped for 400 °C/s, demonstrating that less time was available for Nb dissolution of in the matrix and/or precipitation.
Author Contributions: Conceptualization, S.T. and M.J.; Data curation, S.T.; Formal analysis, S.T.; Funding
acquisition, M.J.; Investigation, S.T., F.R.-A. and M.J.; Methodology, S.T., F.R.-A. and M.J.; Project administration, M.J.; Resources, F.R.-A. and M.J.; Supervision, F.R.-A. and M.J.; Validation, M.J.; Writing–original draft, S.T.; Writing–review & editing, F.R.-A. and M.J. All authors have read and agreed to the published version of the manuscript.
Funding: This research was funded by the Natural Sciences and Engineering Research Council of Canada
(NSERC), 2018-083889 and “The APC was funded by Professor Mohammad Jahazi”.
Acknowledgments: The authors would like to thank the support of the Natural Sciences and Engineering
Research Council of Canada (NSERC) 2018-03889 through a Discovery Grant. The authors very much thank M. Adrien Lieurey (IMT-Mines Albi ICA - site Albi) for his involvement and fabrication of SLM parts. Technical support provided by Ameth Fall for experiments, and Radu Romanica for DTA testing is very much appreciated.
Conflicts of Interest: The authors declare no conflict of interest.
References
1. Petersen-Øverleir, E. Effect of 3D printing on the Microstructure and Mechanical Properties of an Inconel 718 Nickel-alloy. Master’s Thesis, University of Stavanger, Stavanger, Norway, 2015.
2. Deng, D.; Peng, R.L.; Brodin, H.; Moverare, J. Microstructure and mechanical properties of Inconel 718 produced by selective laser melting: Sample orientation dependence and effects of post heat treatments.
Mater. Sci. Eng. A 2018, 713, 294–306, doi:10.1016/j.msea.2017.12.043.
3. Li, C.; White, R.; Fang, X.Y.; Weaver, M.; Guo, Y.B. Microstructure evolution characteristics of Inconel 625 alloy from selective laser melting to heat treatment. Mater. Sci. Eng. A 2017, 705, 20–31, doi:10.1016/j.msea.2017.08.058.
4. Levy, G.N.; Schindel, R.; Kruth, J.P. Rapid manufacturing and rapid tooling with layer manufacturing (Lm) technologies, state of the art and future perspectives. CIRP Ann. 2003, 52, 589–609, doi:10.1016/s0007-8506(07)60206-6.
5. Kruth, J.P.; Leu, M.C.; Nakagawa, T. Progress in additive manufacturing and rapid prototyping. CIRP Ann.
1998, 47, 525–540, doi:10.1016/s0007-8506(07)63240-5.
6. Knapp, G.L.; Raghavan, N.; Plotkowski, A.; DebRoy, T. Experiments and simulations on solidification microstructure for Inconel 718 in powder bed fusion electron beam additive manufacturing. Addit. Manuf.
2019, 25, 511–521, doi:10.1016/j.addma.2018.12.001.
7. Jia, Q.; Gu, D. Selective laser melting additive manufacturing of Inconel 718 superalloy parts: Densification, microstructure and properties. J. Alloy. Compd. 2014, 585, 713–721, doi:10.1016/j.jallcom.2013.09.171. 8. Sufiiarov, V.S.; Borisov, E.V.; Polozov, I.A. Selective laser melting of the Inconel 718 nickel superalloy. Appl.
Mech. Mater. 2014, 698, 333–338, doi:10.4028/www.scientific.net/AMM.698.333.
9. Raza, T.; Hurtig, K.; Asala, G.; Andersson, J.; Svensson, L.E.; Ojo, O.A. Influence of heat treatments on heat affected zone cracking of gas tungsten arc welded additive manufactured alloy 718. Metals 2019, 9, doi:10.3390/met9080881.
10. Owczarski, W.A.; Duvall, D.S.; Sullivan, C.P. Model for heat-affected zone cracking in nickel-base superalloys. Weld J. 1966, 45, 145–155.
11. Raza, T.; Andersson, J.; Svensson, L.-E. Varestraint weldability testing of additive manufactured alloy 718.
Sci. Technol. Weld. Join. 2018, 23, 606–611, doi:10.1080/13621718.2018.1437338.
12. Manikandan, S.G.K.; Sivakumar, D.; Prasad Rao, K.; Kamaraj, M. Laves phase in alloy 718 fusion zone— Microscopic and calorimetric studies. Mater. Charact. 2015, 100, 192–206, doi:10.1016/j.matchar.2014.11.035. 13. Radhakrishnan, B.; Thompson, R.G. The effect of weld Heat-Affected zone (HAZ) liquation kinetics on the hot cracking susceptibility of alloy 718. Metall. Mater. Trans. A 1993, 24, 1409–1422, doi:10.1007/bf02668209. 14. Manikandan, S.G.K.; Sivakumar, D.; Kamaraj, M.; Rao, K.P. Laves phase control in Inconel 718 weldments.
Mater. Sci. Forum 2012, 710, 614–619, doi:10.4028/www.scientific.net/MSF.710.614.
15. Mary, C.; Jahazi, M. Linear friction welding of IN-718 process optimization and microstructure evolution.
16. Huang, Z.W.; Li, H.Y.; Preuss, M.; Karadge, M.; Bowen, P.; Bray, S.; Baxter, G. Inertia friction welding dissimilar nickel-based superalloys alloy 720Li to IN718. Metall. Mater. Trans. A 2007, 38, 1608–1620, doi:10.1007/s11661-007-9194-6.
17. Chamanfar, A.; Jahazi, M.; Cormier, J. A review on inertia and linear friction welding of Ni-based superalloys. Metall. Mater. Trans. A 2015, 46, 1639–1669, doi:10.1007/s11661-015-2752-4.
18. Sui, S.; Chen, J.; Ma, L.; Fan, W.; Tan, H.; Liu, F.; Lin, X. Microstructures and stress rupture properties of pulse laser repaired Inconel 718 superalloy after different heat treatments. J. Alloy. Compd. 2019, 770, 125– 135, doi:10.1016/j.jallcom.2018.08.063.
19. Chen, Y.; Lu, F.; Zhang, K.; Nie, P.; Elmi Hosseini, S.R.; Feng, K.; Li, Z. Dendritic microstructure and hot cracking of laser additive manufactured Inconel 718 under improved base cooling. J. Alloy. Compd. 2016,
670, 312–321, doi:10.1016/j.jallcom.2016.01.250.
20. Kumara, C.; Deng, D.; Hanning, F.; Raanes, M.; Moverare, J.; Nylén, P. Predicting the microstructural evolution of electron beam melting of alloy 718 with phase-field modeling. Metall. Mater. Trans. A 2019, 50, 2527–2537, doi:10.1007/s11661-019-05163-7.
21. Qian, M.; Lippold, J.C. The effect of annealing twin-generated special grain boundaries on HAZ liquation cracking of nickel-base superalloys. Acta Mater. 2003, 51, 3351–3361, doi:10.1016/s1359-6454(03)00090-9. 22. VishwakAarma, K.R.; Ojo, O.A.; Wanjara, P.; Chaturvedi, M.C. Microstructural analysis of linear
friction-welded 718 plus superalloy. J. Miner. Met. Mater. Soc. (TMS) 2014, 66, 2525–2534, doi:10.1007/s11837-014-0938-7.
23. Zhang, H.R.; Ojo, O.A. Non-equilibrium liquid phase dissolution of δ phase precipitates in a nickel-based superalloy. Philos. Mag. Lett. 2009, 89, 787–794, doi:10.1080/09500830903292346.
24. Tharappel, J.T.; Babu, J. Welding processes for Inconel 718- A brief review. IOP Conf. Ser. Mater. Sci. Eng.
2018, 330, doi:10.1088/1757-899x/330/1/012082.
25. Muralidharan, B.G.; Shankar, V.; Gill, T.P.S. Weldability of Inconel 718—A Review; 29018458; Indira Gandhi Centre for Atomic Research: Kalpakkam, India, 1996; p. 61.
26. Roder, O.; Helm, D.; Neft, S.; Albrecht, J.; Luetjering, G. Mixed Inconel Alloy 718 Inertia Welds for Rotating Applications: Microstructures and Mechanical Properties. In Proceedings of the Superalloys 718, 625, 706 and Various Derivatives, Pennsylvania, USA, 2005; pp. 649–658.
27. Niang, A.; Viguier, B.; Lacaze, J. Some features of anisothermal solid-state transformations in alloy 718.
Mater. Charact. 2010, 61, 525–534, doi:10.1016/j.matchar.2010.02.011.
28. Antonsson, T.; Fredriksson, H. The effect of cooling rate on the solidification of INCONEL 718. Metall.
Mater. Trans. B 2005, 36, 85–96, doi:10.1007/s11663-005-0009-0.
29. Knorovsky, G.A.; Cieslak, M.J.; Headley, T.J.; Romig, A.D.; Hammetter, W.F. INCONEL 718: A solidification diagram. Metall. Trans. A 1989, 20, 2149–2158, doi:10.1007/bf02650300.
30. Sohrabi, M.J.; Mirzadeh, H. Revisiting the diffusion of niobium in an as-cast nickel-based superalloy during annealing at elevated temperatures. Met. Mater. Int. 2019, doi:10.1007/s12540-019-00342-y.
31. Huang, W.; Yang, J.; Yang, H.; Jing, G.; Wang, Z.; Zeng, X. Heat treatment of Inconel 718 produced by selective laser melting: Microstructure and mechanical properties. Mater. Sci. Eng. A 2019, 750, 98–107, doi:10.1016/j.msea.2019.02.046.
32. Li, J.; Zhao, Z.; Bai, P.; Qu, H.; Liu, B.; Li, L.; Wu, L.; Guan, R.; Liu, H.; Guo, Z. Microstructural evolution and mechanical properties of IN718 alloy fabricated by selective laser melting following different heat treatments. J. Alloy. Compd. 2019, 772, 861–870, doi:10.1016/j.jallcom.2018.09.200.
33. Piec, M.; Dobrzański, L.A.; Labisz, K.; Jonda, E.; Klimpel, A. Laser alloying with WC ceramic powder in hot work tool steel using a high power diode laser (HPDL). Adv. Mater. Res. 2006, 15–17, 193–198, doi:10.4028/www.scientific.net/AMR.15-17.193.
34. Mostafa, A.; Picazo Rubio, I.; Brailovski, V.; Jahazi, M.; Medraj, M. Structure, texture and phases in 3D printed IN718 alloy subjected to homogenization and HIP treatments. Metals 2017, 7, doi:10.3390/met7060196.
35. Amato, K.N.; Gaytan, S.M.; Murr, L.E.; Martinez, E.; Shindo, P.W.; Hernandez, J.; Collins, S.; Medina, F. Microstructures and mechanical behavior of Inconel 718 fabricated by selective laser melting. Acta Mater.
2012, 60, 2229–2239, doi:10.1016/j.actamat.2011.12.032.
36. Tucho, W.M.; Cuvillier, P.; Sjolyst-Kverneland, A.; Hansen, V. Microstructure and hardness studies of Inconel 718 manufactured by selective laser melting before and after solution heat treatment. Mater. Sci.
37. Cao, G.H.; Sun, T.Y.; Wang, C.H.; Li, X.; Liu, M.; Zhang, Z.X.; Hu, P.F.; Russell, A.M.; Schneider, R.; Gerthsen, D.; et al. Investigations of γ′, γ″ and δ precipitates in heat-treated Inconel 718 alloy fabricated by selective laser melting. Mater. Charact. 2018, 136, 398–406, doi:10.1016/j.matchar.2018.01.006.
38. Cao, Y.; Bai, P.; Liu, F.; Hou, X. Investigation on the precipitates of IN718 alloy fabricated by selective laser melting. Metals 2019, 9, doi:10.3390/met9101128.
39. Chen, Y.; Guo, Y.; Xu, M.; Ma, C.; Zhang, Q.; Wang, L.; Yao, J.; Li, Z. Study on the element segregation and laves phase formation in the laser metal deposited IN718 superalloy by flat top laser and gaussian distribution laser. Mater. Sci. Eng. A 2019, 754, 339–347, doi:10.1016/j.msea.2019.03.096.
40. Moussaoui, K.; Rubio, W.; Mousseigne, M.; Sultan, T.; Rezai, F. Effects of selective laser melting additive manufacturing parameters of Inconel 718 on porosity, microstructure and mechanical properties. Mater.
Sci. Eng. A 2018, 735, 182–190, doi:10.1016/j.msea.2018.08.037.
41. Bayerlein, F.; Bodensteiner, F.; Zeller, C.; Hofmann, M.; Zaeh, M.F. Transient development of residual stresses in laser beam melting—A neutron diffraction study. Addit. Manuf. 2018, 24, 587–594, doi:10.1016/j.addma.2018.10.024.
42. Masoumi, F.; Shahriari, D.; Jahazi, M.; Cormier, J.; Devaux, A. Kinetics and mechanisms of gamma’ reprecipitation in a Ni-based superalloy. Sci. Rep. 2016, 6, 28650, doi:10.1038/srep28650.
43. Wang, X.-Y.; Wen, Z.-X.; Cheng, H.; Gu, S.-N.; Lu, G.-X. Influences of the heating and cooling rates on the dissolution and precipitation behavior of a nickel-based single-crystal superalloy. Metals 2019, 9, doi:10.3390/met9030360.
44. Wang, X.; Chou, K. Microstructure simulations of Inconel 718 during selective laser melting using a phase field model. Int. J. Adv. Manuf. Technol. 2018, 100, 2147–2162, doi:10.1007/s00170-018-2814-z.
45. Chrostek, T. The Influence of The Heating and Cooling Rates on The Temperature of The Phase Transformation; University of Warmia an Mazury in Olsztyn, Poland, 2016.
46. Soucail, M.; Bienvenu, Y. Dissolution of the γ′ phase in a nickel base superalloy at equilibrium and under rapid heating. Mater. Sci. Eng. A 1996, 220, 215–222, doi:10.1016/s0921-5093(97)80011-1.
47. Soucail, M.; Moal, A.; Naze, L.; Massoni, E.; Levaillant, C.; Bienvenu, Y. Microstructural study and numerical-simulation of inertia friction welding of astroloy. Superalloys 1992, 1992, 847–856.
48. Sui, S.; Tan, H.; Chen, J.; Zhong, C.; Li, Z.; Fan, W.; Gasser, A.; Huang, W. The influence of Laves phases on the room temperature tensile properties of Inconel 718 fabricated by powder feeding laser additive manufacturing. Acta Mater. 2019, 164, 413–427, doi:10.1016/j.actamat.2018.10.032.
49. Lalvani, H.M.; Brooks, J.W. Hot forging of IN718 with solution-treated and delta-containing initial microstructures. Metallogr. Microstruct. Anal. 2016, 5, 392–401, doi:10.1007/s13632-016-0299-4.
50. Beaubois, V.; Huez, J.; Coste, S.; Brucelle, O.; Lacaze, J. Short term precipitation kinetics of delta phase in strain free Inconel* 718 alloy. Mater. Sci. Technol. 2004, 20, 1019–1026, doi:10.1179/026708304225019830. 51. Semiatin, S.L.; Mahaffey, D.W.; Levkulich, N.C.; Senkov, O.N. The radial temperature gradient in the
Gleeble® hot-torsion test and its effect on the interpretation of plastic-flow behavior. Metall. Mater. Trans. A
2017, 48, 5357–5367, doi:10.1007/s11661-017-4296-2.
52. Keller, B.P.; Nelson, S.E.; Walton, K.L.; Ghosh, T.K.; Tompson, R.V.; Loyalka, S.K. Total hemispherical emissivity of Inconel 718. Nucl. Eng. Design 2015, 287, 11–18, doi:10.1016/j.nucengdes.2015.02.018.
53. Rafiei, M.; Mirzadeh, H.; Malekan, M.; Sohrabi, M.J. Homogenization kinetics of a typical nickel-based superalloy. J. Alloy. Compd. 2019, 793, 277–282, doi:10.1016/j.jallcom.2019.04.147.
54. Sohrabi, M.J.; Mirzadeh, H. Numerical and analytical solutions for determination of interdiffusion coefficients in superalloys during homogenization. Mater. Today Commun. 2019, 21,
doi:10.1016/j.mtcomm.2019.100631.
55. Sui, S.; Chen, J.; Li, Z.; Li, H.; Zhao, X.; Tan, H. Investigation of dissolution behavior of laves phase in inconel 718 fabricated by laser directed energy deposition. Addit. Manuf. 2020, 32, doi:10.1016/j.addma.2020.101055.
© 2020 by the authors. Licensee MDPI, Basel, Switzerland. This article is an open access article distributed under the terms and conditions of the Creative Commons Attribution (CC BY) license (http://creativecommons.org/licenses/by/4.0/).