HAL Id: hal-01609108
https://hal.archives-ouvertes.fr/hal-01609108
Submitted on 30 Mar 2018
HAL is a multi-disciplinary open access
archive for the deposit and dissemination of
sci-entific research documents, whether they are
pub-lished or not. The documents may come from
teaching and research institutions in France or
abroad, or from public or private research centers.
L’archive ouverte pluridisciplinaire HAL, est
destinée au dépôt et à la diffusion de documents
scientifiques de niveau recherche, publiés ou non,
émanant des établissements d’enseignement et de
recherche français ou étrangers, des laboratoires
publics ou privés.
Biomass char gasification by H2O, CO2 and their
mixture: Evolution of chemical, textural and structural
properties of the chars
Chamseddine Guizani, Mejdi Jeguirim, Roger Gadiou, Francisco Javier
Escudero Sanz, Sylvain Salvador
To cite this version:
Chamseddine Guizani, Mejdi Jeguirim, Roger Gadiou, Francisco Javier Escudero Sanz, Sylvain
Salvador.
Biomass char gasification by H2O, CO2 and their mixture:
Evolution of
chemi-cal, textural and structural properties of the chars.
Energy, Elsevier, 2016, 112, pp.133-145.
Biomass char gasification by H
2
O, CO
2
and their mixture: Evolution of
chemical, textural and structural properties of the chars
Chamseddine Guizani
a, Mejdi Jeguirim
b,*, Roger Gadiou
b,
Fransisco Javier Escudero Sanz
a, Sylvain Salvador
aaRAPSODEE, !Ecole des Mines d'Albi, Route de Teillet, 81013 Albi CT Cedex 09, France
bInstitut de Sciences des Mat!eriaux de Mulhouse e IS2M CNRS UMR7361, 15 rue Jean Starcky, 68057 Mulhouse, France
Keywords: Char gasification Char structure
Char surface functional groups Char texture
Mineral species behaviour
a b s t r a c t
The present study aims to understand the phenomenology of char gasification by monitoring the chemical, structural and textural char characteristics through the gasification reaction. Chars from beech wood were gasified under 20%H2O, 20%CO2and 20%H2O þ 20%CO2in N2at 900"C. The gasification
reactions were stopped at 20%, 50% and 70% of char conversion. The char properties were analysed by different analytical techniques such as temperature programmed desorption coupled to mass spec-trometry, Raman spectroscopy, Scanning Electron Microscopy, N2manometry and X-ray Fluorescence.
These analyses provide valuable information on the unfolding of the gasification reactions with H2O, CO2
and their mixtures. In particular, it is noted that H2O and CO2gasification reactions follow different
pathways. Moreover, during mixed atmosphere, despite that the char reactivity can be fairly expressed by summing the two individual reactivities, this apparent additivity appears to be the result of several competitions and synergies between H2O and CO2reactions.
1. Introduction
Fossil fuel depletion, climate change as well as environmental and human health problems are urging humanity to reconsider its relationship toward natural resources, change its energy policy and adopt a more sober way of living. Biomass as a renewable energies is undoubtedly part of the solution, at least to cope with fossil fuel depletion and mitigate the CO2 emissions in the atmosphere[1].
The thermochemical conversion routes for biomass conversion include combustion for thermal energy generation, pyrolysis for the production of bio-oil and bio-char, liquefaction (mainly for wet biomasses) and gasification for the production of Syngas.
Several biomass resources can be used in gasification reactors, such as woody biomasses or municipal solid wastes, which can be attractive for wastes reduction and valorisation [2] [3]. Biomass gasification allows to convert biomass into Syngas mainly composed of CO and H2[4]. These two molecules can be used
af-terwards as starting blocks for bio-fuel synthesis in processes such as Fischer-Tropsch catalytic synthesis[5]. Biomass gasification is a
generic term encompassing several reactions occurring during the biomass conversion. The biomass gasification includes the biomass drying, pyrolysis and residual char gasification steps. The char gasification is the rate limiting step in biomass gasification reactors. Biomass char is a porous, carbonaceous, non-organised material. It contains mainly carbon and in lower proportions, oxygen, hydrogen, nitrogen and mineral species such as potassium, calcium, sodium, silicon and magnesium. In biomass gasifiers, the char gasification reaction may take place with O2, H2O, CO2, and H2
following the reaction of combustion, steam gasification, Bou-douard reaction and methanation. The gasification reaction is a heterogeneous reaction involving the reactant gas diffusion inside the char, reaction on the char active sites and diffusion of the gas product out of the particle. The reaction can be also catalysed in the presence of minerals such as potassium[6].
Hence, the char porosity, its structural features, the nature of the surface functional groups as well as the presence of catalytic min-erals affect its reactivity toward the reactant gas(es). These different char properties affecting the reactivity can be classified in three categories:
# The char textural properties related to the char porosity and pore size distribution
*Corresponding author.
# The char structural properties related to the char carboneaceous structure and graphitization (ordering)
# The char chemical properties related to the surface functional groups as well as tp the catalytic mineral species
Several studies showed that the char morphology and texture impact the gas diffusion inside the particle. For instance, Avila et al. found correaltions between the reactivity and morphology of 10 biomass chars[7]. They observed that biomasses giving the thickest walled char had the lowest reactivities, while those having the thinnest walled char had the highest reactivities. The authors related their observations to the different resistances to mass and heat transfer in the two char types. Several studies showed that the initial porosity and Total Surface Area (TSA) of chars depend significantly on the pyrolysis conditions (temperature pressure and
heating rate) [8]. Indeed, Mermoud et al. observed that high
heating rate chars, exhibiting a higher reactivity, have a higher pore volume consisting mainly of mesopores and macropores, while low heating rate chars exhibit a lower pore volume mainly consisting of micropores [8]. Nevertheless, attempts to correlate the initial reactivity (e.g. at a conversion ratio of 5%) of the different chars with their respective TSA were unsuccessful. The authors found that the mesopore and macropore areas are better indicators of the char reactivity.
The textural properties of chars are also strongly modified during the gasification, a noticible increase of porosity and surface area can be observed during the gasification reactions[9] [10] [11]. Reactivity of biomass char can increase up to 10 folds at the end of the reaction compared to the initial stages[12] [6]. This reactivity increase can not be related exclusively to the increase of the TSA, as evidenced by Fu et al.[13]. The authors investigated the evolution of textural and chemical features of a rice husk char during steam gasification and found that the highest TSA was obtained for a conversion of 49%. TSA decreased beyond this conversion level, probably because of pore coalescence and collapsing, but reactivity did not. Similarly, Laine et al.[14]observed that coal chars with nearly the same TSA, have different reactivity. The authors found that the Active Surface Area (ASA), determined by O2
chemisorp-tion on the char surface at 200e300"C[14,15], is more
represen-tative of the reactive surface. Laine et al. measured the evolution of the TSA and ASA of chars during combustion with oxygen and showed the high difference that exists between TSA and ASA[14]. The ASA was found to represent a small fraction of the TSA. Therefore, not all the char surface participates to the gasification reaction. The char Surface Functional Groups (SFG) constitute the reactive sites in the biomass char. A qualitative and quantitative analysis of the char SFG can be done by Temperature Programmed Desorption and gas analysis by Mass spectrometry (TPD-MS)
[16e19]. This technique consists of heating the char sample in a high vacuum at a low heating rate. The decomposition of the SFG leads to the emission of CO2, CO, H2O and H2in a major part. The
nature of the char SFG can be determined by analysing the gas emission profiles. Figueiredo et al.[16]or Zhuang et al.[18]used this technique to follow the evolution of coal char functional groups during oxidation with O2, while Klose and Wolki[19]measured the
evolution of the CO surface complexes for CO2and H2O gasification
reactions.
The char structure has also an impact on the char reactivity. Char structural ordering is promoted at high temperatures and long soaking time. The more ordered is the char structure, the lower is its reactivity as showed in Ref.[20]. In fact, Asadullah et al.[20]
found that the reactivity to oxygen of chars obtained from a mallee wood decreases with increasing the temperature from 700"C to 900"C. The increase of temperature was accompanied by
a loss of oxygen functional groups and an ordering of the char. The
high levels of oxygen content in biomass fuels foster cross-linking of the carbon chains and inhibits ordering of the char matrix[21]. The loss of oxygen and hydrogen by elimination of functional groups are clear indicators of subsequent coalescence, ordering and rearrangement of aromatic rings. Tay et al.[22]studied the struc-tural features of partially gasified char in different atmospheres containing H2O, CO2 and O2 gasifying agents using FT-Raman
spectroscopy. The authors found that the presence of H2O during
gasification at 800"C plays a decisive role in the evolution of char
structure, in particular by decreasing the relative ratio of the small to large aromatic ring structures in the char. Keown et al.[23]made similar observations and found that the structure of cane trash chars changes drastically after contact with steam. Li et al.[24]also studied the evolution of the char structure during gasification with CO2, H2O and their mixtures using FT-Raman spectroscopy. The
structural changes were different in CO2 and H2O atmospheres,
char obtained in mixed atmosphere had a structure close to that obtained in H2O atmosphere. The authors concluded that CO2and
H2O gasification reactions follow different pathways.
Another factor influencing the char reactivity is the type and concentration of minerals in the char. Some minerals highly impact the char reactivity as they can catalyse or inhibit the gasification reaction. For instance, K, Ca and Na were found to be catalytic species while Si and P were shown to inhibit the gasification re-action[12,25e30]. The mineral species can migrate during the re-action and form cluster or stay evenly dispersed throughout the char particle[31]. Henriksen et al.[25]showed that the presence of Si hinders the gas from penetrating into the char particle. Si was found to form clusters and block the pore access to the reacting gas. More recently, Dupont et al.[12] found that the char reactivity towards steam can be expressed as the product of kinetic term accounting for temperature and steam partial pressure depen-dence, and an empirical correlation bearing the concentration of K and Si. In the continuity of the their researchs on the correlation between certain mineral species concentration and the char reac-tivity, Hognon et al.[27]as well as Dupont et al.[6]also showed that the evolution of the char reactivity during gasification is related to the K/(Si þ P) ratio.
This brief litterature overview shows that the char reactivity is highly conditioned by the its textural, structural and chemical properties. These characteristics are also highly coupled which makes the task of understanding the gasification reaction mecha-nisms even more difficult. Several studies focus on the modeling of the char gasification reaction in order to determine the reaction kinetic parameters [32] [33]. Char gasification models are often semi-empirical ones, as they include a term accounting for the changes in the different char properties along the gasification[34], which reflect the ambiguity of this issue. The present work aim at obtaining new insights on this issue by using a deep characteriza-tion of the char surface chemistry, structural and textural proper-ties as well as mineral species behaviour during biomass gasification in CO2, H2O and CO2/H2O mixture.
2. Material and methods 2.1. Char preparation
The raw biomass samples are beech wood spheres with a diameter of 20 mm. Proximate and ultimate analysis of the raw wood are shown inTable 1. Low Heating-rate chars were prepared by pyrolysing the wood spheres under nitrogen in a batch reactor. The wood spheres were placed on a metallic plateau, spaced enough to avoid chemical and thermal interactions. The plateau was introduced in the furnace heated zone which was progressively heated from room temperature to 900"C at 5"C/min. The chars
were kept for 1 h at the final temperature, cooled under nitrogen and stored afterwards in a sealed recipient. The low heating rate ensure a good temperature uniformity in the wood particle and leads to a quite homogeneous wood-char, from the structural and chemical viewpoints[8,25,35]. With high heating rates there can be heterogeneity among the char layers from the surface to the par-ticle centre due to the temperature gradient and heat transfer limitations during the pyrolysis stage. After the pyrolysis reaction, the char particles shrink and get an ovoid form. The mean particle diameter, calculated as the average of the three particle dimensions was estimated at 13 mm.
Some of the char particles were afterwards ground with a mortar and a pillar. Char particle having size of 0.2 mm were retained for gasification experiments at 900" C. To ensure of the
chemical and structural homogeneity of the char particle, the char structure and chemical composition were analysed at three loca-tion: at the surface, at half the distance from the centre and at the centre. Disparities in the elemental composition and Raman signals from the core to the char surface were negligible and showed that the char sample is homogeneous[36].
2.2. Char gasification experiments
The Macro-Thermogravimetry experimental device is described in details in Ref.[37]. The apparatus consists of a 2 m long, 75 mm i.d. alumina reactor which is electrically heated, and a weighing system comprising an electronic scale having an accuracy of ±0.1 mg. A metallic stand holding a 1 m long, 2.4 mm external diameter hollow ceramic tube is placed on the electronic scale. The ceramic tube hold the 5 cm diameter platinum basket in which the biomass particles are placed. The gas flow rates are controlled by means of mass flow-meters/controllers. The gas flow inside the reactor is laminar and its average velocity is 0.20 m/s.
For gasification experiments, a wood-char mass of 130e150 mg is spread-out on the whole surface of the 50 mm diameter platinum basket in the form of a thin layer. The surface of the crucible is large enough to allow spreading this mass in the form of a thin layer. The char is directly exposed to the surrounding atmosphere as the platinum basket is simply a circular plane without any side wall. The crucible is introduced in the furnace under a nitrogen flow. The char is kept 5 min under nitrogen before starting the gasification. During this period, the char loses mass in the form of water vapour and light gases. This mass loss was estimated to be less than 6% of its initial mass. This duration is sufficient for the establishment of a thermal and mechanical equilibrium between the weighing sys-tem, the furnace and the surrounding gases. Once a constant mass is displayed on the electronic scale, the gasification medium is introduced and the reaction starts. The gasification reactions were performed at 900"C with 20% H2O, 20% CO2and 20% H2O þ 20%
CO2in nitrogen.
The char conversion level is given by:
XðtÞ¼mm0' mðtÞ
0' mash (1)
Where m0, m(t)and mashare the initial mass of char, the mass at a
time t and the mass of the residual ash, respectively. The char
reactivity was calculated over time following the relation:
RðtÞ¼ 1
1 ' XðtÞ(
dXðtÞ
dt (2)
To follow the evolution of the char properties during the gasi-fication reaction, partially gasified chars were prepared at 20%, 50% and 70% of conversion. Knowing the initial char mass that was introduced in the crucible, the gasification reaction was stopped after reaching the desired conversion level. The gasifying medium flow was directly switched to pure nitrogen and the platinum basket bearing the sample was quickly pulled out toward the reactor colder zone at a temperature near to 180"C. The reacted
char was kept in this zone during 4 min to cool before taking it out directly to the ambient atmosphere. Afterwards, the chars were preserved in sealed recipients under nitrogen to avoid chemical transformations of the surface functional groups in air.
In the following sections, the char sample name will be composed by the sequence: ’gasifying agent’-’level of conversion’. For instance, the ’CO2-X50’ char sample refers to the char sample
obtained after CO2gasification up to 50% of conversion. The pristine
char (X ¼ 0) is named Ref-char. 2.3. Char surface chemistry analysis
The char surface chemistry was investigated via the TPD-MS technique. The TPD-MS experimental bench comprises a quartz tubular reactor electrically heated in which is introduced a quartz crucible containing nearly 20 mg of char, a pumping system to create vacuum and a mass spectrometer for gas analysis. After introducing the char sample in the reactor, the reactor is sealed and outgassed down to 0.013 Pa of pressure by means of a turbo-molecular pump. The sample is afterwards heated up to 900"C at
constant rate of 5"C/min and kept at this final temperature during
1 h. During the analysis, the functional groups are removed from the char surface, which results -depending on the nature of the functional groups-in the emission of H2O, CO2, CO and H2[16,17].
The gases resulting from the SFG decomposition were continuously quantified by a mass spectrometer, which is calibrated for H2, CO,
CO2, H2O and N2. The total pressure of the gas released during the
heat treatment was also measured using a Bayard Alpert gauge. This allows performing a mass balance by comparing the sum of partials pressures obtained from the MS analysis with the pressure recorded by the Bayard Alpert gauge. The total amount of each gas released was computed by time integration of the TPD-MS curves. 2.4. Char structural properties
Raman spectroscopy was used to study the structure of the chars during gasification. This technique can provide information about an ’average structural composition’ of the chars and thus allows a comparison between the different char sample at the different conversion levels. Raman spectra of the chars were recorded with a BX40 LabRam, Jobin Yvon/Horiba spectrometer. Several char particles were sampled and deposited on a rectangular glass slide for the Raman analysis. Raman spectra were obtained by a backscattered configuration with an excitation laser at 635 nm. The Raman spectra were recorded at 6 locations of the char sample. Mean values as well as relative standard deviations were calculated for the different parameters, taking thus into account the hetero-geneity among the char sample. For disordered carbons, the Raman spectrum is thought to be the combination of several bands cor-responding to different carbonaceous structures. It is often considered as the results of five signals corresponding to five carbonaceous structures[38e42]:
Table 1
Proximate and ultimate analysis of the raw beech wood (% dry basis). Proximate analysis Ultimate analysis
VM Ash FC C H O N
# The G band at 1590 cm'1: stretching vibration mode with E2g symmetry in the aromatic layers of the graphite crystalline[39]. # The D1 band at 1350 cm'1: graphitic lattice vibration mode with A1g symmetry and in-plane imperfections such as defects and hetero-atoms.
# The D2 band at 1620 cm'1: lattice vibration similar to that of the G band. The D2 band results from graphene layers which are not directly sandwiched between two other graphene layers. Sheng
[40]reported that the D2 band is always present when the D1 band is present and that its intensity decreases with the increase of the degree of organization in the char.
# The D3 band at 1500 cm'1: Related to amorphous carbon
structures and appears as a very broad band. It is suggested to
originate from the amorphous sp2-bonded forms of carbon
(organic molecules, fragments or functional groups, in poorly organised materials).
# The D4 band at 1200 cm'1: appears only in very poorly organ-ised materials, such as soot and coal chars[39,40]. It is attributed to sp2- sp3mixed sites at the periphery of crystallites and to CeC and C]C stretching vibrations of polyene-like structures. The D3 and D4 bands are suggested to be the major reactive sites in the char and thus related to the char reactivity. The
deconvolu-tion procedure was performed with a MATLAB[43]program based
on the work of Haver et al.[44]. Spectrum fitting was performed following a least square minimization procedure between the raw signal and the calculated one. The Raman signal was deconvolved into 5 bands. Assuming a Gaussian shape for the different bands, their positions were fixed to the above mentioned values. The height and width of the different bands were determined in a way to best fit to the experimental signal.
2.5. Textural properties and surface morphology of the chars The textural properties of the chars were investigated with a Micromeritics ASAP 2020 instrument using N2adsorbate at 77 K.
Prior to the analysis, the char samples were out-gassed overnight in vacuum at 300"C. The Total Surface Area (TSA) was calculated from
the BET equation in the relative pressure range of 0.05e0.15 while the micropore volume Vmicrowas estimated by using the
a
smethod.The mesopore volume Vmeso was obtained by subtracting the
micropore volume from the total pore volume of N2adsorbed at a
relative pressure of 0.95. The pore size distribution was determined using the DFT model for carbon slit pores with a finite depth[45]. Scanning electron microscopy (Philips model FEI model Quanta 400 SEM) and energy dispersive X-ray spectrometry (EDX) were used to observe the morphology and the surface elemental analysis of the prepared chars, which allows determining the elemental mapping of the samples.
2.6. Concentrations and behaviours of minerals in the chars The concentrations of several minerals in the different chars was measured by X-ray fluorescence spectrophotometry using a PHI-LIPS PW2540 apparatus equipped with a rhodium target X-ray tube and a 4 kW generator. About 100 mg of char were ground and mixed with 200 mg of boric acid, and then pressed into a pellet under a 9 tons pressure for 45 min. The use of boric acid is required to pelletize the char powder since the char has a hydrophobic character and could not be densified without a binder. The acid boric signal is easily eliminated during the XRF analysis. The behaviour of some major mineral species during gasification was analysed using the elemental mapping obtained during the SEM-EDX analysis.
3. Results
3.1. Evolution of the char reactivity
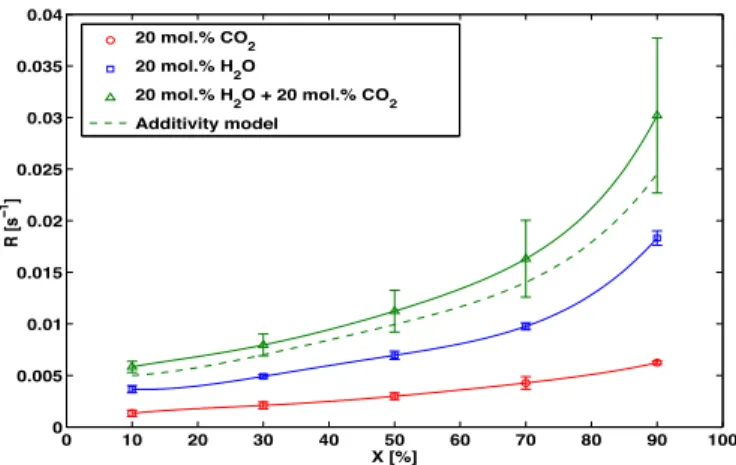
The char reactivity in 20% CO2, 20% H2O and their mixture at
900"C is shown inFig. 1. The char reactivity towards H2O is nearly
twice faster than its reactivity towards CO2. The char reactivity in
20% CO2þ 20% H2O atmosphere is higher than its reactivity in 20%
H2O atmosphere, denoting the non-inhibiting character of CO2
when it is co-reacting with steam in such operating conditions. The char reactivity in mixed atmospheres can be fairly described by adding the reactivities obtained in single atmospheres as shown by the dashed line curve inFig. 1. The experimental mixed atmosphere reactivity is slightly higher than the one obtained by the additive law. However, the approximation is reasonable as this latter is located in the standard deviation zone of the experimental results. Previous calculations for single atmosphere gasification exper-iments (20% CO2or 20% H2O in N2) showed that in these conditions
of temperature and char particle size, external as well as in-bed diffusional limitations can be considered as negligible. However, modelling results based on the Thiele modulus approach showed there are slight internal diffusional limitations in single atmo-spheres (effectiveness factor ¼ 0.92) which would be accentuated when mixing the two gases[36]. In the present cases, the char reactivity would be slightly affected by internal diffusional limita-tions, especially in the first stages of the reaction for which the porosity is not well developed.
3.2. Evolution of textural properties 3.2.1. Surface morphology
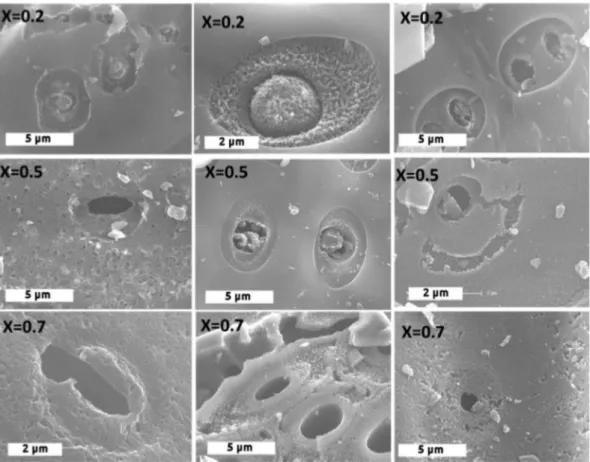
Despite its limited resolution at the micrometer level, SEM im-aging allows a direct visualisation of the char surface morphology during gasification. SEM images bear valuable information on the state of the char surface as well as on the development of macro-porosity. For the non-gasified char (Fig. 2), SEM images at the level of cells show a quite smooth surface with the presence of mineral particles evenly dispersed (proven by the EDX analysis).
Considering CO2gasification, we observed that the gasification
reaction affected almost all the surface in an equivalent way (Fig. 3). Alteration of the char surface is observed at the cell level as well as on its surroundings. The char surface shows clearly an higher porosity development along the gasification. The char gets a spongelike surface at an advanced gasification conversion.
In the case of H2O gasification, some differences in the char
surface morphology were noticed in comparison with CO2
gasification. At 20 and 50% of conversion, the char surface was altered at the level of cells and their near periphery while the rest of the surface was almost as intact and smooth as that of the non gasified char. It is only at X ¼ 0.7 that the char surface was seen to be highly affected by the gasification with H2O.
This difference between the char surface morphologies observed respectively in CO2 and in H2O gasification suggests a
limited diffusion for CO2molecules inside the char particle and an
accentuated surface reaction, while H2O, which has a better
diffu-sivity and a smaller molecular size, would get inside the char matrix and have a more developed volumetric reaction.
Information on micro and mesopores, which are unobservable using the SEM, are unavailable. Nevertheless, one can suspect a high microporosity at the cell surroundings in which H2O can
diffuse and reacts, while it would be inaccessible to the CO2
molecules which react mainly at the external surface causing its alteration.
The mix-char show a texture at X ¼ 0.2 similar to that obtained under H2O with a porosity mainly appearing around the cell region.
At X ¼ 0.5, we observed the alteration of the external surface probably due to CO2gasification. As for the two precedent char, at
X ¼ 0.7, the char surface was quite well damaged with a marked spongy-like morphology.
3.2.2. Surface area and porosity
Fig. 4shows the N2adsorption isotherms (left) and pore size
distributions(right) of the ref-char, CO2-chars, H2O-chars and
Mix-chars along the conversion. The adsorption isotherms are pre-sented in log scale to show the low pressure data which correspond to the N2adsorption in micropores.
Fig. 2. SEM images of the pristine char.
The N2uptake increases with the extent of conversion for all
chars indicating the extension of porosity due to the gasification reaction. The isotherms are close to the type I for all the chars ob-tained in CO2and H2O, indicating that they are almost microporous
and that the TSA resides mainly in the micropores[46,47]. More-over, the conversion up to 20% leads to the increase of the adsorbed volume over the whole relative pressure range 10'7 10'1. This
corresponds to the development of all pore sizes between 0 and 2 nm. For X > 20%, the development of porosity proceeds mainly through the increase of the larger micropores (10'4<P/P
0<10'1)
while the ultra-micropores are only slightly modified. For an equivalent conversion level, the N2volume adsorbed in micropores
for H2O-chars is higher than for CO2-chars. This indicates that the
gasification with H2O is more volumetric than CO2 gasification
which confirms the SEM observations. H2O molecules would
diffuse much more easily inside the char matrix than CO2molecules
which react more on the surface. Furthermore, H2O-chars show the
presence of mesopores especially at 50% and 70% of conversion where the adsorption and desorption isotherm show hysteresis loops (P/P0¼0.421). Beyond 50% of conversion, an enlargement of
the porosity is noticed for H2O gasification.
For the three atmospheres, the TSA increases almost linearly with the conversion (Table 2). At equivalent conversion levels, the TSA of CO2-chars is always lower than that of the H2O-chars. At
X ¼ 70%, the TSA of the char is higher than 1000 m2/gregardless of
the atmosphere composition.
The PSD of all chars are shown in the left had-side of theFig. 4. It can be noticed that for X > 20%, there is a development of ultra-micropores (size below 8 Å) in the three atmospheres. The devel-opment of such a narrow microporosity with the extent of reaction in the three atmospheres demonstrates the presence of internal
Fig. 4. Right: N2adsorption isotherm of the CO2-chars, H2O-chars and Mix-chars along the conversion, and left: corresponding pore size distributions according to DFT model.
Table 2
TSA evolution along the conversion for the three gasification reactions. Conversion level (%) 0 20 50 70 TSA in H2O gasification (m2/g) 437 866 1225 1334
TSA in CO2gasification (m2/g) 437 669 842 1028
diffusional limitations during the gasification reactions even at higher conversion levels.
Beyond 20% of conversion, one can notice the development of 11 Å micropores in the case of H2O gasified chars, while one can
observe the formation of larger micropores and of small mesopores for the CO2gasified chars in the pore size range of 10e40 Å. Also, it
can be observed that large mesopores (76e220 Å) are developed in the case of H2O gasification, but not visible in the case of CO2
gasification.
Mix-chars are also highly microporous. The increase of the mi-cropores widths with conversion can also be noticed. The isotherms show also a hysteresis loop denoting the presence of mesopores which are due most probably to steam gasification. The Mix-chars exhibit a higher pore volume than the single atmosphere chars for equivalent conversion levels. This underlies that the gasification reaction occurs in a more volumetric way in mixed atmospheres than in single atmospheres. Similar observations were made by Roman et al.[48]during the physical activation of olive stone chars with CO2, H2O and their mixture. The authors found that the
porosity developed in steam gasification was higher than that ob-tained in CO2gasification. They also observed that simultaneous
use of CO2and H2O resulted in a high volumes of pores, suggesting
a synergistic effect when mixing the two gases.
A worthy fact is that the Mix-chars show a pore size distribution similar to that of the CO2chars (bimodal distribution), however the
pore volume is much more developed in mixed atmosphere gasi-fication. What is also curious in the PSD of Mix-chars is the absence of the 11 Å micropores developed in the case of steam gasification, and the development of larger micropores and small mesopores respectively in the wider ranges of 10e20 Å and 30 to 50 Å. It can be also observed that the larger mesopores are more developed in mixed atmosphere gasification.
Keeping in mind that this bimodal pore size distribution was observed for CO2gasification, a plausible explanation to these
ob-servations may be formulated: in mixed atmosphere gasification, H2O molecules would facilitate the CO2molecules diffusion to the
11 Å pores. CO2 molecules can then react on and induce their
widening. In a similar way, for the 10 to 20 Å and 30 to 50 Å pores, it would be an enhanced CO2 diffusivity inside this porosity in the
presence of H2O, which induce their much pronounced
develop-ment by CO2gasification.
Owing to these results, there can be a synergy between the two molecules for the access to the internal surface area of the char. On one hand, CO2and H2O can compete for the same active sites, which
tends to lower the reaction rate, while in the other hand, H2O can
facilitate the CO2diffusion to other active sites, which tends to
in-crease the reaction rate. These results indicate that the situation of mixed atmospheres is likely more complicated than the simple case of an additive law denoting the reaction on separate active sites. 3.3. Evolution of char structure
Raman spectra of the char samples were well represented by the five gaussian bands deconvolution procedure. An example is given inFig. 5. Over the 60 fitted spectra, the highest relative mean error obtained following this fitting procedure was 3%. The ratios be-tween some major band intensities were used to investigate the char structure evolution during the gasification with CO2, H2O and
mixture of the gases. The different peak intensity ratios are plotted inFig. 6.
For instance, when considering the ratio between the D3 band intensity and D1 band intensity ID3/ID1, one can observe that this
ratio is almost constant along the gasification reaction with CO2. On
the contrary, in a H2O containing atmosphere this ratio decreases
markedly denoting the preferential reaction of H2O with the D3
type carbonaceous structures (organic molecules, fragments of functional groups and amorphous sp2carbon forms), and/or the growth of small rings to bigger ones of D1 type due to H radicals generated by H2O gasification. These H radicals can penetrate into
the char matrix and induce the ring condensation. Both phenom-ena can induce the observed decrease in the ID3/ID1ratio.
The ratio ID3/IG is constant along the conversion for the CO2
gasification while it decreases in a H2O containing atmosphere.
Similar results are reported in the literature on the drastic change of the char structure upon contact with steam[23,24]. The Mix-char structure evolution is similar to that of H2O-char. This similarity
can be due to the preponderance of steam gasification reaction in the global carbon gasification process. ID1/IGincreases during the
CO2gasification denoting the reaction of CO2with G type carbons
and/or the condensation of small rings into bigger ones of D1 type. However, the trend was in the opposite way for the H2O
gasifica-tion, showing the different reaction pathways for the CO2and H2O
gasification reactions.
ID4/IGshows a decreasing trend for X<50% in the case of H2O
gasification, while it increased a bit at X¼70% compared to the value obtained for the raw char, in the case of CO2 gasification. At
equivalent conversion levels, ID4/IGwas at higher values in the case
of CO2gasification compared to H2O gasification. For the mix-char,
the trend was to a slight decrease and the values were located between those obtained in the single atmosphere cases. The D4 band is thought to represent sp2-sp3 sites at the periphery of
crystallites and/or CeC, C]C polyene-like structures. These
struc-tures seem more reactive in the presence of H2O than in the
presence of CO2.
ID2/IG evolution was similar for the three chars. This ratio
increased along the gasification denoting the increase of the pro-portion of graphene layers which are not sandwiched between two other ones.
Altogether, these data shows that CO2and H2O reactions would
follow different pathways. Also, the results obtained for Mix-chars indicate that steam greatly influence the char structure, which tends towards that of H2O chars. This would be related to the
predominance of the steam gasification reaction over the CO2
gasification reaction in the case of mixed atmosphere gasification. 3.4. Mineral species
3.4.1. Concentration and behaviour of minerals
The molar concentrations of the main minerals found in the
chars are shown inFig. 7. The mineral phase of the char after py-rolysis is mainly constituted by Alkali and Alkaline Earth Metals (AAEM) which represent near to 60 mol.% of the minerals. These species are, in order of decreasing concentration: K, Ca and Mg. The Ref-char contains also transition metals such as Zn, Mn and Fe and non-metals such as Si and P.
K, Ca, Mg and P concentrations globally increase along the gasification with CO2, while that of Al and Zn decrease since the
early stages of gasification. Besides, for Fe and Si, their concentra-tions is relatively constant along the reaction. An increasing con-centration along the reaction indicates a higher retention in the char while a constant one or a decreasing one indicates that the
specie is being rather volatilized. Similarly as for the CO2
gasifica-tion, the concentrations of AAEM as well as that of P increase during H2O gasification. One can observe that K, Ca and Mg retention is
higher in H2O atmosphere than in CO2atmosphere which would
impact the char reactivity due to the catalytic activity of these species. Zn concentration decreases drastically since the very beginning of the reaction as for CO2gasification. Al and Fe
con-centrations increase, which is different from the case of CO2
gasi-fication. One can also notice that Si is more retained in the char than in the case of CO2 gasification. Silicon would volatilize in the
presence of CO2while it remains in the char matrix in the case of
steam gasification. This is an important observation since Si is
Fig. 6. Peak intensity ratios evolution during the char gasification in CO2, H2O and their mixture.
known to be an inhibitor of gasification.
In mixed atmosphere gasification, one can observe a kind of ”intermediate results” lying between those obtained in single at-mospheres, denoting the action of H2O and CO2. Si and Al are less
retained when CO2 is injected with H2O. Also, Zn concentration
decreases less drastically in the presence of CO2along with steam.
SEM observations coupled to EDX analysis revealed interesting information about the behaviour of major minerals contained in the chars (data not shown). K and Mg were found to be present in a very diffuse state in the char matrix while Ca was found in the form of big clusters located at the char surface. Similarly, Si was found in the form of big clusters located at the entry of pores. The clusters were seen to contain a mixture of metals, and high concentrations of oxygen are present, indicating that the minerals are in the oxide or carbonate forms. These results are in accordance with the find-ings of[49]. Dispersion of minerals as well as their nature and concentration play a crucial role in the heterogeneous gasification reactions[28].
3.4.2. Relationship between minerals and char reactivity
The abundance of mineral species in the char is of high impor-tance as some of them (mainly AAEM species) play a well admitted catalytic role in H2O and CO2 gasification [12,27,50]. K, Ca, Mg
constitutes active sites on which gasification occurs via several steps including carbonation, de-carbonation and formation of metal oxides among others [28]. While catalytic active species concentrates into the char, the number of active sites increases consequently which may explain the increasing char reactivity along conversion. Other species inhibit the gasification reaction such as Si and P[6,12,27]. Recently, some authors found a correla-tion between the K/Si ratio and the char reactivity with CO2 at
conversion levels higher than 0.6[30]. The char reactivity would be thus correlated with some mineral species concentrations. We analysed the possible correlations and found that there were effectively ones for some minerals.
Fig. 8shows the evolution of the char reactivity with the con-centrations of K, Ca and Mg for the different gasification atmo-spheres. Near linear correlations were found between the char reactivity and the molar concentrations of these species for the different atmospheres.
Similar results were obtained by Ref.[51]. The authors gasified chars from 14 different biomass samples including sawdust, bark
and some agricultural wastes under 50 kPa steam at 850"C. The
authors found linear correlations between the reactivity at X¼0.5 and the sum of K, Na and Ca. They observed that the alkali metals are more effective than Ca. For biomasses with high Si content (rice husks and bagasse), the authors observed much lower reactivities. They assumed that the formation of alkali silicates at low temper-atures curtailed the catalytic action of K.
Mermoud et al.[8]found also linear correlation between the initial gasification rate of beech wood char and its ash content. In a more recent study, Hognon et al.[27]reported two typical behav-iour of biomass char, those which reactivity decrease along the conversion having a K/Si ratio below one, and those having a K/Si ratio above one exhibiting a constant reactivity or slight decrease followed by reactivity increase beyond 70% of conversion. Si is an inhibitor of the gasification and thought to encapsulate catalytic active species such as K reducing consequently its activity.
The present results show quite interesting potential synergy between CO2and H2O during gasification as the presence of CO2
would induce the departure of Si from the char which is an in-hibitor in steam gasification.
3.5. Evolution of surface chemistry during gasification
TPD-MS experiments provide interesting information on the surface chemistry of the chars (Fig. 9). The pristine char exhibits a surface chemistry which is typical of an hydrophobic material ob-tained by pyrolysis of a carbon precursor. The low stability surface groups are mainly carboxyles, which lead to the desorption of CO2
at low temperature (150e300"C). These functional groups are in
relatively low quantities. The main surface chemistry is composed of ether and semi-quinones which decompose to CO at high tem-perature[16,17]. This low CO2/CO ratio is often observed e.g. for
activated carbons[52]. The emission of water during the TPD-MS experiments is low. At moderate temperatures (below 500"C), it
would related to dehydration reactions between surface groups which form lactones and anhydrides. At a higher temperature, H2O
can be emitted by the dehydration of a phenol and a carboxylic acid, leading to the formation of lactones. It can also result from the dehydration of two phenol groups forming thus an ether[16,17]. The decomposition of these groups explains in a part the emission of CO and CO2between 300 and 600" C. H2emission begins at
750"C, it is due mainly to thermal decomposition of CeH bonds.
In the temperature range of 150e350"C corresponding to
car-boxyles decomposition, an increase of CO2emission is observed for
CO2-chars while a decrease is observed for H2O-chars. At higher
temperature, corresponding to anhydrides and lactones decom-position[16,17,49,53], the CO2emission rate increased regardless of
the reacting gas composition. This results denotes an increase of acidic functions on the char surface. The increase of the intensity of this peak can be explained by the conversion of some carboxylic groups to anhydrides and lactones[53].
For the different CO2chars, the CO signal is nearly the same in
the temperature range of 20e600"C. The variation with the
con-version level are noticed beyond 600"C where the peak intensity
increases with the conversion level. For all the char samples, the CO signal exhibits a single peak with a maximum at 900"C, its
in-tensity increases with the conversion level.
It is worth-noting that the CO signal for the CO2chars fits well
with that of the Ref-char in the temperature range of 20e600"C,
while less CO is emitted between 200"C and 600"C for the H2
O-chars and Mix-O-chars. The functional groups emitting CO at mod-erate temperatures are thought to be ethers, anhydrides and
phenols, while at high temperatures, quinones decomposition would be responsible of the CO emissions[17]. Thus, anhydrides and phenols may have reacted in the early stages of gasification (X < 20%) in the presence of steam, explaining the observed dif-ferences concerning the CO signal. This observation can be corre-lated with the decrease of ID3/ID1and ID4/ID1ratios for chars gasified
in the presence of steam. The D3 and D4 bands results, at least in a part, from anhydrides, ethers and phenols.
H2peak intensity decreased with the conversion for the CO2
chars. Even the starting of the peak was at higher temperatures for the CO2-X50-char and CO2-X70-char. However, for the H2O-chars
and Mix-chars, the H2 signal increases with the conversion. The
starting of the peak was at lower temperatures (680e700"C) than
for the CO2-chars. The hydrogen on the chars gasified in presence of
steam is likely less severally bonded on the surface than in the case of CO2gasification. Also, the peak intensity was greater for H2
O-chars and Mix-O-chars than for the CO2-chars. A clear difference is
thus noticed on the H2emissions when CO2is the gasifying
me-dium. It is likely that CO2 reacts on H sites and reduces
conse-quently the H concentration in the char while the increasing
quantity of H2emitted from H2O-chars and mix-chars is related to
the continuous hydrogenation of the char surface by the steam gasification reaction.
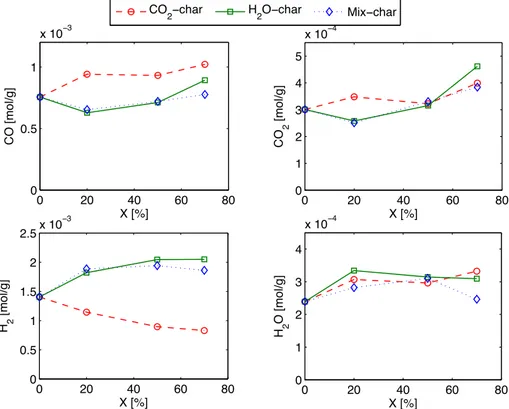
Fig. 10shows the evolution of the total emitted amount of H2O,
CO2, CO and H2 from the different char samples. H2O emitted
quantity increased a bit for the three chars at 20% of conversion and remained almost constant along the conversion except for the Mix-char where it decreased beyond 50% of conversion. The H2O-char
and Mix-char show a decrease in the emitted CO2quantities at 20%
of conversion compared to the Ref-char. This can be related to the preferential reaction of H2O with phenols, ethers and anhydride
functional groups in the first stages of the reaction contributing in the CO2emission from the char surface as explained above.
Afterwards, the CO2 quantity increased steadily with
conver-sion. CO2and H2O were the minor desorbed species while H2and
CO emissions were greater by almost 1 order of magnitude. The H2
emissions decreased with the conversion for the CO2-char, from
1.4
m
mol/g for the Ref-char to 0.83m
mol/g at 70% of conversion. On the contrary, it increased for the H2O-char and Mix-char along theconversion up to 1.9
m
mol/g at 70% of conversion. The CO emitted quantity was always higher for the CO2-char than in the 2 otherchars. It increased a bit from 0.8
m
mol/g to nearly 1m
mol/g at 20% of conversion and remained almost constant afterwards. On the contrary, it decreased from 0.8m
mol/g to 0.6m
mol/g for the H2O-char and Mix-O-char at 20% of conversion and then showed an in-crease trend up to 70% of conversion. These two trends concerning H2and CO constitute the main difference between the H2O and CO2
gasification reactions.
What can be noticed when having a global view on the different trends is that the gas evolution for the Mix-char followed always that of the H2O-char. In mixed atmosphere gasification, if we
consider that H2O and CO2react independently, near to 70% of the
char is converted by the steam gasification reaction as this latter is twice as fast as the Boudouard reaction. This may explain the fact that the mix-char TPD profiles look like that of the H2O-char. The
fact that the H2O-chars and Mix-chars contained more H may be
explained by the steam gasification reaction. Water dissociation over the char surface is at the origin of the continuous hydroge-nation of the surface[54]:
2CðÞ þ H2O/CðHÞ þ CðOHÞ (3)
CðOHÞ þ CðÞ/CðHÞ þ CðOÞ (4)
These reactions explain the formation of semi-quinones which decomposes to CO at high temperature. The emission of H2during
TPD-MS analysis is then due to the dehydrogenation of two neighbouring C(H) or C(OH) sites following the possible reactions of:
CðHÞ þ CðHÞ/2CðÞ þ H2 (5)
CðOHÞ þ CðHÞ/CðOÞ þ CðÞ þ H2 (6)
CðOHÞ þ CðOHÞ/2CðOÞ þ H2 (7)
The decrease of in the H2quantities in the CO2-chars has likely
to do with the absence of hydrogenation reaction and/or reaction of CO2on the H sites. The fact that the CO2-chars contain more CO
emitting groups may be explained by the Boudouard reaction which is constantly providing CO intermediate species on the char surface:
CðÞ þ CO2/CðOÞ þ CO (8)
CðÞ þ CO2/CðOÞ þ CðCOÞ (9)
In H2O gasification, intermediate surface groups are more
various: C(O), C(CO), C(H) and C(OH). This is why the CO emissions are greater for the CO2-chars than the H2O-chars at equivalent
conversion levels. The same reasoning can be held for the H2
emissions. 4. Conclusions
The present work aimed at shedding light on the unfolding of the char gasification reaction under H2O, CO2and their mixtures,
leaning on a deep characterization of partially gasified chars ob-tained respectively at 0%, 20%, 50% and 70% of conversion. The char structure, texture, surface chemistry as well as the mineral contents were investigated along the three gasification reactions.
The results showed that H2O and CO2gasification reactions have
likely different pathways. The principal characteristics and marked differences between CO2and H2O gasification reactions are
sum-marized inTable 3:
The Raman spectra of the H2O-chars show that H2O reacts
preferentially with D3 carbon form and probably induces ring condensation due to the presence of mobile H on the char surface. CO2 do not show a clear selective reactivity towards a specific
carbon form.
The char surface chemistry is different for the two reactions as CO2chars contains more emitting CO surface functions, while H2O
gasified chars are much more hydrogenated. H2O appears to react
preferably with ethers, phenols and anhydrides in the first stages of the reaction (X < 20%). This observation can be correlated with the marked decrease of the ID3/ID1ratio observed in the Raman spectra
of 20%-H2O char compared to the Ref-char. Ethers, phenols and
anhydrides are thought to contribute effectively to the D3 band intensity. Moreover, the marked increase of surface H atoms in the char, due to steam gasification, can be correlated to the decrease of the ID3/ID1ratio, as mobile H can induce ring condensation and thus
increase the proportion of D1 carbon forms.
The textural properties of CO2and H2O chars also differ. In deed,
H2O gasification leads to a higher internal char porosity than CO2at
equivalent conversion levels, due to a more volumetric gasification reaction. H2O gasification develops preferentially 1 nm micropores
and creates mesoporosity along the conversion. The CO2
gasifica-tion develops mainly micropores in the range of 10e20 Å with a larger bimodal pore distribution. The SEM observations as well as porosity measurements revealed that CO2gasification affects more
the char surface than the particle core, which is probably related to a lower diffusivity of CO2 compared to H2O. Internal diffusional
limitations are observed for the different atmospheres as very small micropores of 5e6 Å continue to be developed along the gasifica-tion reacgasifica-tion regardless of the atmosphere composigasifica-tion.
In mixed atmosphere gasification, the char SFG and Raman pa-rameters are similar to those observed in the H2O-chars. This has
likely to do with a higher carbon removal via steam gasification. The CO2contribution to the gasification reaction is not negligible.
The CO2TPD profile of Mix-chars appears as a blend of the CO2TPD
profiles obtained for the single atmosphere chars, denoting the
contribution of both reactions. In addition, it was found that the micropore size distributions of Mix-chars tend towards those of CO2chars exhibiting a bimodal distribution. The microporosity and
small mesoporosity in the range of 20e50 Å is better developed in mixed atmosphere gasification than in single atmospheres.
As the bimodal pore size distribution was observed only for CO2
and mixed atmosphere gasification, it is plausible that H2O
mole-cules facilitate the CO2molecules diffusion to the 11 Å pores. CO2
molecules can then react on and induce their widening. In a similar way, for the 10 to 20 Å and 30 to 50 Å pores, it would be an enhanced CO2 diffusivity inside this porosity in the presence of
H2O, which induce their much pronounced development by CO2
gasification.
There may be consequently a competition between CO2and H2O
for the reaction on a part of the active surface, and simultaneously a synergy by an enhancement of the CO2internal diffusivity. Also,
CO2was seen to enhance the departure of Si from the char matrix
steam compared to the case of steam gasification. There may be also be synergistic effects in mixed atmosphere gasification due to the action of CO2on Si which is known to be an inhibitor of the
steam gasification reaction.
As a general conclusion, CO2 and H2O reactions would follow
different pathways. In mixed atmosphere gasification, these two molecules do not react independently since there are likely several competition and synergy interactions that lead to an apparent additive law of reactivity. Which can thought to be a separate active sites reactions mechanism, is rather a sum of a more complicated synergy and inhibition interactions. The additive law observed in the mixed atmosphere gasification would be only a fortuitous correct mathematical representation of the char reactivity in mixed atmospheres.
Acknowledgements
The authors want to thanks gratefully for their help: Joseph Dentzer for TPD-MS experiments, Habiba Nouali for textural anal-ysis, Laure Michelin and Ludovic Josien for SEM and X-Ray fluo-rescence analysis. The authors also acknowledge the French National Research Agency for its financial support in the RECO2
project. They also wish to express their appreciation to Bernard Auduc for his technical support.
References
[1]Bentsen Niclas Scott, Jack Michael W, Felby Claus, Thorsen Bo Jellesmark. Allocation of biomass resources for minimising energy system greenhouse gas emissions. Energy 2014;69:506e15.
[2]Kwak Tae Heon, Lee Seungmoon, Maken Sanjeev, Shin Ho Chul, Park Jin Won, Yoo Young Done. A study of gasification of municipal solid waste using a double inverse diffusion flame burner. Energy Fuels 2005;19(6):2268e72. [3]Kwak Tae Heon, Maken Sanjeev, Lee Seungmoon, Park Jin W, Min Byoung ryul,
Yoo Young Done. Environmental aspects of gasification of Korean municipal Table 3
Main differences between the gasification reactions in CO2and H2O.
H2O gasification CO2gasification
SFG Less ethers, anhydrides and phenols since the early gasification stages More CO emitting FG Differences in peak positions compared to CO2gasification Much less hydrogenated char
Structure Preferential removal of amorphous carbon forms Lower selectivity towards the carbon forms Texture Higher TSA at equivalent X and less damaged surface Lower TSA and more damaged char surface
Development of mesoporosity besides microporosity Higher proportion of micropores Small micropore size distribution Large micropore size distribution Preferential development of 1 nm micropores More laid micropores size Minerals Better retention of AAEM species Lower retention of AAEM species
solid waste in a pilot plant. Fuel 2006;85(14e15):2012e7.
[4] Kwak Tae-Heon, Lee Seungmoon, Park Jin-Won, Maken Sanjeev, Done Yoo Young, Lee Sang-Houck. Gasification of municipal solid waste in a pilot plant and its impact on environment. Korean J Chem Eng 2006;23:954e60. [5] Imorb Karittha, Simasatitkul Lida, Arpornwichanop Amornchai.
Techno-eco-nomic analysis of the biomass gasification and Fischer-Tropsch integrated process with off-gas recirculation. Energy 2016;94:483e96.
[6] Dupont Capucine, Jacob Sylvain, Ould Marrakchy Khalil, Hognon C!eline, Grateau Maguelone, Labalette Françoise, et al. How inorganic elements of biomass influence char steam gasification kinetics. Energy 2016;109:430e5. [7] Avila Claudio, Pang Cheng Heng, Wu Tao, Lester Ed. Morphology and reactivity
characteristics of char biomass particles. Bioresour Technol April 2011;102(8): 5237e43.
[8] Mermoud F, Salvador S, Vandesteene L, Golfier F. Influence of the pyrolysis heating rate on the steam gasification rate of large wood char particles. Fuel July 2006;85(10e11):1473e82.
[9] Senneca Osvalda. Kinetics of pyrolysis, combustion and gasification of three biomass fuels. Fuel Process Technol 2007;88(1):87e97.
[10] Gil María V, Riaza Juan, !Alvarez Lucía, Pevida Covadonga, Rubiera Fernando. Biomass devolatilization at high temperature under N2 and CO2: char morphology and reactivity. Energy 2015;91:655e62.
[11] Bai Yonghui, Wang Yulong, Zhu Shenghua, Li Fan, Xie Kechang. Structural features and gasification reactivity of coal chars formed in Ar and CO2 at-mospheres at elevated pressures. Energy 2014;74(C):464e70.
[12] Dupont Capucine, Nocquet Timoth!ee, Augusto Da Costa Jos!e, Verne-Tournon Christ"ele. Kinetic modelling of steam gasification of various woody biomass chars: influence of inorganic elements. Bioresour Technol October 2011;102(20):9743e8.
[13] Fu Peng, Hu Song, Xiang Jun, Yi Weiming, Bai Xueyuan, Sun Lushi, et al. Evolution of char structure during steam gasification of the chars produced from rapid pyrolysis of rice husk. Bioresour Technol June 2012;114:691e7. [14] Laine NR, Vastola FJ, Walker PL. The importance of active surface area in the
carbon-oxygen reaction. J Phys Chem 1963;67:2030e4.
[15] Causton Peter, Brian McEnaney. Determination of active surface areas of coal chars using a temperature-programmed desorption technique. Fuel 1985;64: 1447e51.
[16] Figueiredo JL, Pereira MFR, Freitas MMA, Orfao JJM. Modification of the surface chemistry of activated carbons. Fuel 1999;37:1379e89.
[17] Brender P, Gadiou R, Rietsch J-C, Fioux P, Dentzer J, Ponche A, et al. Charac-terization of carbon surface chemistry by combined temperature pro-grammed desorption with in situ x-ray photoelectron spectrometry and temperature programmed desorption with mass spectrometry analysis. Anal Chem 2012;84:2147e53.
[18] Zhuang Qianlin, Kyotani Takashi, Tomita Akira. Dynamics of surface oxygen complexes during carbon gasification with oxygen. Energy & Fuels 1995;9(4): 630e4.
[19] Klose W, Wolki M. On the intrinsic reaction rate of biomass char gasification with carbon dioxide and steam. Fuel May 2005;84(7e8):885e92.
[20] Asadullah Mohammad, Zhang Shu, Min Zhenhua, Yimsiri Piyachat, Li Chun-Zhu. Effects of biomass char structure on its gasification reactivity. Bioresour Technol June 2010;101(20):7935e43.
[21] Wornat Mary J, Hurt Robert H, Yang Nancy YC, Headley Thomas J. Structural and compositional transformations of biomass chars during combustion. Combust Flame January 1995;100(1e2):131e43.
[22] Tay Hui-Ling, Kajitani Shiro, Zhang Shu, Li Chun-Zhu. Effects of gasifying agent on the evolution of char structure during the gasification of Victorian brown coal. Fuel January 2013;103:22e8.
[23] Keown Daniel M, Hayashi Jun-Ichiro, Li Chun-Zhu. Drastic changes in biomass char structure and reactivity upon contact with steam. Fuel June 2008;87(7): 1127e32.
[24] Li Tingting, Zhang Lei, Dong Li, Li Chun-Zhu. Effects of gasification atmosphere and temperature on char structural evolution during the gasification of Collie sub-bituminous coal. Fuel January 2014;117:1190e5.
[25] Henriksen Ulrik, Hindsgaul Claus, Qvale Bjø rn, Fjellerup Jan, Jensen Anker Degn. Investigation of the anisotropic behavior of wood char particles during gasification. Energy & Fuels September 2006;20(5):2233e8.
[26] Huang Yanqin, Yin Xiuli, Wu Chuangzhi, Wang Congwei, Xie Jianjun, Zhou Zhaoqiu, et al. Effects of metal catalysts on CO2 gasification reactivity of biomass char. Biotechnol Adv 2009;27(5):568e72.
[27] Hognon C!eline, Dupont Capucine, Grateau Maguelone, Delrue Florian. Com-parison of steam gasification reactivity of algal and lignocellulosic biomass: influence of inorganic elements. Bioresour Technol May 2014;164:347e53. [28] Nzihou Ange, Stanmore Brian, Sharrock Patrick. A review of catalysts for the
gasification of biomass char, with some reference to coal. Energy September 2013;58:305e17.
[29] Bouraoui Zeineb, Jeguirim Mejdi, Guizani Chamseddine, Limousy Lionel, Dupont Capucine, Gadiou Roger. Thermogravimetric study on the influence of structural, textural and chemical properties of biomass chars on CO2
gasifi-cation reactivity. Energy 2015;88:703e10.
[30] Bouraoui Zeineb, Dupont Capucine, Jeguirim Mejdi, Limousy Lionel, Gadiou Roger. CO2gasification of woody biomass chars: the influence of K and
Si on char reactivity. Comptes Rendus Chim 2016;19(4):457e65.
[31] Klinghoffer Naomi B, Castaldi Marco J, Nzihou Ange. Catalyst properties and catalytic performance of char from biomass gasification. Industrial Eng Chem Res October 2012;51(40):13113e22.
[32] Lopez-Gonzalez D, Fernandez-Lopez M, Valverde JL, Sanchez-Silva L. Gasifi-cation of lignocellulosic biomass char obtained from pyrolysis: kinetic and evolved gas analyses. Energy 2014;71:456e67.
[33] Lopez Gartzen, Alvarez Jon, Amutio Maider, Arregi Aitor, Bilbao Javier, Olazar Martin. Assessment of steam gasification kinetics of the char from lignocellulosic biomass in a conical spouted bed reactor. Energy 2016;107: 493e501.
[34] Di Blasi Colomba. Combustion and gasification rates of lignocellulosic chars. Prog Energy Combust Sci April 2009;35(2):121e40.
[35] Pattanotai Teeranai, Watanabe Hirotatsu, Okazaki Ken. Experimental inves-tigation of intraparticle secondary reactions of tar during wood pyrolysis. Fuel February 2013;104:468e75.
[36] Guizani C, Escudero Sanz FJ, Salvador S. Influence of temperature and particle size on the single and mixed atmosphere gasification of biomass char with H2O and CO2. Fuel Process Technol February 2015;134:175e88.
[37] Guizani C, Escudero Sanz FJ, Salvador S. The gasification reactivity of high-heating-rate chars in single and mixed atmospheres of H2O and CO2. Fuel
June 2013;108:812e23.
[38] Jawhari T, Universitat De Barcelona, and De Investigacibn. Raman spectro-scopic characterization of some commercially available carbon black mate-rials. Carbon 1995;33(11):1561e5.
[39] Sadezky A, Muckenhuber H, Grothe H, Niessner R, P€oschl U. Raman micro-spectroscopy of soot and related carbonaceous materials: spectral analysis and structural information. Carbon July 2005;43(8):1731e42.
[40] Sheng C. Char structure characterised by Raman spectroscopy and its corre-lations with combustion reactivity. Fuel October 2007;86(15):2316e24. [41] Chabalala VP, Wagner N, Potgieter-Vermaak S. Investigation into the
evolu-tion of char structure using Raman spectroscopy in conjuncevolu-tion with coal petrography; Part 1. Fuel Process Technol April 2011;92(4):750e6. [42] Liu Xuhui, Zheng Ying, Liu Zhaohui, Ding Haoran, Huang Xiaohong,
Zheng Chuguang. Study on the evolution of the char structure during hydrogasification process using Raman spectroscopy. Fuel October 2015;157: 97e106.
[43] MATLAB. version 8.0 (R2012a). Natick, Massachusetts: The MathWorks Inc.; 2012.
[44] Haver Tom O. An introduction to signal processing in chemical analysis. 2009. [45] Jagiello Jacek, Olivier James P. 2D-NLDFT adsorption models for carbon slit-shaped pores with surface energetical heterogeneity and geometrical corru-gation. Carbon April 2013;55(2):70e80.
[46] Lowell S, Shields JE. Powder surface area and porosity. third edit Ed. Chapman and Hall; 1991.
[47] Marsh Harry, Rodriguez-reinoso Francisco. Activated carbon. Elsevier Science &Technology Books; 2006.
[48] Rom!an S, Gonz!alez JF, Gonz!alez-García CM, Zamora F. Control of pore development during CO2and steam activation of olive stones. Fuel Process
Technol August 2008;89(8):715e20.
[49] Klinghoffer Naomi. Utilization of char from biomass gasification in catalytic applications. PhD Thesis. New York, USA: Earth and Environmental Engi-neering Columbia University; 2013.
[50] Mitsuoka Keiichirou, Hayashi Shigeya, Amano Hiroshi, Kayahara Kenji, Sasaoaka Eiji, Uddin Md Azhar. Gasification of woody biomass char with CO2: the catalytic effects of K and Ca species on char gasification reactivity. Fuel Process Technol January 2011;92(1):26e31.
[51] Zhang Y, Ashizawa M, Kajitani S, Miura K. Proposal of a semi-empirical kinetic model to reconcile with gasification reactivity profiles of biomass chars. Fuel April 2008;87(4e5):475e81.
[52] Ghimbeu C, Gadiou R, Dentzer J, Vidal L, Vix-Guterl C. A TPD-MS study of the adsorption of ethanol/cyclohexane mixture on activated carbons. Adsorpt Sci Technol 2011;17:227e33.
[53] Karpinski Zbigniew, Szymanski Grzegorz S. The effect of the gradual thermal decomposition of surface oxygen species on the chemical and catalytic properties of oxidized activated carbon. carbon 2002;40:2627e39. [54] Rietsch Jean-Christophe, Brender Patrice, Dentzer Joseph, Gadiou Roger,
Vidal Loic, Vix-Guterl Cathie. Evidence of water chemisorption during graphite friction under moist conditions. Carbon 2013;55:90e7.