HAL Id: hal-01912042
https://hal.archives-ouvertes.fr/hal-01912042
Submitted on 5 Nov 2018
HAL is a multi-disciplinary open access archive for the deposit and dissemination of sci-entific research documents, whether they are pub-lished or not. The documents may come from teaching and research institutions in France or abroad, or from public or private research centers.
L’archive ouverte pluridisciplinaire HAL, est destinée au dépôt et à la diffusion de documents scientifiques de niveau recherche, publiés ou non, émanant des établissements d’enseignement et de recherche français ou étrangers, des laboratoires publics ou privés.
Vapor–Liquid Equilibrium Data for the Carbon Dioxide
(CO 2 ) + 1,1,1,3,3-Pentafluorobutane (R365mfc)
System at Temperatures from 283.15 to 337.15 K
Karima Djebaili, Elise El Ahmar, Alain Valtz, Abdeslam Hassen Meniai,
Christophe Coquelet
To cite this version:
Karima Djebaili, Elise El Ahmar, Alain Valtz, Abdeslam Hassen Meniai, Christophe Coquelet. Vapor– Liquid Equilibrium Data for the Carbon Dioxide (CO 2 ) + 1,1,1,3,3-Pentafluorobutane (R365mfc) System at Temperatures from 283.15 to 337.15 K. Journal of Chemical and Engineering Data, Amer-ican Chemical Society, 2018, �10.1021/acs.jced.8b00683�. �hal-01912042�
1
Vapor-liquid equilibrium data for the carbon dioxide (CO
2) + 1, 1, 1, 3,
3-pentafluorobutane (R365mfc) system at temperatures from 283.15 to
337.15 K
Karima Djebaili†, Elise El Ahmar†, ‡, , Alain Valtz†, ‡, Abdeslam Hassen Meniai†,Christophe Coquelet†, ‡ †Laboratoire de l’Ingénierie des Procédés de l’Environnement (LIPE), Département de Génie Chimique,
Université Constantine 3, Nouvelle Ville Ali Mendjli, Constantine 25000, Algérie. †,
‡ MINES ParisTech, PSL University, CTP – Centre of Thermodynamics of Processes;F-77300 Fontainebleau, France
2
Abstract
Isothermal vapor-liquid equilibrium data for the binary mixture of carbon dioxide (CO2) + 1, 1, 1, 3, 3-pentafluorobutane (R365mfc) were measured at six isotherms ranging from 283.16 to 337.16K, with pressure ranging from 0.7 to 9.1MPa and are presented.
The measurements were performed using a “static-analytic” apparatus, equipped with two capillary samplers ROLSI®, with phase analysis via gas chromatography. The measured data were correlated using in-house thermodynamic software based on the Peng-Robinson Equation of State with the Mathias-Copeman alpha function and the Wong-Sandler mixing rules incorporating the NRTL model.
Keywords: Experimental VLE data, R365mfc, Peng-Robinson EoS, Binary interaction parameters
1. Introduction
In the middle of the 20th century, a collective interest in the human effect on the environment had begun to emerge. In the fields of air conditioning and refrigeration, environmental issues of stratospheric ozone depletion and global warming have been the primary motivations for recent researches. The traditional refrigerants, i.e., chlorofluorocarbon (CFCs) and hydrochlorofluorocarbon (HCFCs) fluids, were banned by the Montreal Protocol (1987)1 because of their contribution to the depletion of the stratospheric ozone layer. As a consequence, considerable research effort was devoted to the development of environmentally safe refrigeration systems using working fluids the selection of which must be based on three factors: safety (toxicity and flammability), environmental impact (stratospheric ozone and climate change) and performance (cooling and heating with required capacity, energy efficiency, critical and boiling temperatures).
Natural fluids such as carbon dioxide (CO2) which is a well-known refrigerant is considered as an appropriate alternative to chlorinated substances2. Since CO2 is a component of air, obtained from atmosphere itself by fractionation, it would have no impact on global warming (apart from for the energy consumption associated with the fractionation process) and no effect on ozone depletion (Ozone Depletion Potential (ODP) = 0)3. CO2 which is an inert gas, has many excellent advantages in engineering applications, such as no toxicity, no inflammability, higher volumetric capacity, lower pressure ratio, better heat transfer properties, easy availability, lower price, no recycling problem and complete compatibility
3 with normal lubricants3. However, and despite its interesting thermodynamic characteristics, the use of CO2 limits come from its relatively low critical coordinates (TC = 304.21K, PC =73.81 bar)4 requiring the design of systems operating in a trans-critical cycle reaching
very high pressures or a cascading cycle.
Furthermore, hydrofluorocarbons (HFCs) which are derived from the partial substitution of hydrogen by fluor in the molecules of hydrocarbons have been mainly chosen to replace CFCs and HCFCs in refrigeration and air conditioning due to high merits in safety, performance and no effect on ozone depletion5. Indeed, according to the Kyoto Protocol (1997), most hydrofluorocarbons have large Global Warming Potentials (GWPs) and therefore provide a non-negligible, direct contribution to global warming when leaked to the atmosphere. HFCs have been also identified for use as separating agents in solvent extraction processes in the petrochemical industry. They are generally low in toxicity, are easily recycled, have high stability and are seen as a safer alternative to challenge organic solvents such as hydrocarbons or alcohols6-7.
Mixtures of CO2 and HFCs may be promising refrigerants since they can contemporarily reduce the problems connected to high operating pressure of CO2 and large Global Warming Potentials of HFCs. Supercritical CO2 and HFCs are being considered as ozone-depleting chemicals replacements due to their zero ozone-depletion potential, non-flammability, low toxicity, and high compatibility7.
Many measurements of binary Vapor-Liquid Equilibrium (VLE) for systems containing CO2 with HFCs have been previously undertaken by A.Valtz et al.8-10, F. Rivollet et al.11, C. Duran-Valencia et al.12 and K. Jeong et al.13. To the best of our knowledge, no vapor-liquid equilibrium data for the binary mixture CO2-R365mfc are available in the open literature.
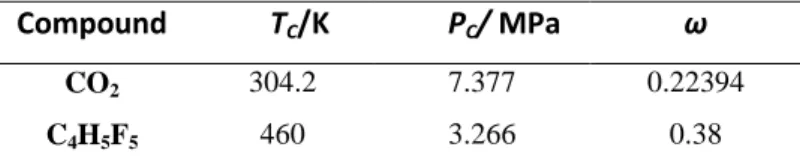
In the present work, this binary mixture was studied. The R365mfc, which is a flammable fluid, was chosen for its non-toxicity, its good environmental compatibility; zero ODP and moderate GWP (GWP = 790 over a time horizon of 10 years) and especially for its relatively high critical conditions (Tc = 460K, Pc = 3.266 MPa)4 enabling it to adapt, easily, in applications with condensation temperatures above 90°C. This volatile liquid (low boiling temperature TB = 40°C13) is an uncommon compound, EL Ahmar et al.14 and H. Madani et al.15 have presented data for the vapor-liquid equilibrium of two binary mixtures involving the R365mfc.
This paper is to provide new sets of data to characterize phase equilibrium of the binary mixture CO2 + 1, 1, 1, 3, 3-pentafluorobutane (R365mfc) at six isotherms from 283.16 to 337.16 K. The new data have been described with the Peng-Robinson Equation of State (PR
4 EoS)16 with the Mathias-Copeman alpha function17 and the Wong-Sandler (WS) mixing rules18 incorporating the Non Random Two Liquids (NRTL) activity coefficient model19. This article is organized as follows. A presentation of the experimental setup used to investigate vapor-liquid equilibrium (VLE) of binary mixtures followed by the data treatment, results and discussion.
2. Experimental Section
2.1 Chemicals
Carbon dioxide [CO2, CAS number: 124-38-9] was purchased from Air Liquide and has a certified purity greater than 99.995 vol.%. 1, 1, 1, 3, 3-pentafluobutane (R365mfc) [C4H5F5, CAS number: 406-58-6] was purchased from Arkema with a certified volume purity greater than 98%. Chemicals were used without any further purification.
2.2. Apparatus description
The apparatus used in the measurements is based on the “static-analytic” method. The apparatus is similar to that described by Valtz et al.8, 20.
The equilibrium cell was immersed inside a temperature regulated liquid bath. The temperature of the equilibrium cell was measured with two platinum resistance thermometer probes (Pt-100) inserted into the walls of the equilibrium cell. These Pt100 probes were calibrated against a 25 Ω reference probe (TINSLEY Precision Instrument) already certified by the Laboratoire National d’Essai (Paris). Pressures were measured using a Druck pressure transducer (Type PTX611, range: 0-16 MPa). This sensor was calibrated against a Dead Weight Pressure Balance (Model 5202S supplied by Desgranges and Huot). Pressure and temperature data acquisition was performed with a computer linked to an HP unit (HP34970A). The analysis of the phases (liquid and vapor) composition was carried out using a gas chromatograph (Perichom, Model: PR-2100) equipped with a Thermal Conductivity Detector (TCD) connected to a data acquisition system. The analytical column used for the separation was a 5% Krytox on CarboBlack B model with 60/80 mesh supplied by Restek, France. The TCD was calibrated by repeated injections of known amounts of each pure component into the injector of the gas chromatograph using a gas tight syringe. To estimate the uncertainties in temperature, pressure and composition, the guidelines of NIST21 were followed. The uncertainty estimation procedure is fully described by Zhang et al.22. Both measurements repeatability and calibration uncertainties were taken into account. All the expanded uncertainties (U(x1), U(y1), coverage factor, k=2) for experimental data are reported
later on. The resulting accuracies of pressure and temperature in this work were ±0.004 MPa and ±0.04 K, respectively.
5
2.3. Experimental procedure
At room temperature, the equilibrium cell and its associated loading lines were evacuated with a vacuum pump.. The cell was then loaded with given quantity (approximately 5 cm3) of the compound having the lowest vapor pressure (R365mfc). The liquid was degassed by periodically removing vapor phase through an overhead valve, while heating to the desired temperature. Then CO2 was introduced stepwise, leading to successive equilibrium mixtures of increasing overall CO2 content. After each new CO2 loading, equilibrium was assumed when the total pressure remains unchanged to within ±1.0 kPa during a period of 30 min under efficient stirring.
For each equilibrium condition, at least five samples of each phase (vapor and liquid) were withdrawn using the cappillary samplers ROLSI®,23 and analyzed in order to check the repeatability of that measurement.
3. Modeling
For binary mixture modeling, the critical parameters (temperature (TC) and pressure
(PC)), and acentric factor () for each pure component are provided in Table 14. With a φ -φ
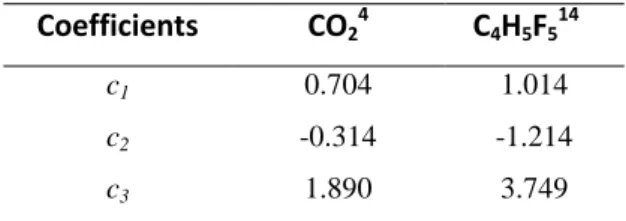
symmetric approach, experimental data were correlated using in-house software developed at CTP. The thermodynamic model which is presented in appendix A is based on the Peng Robinson cubic equation of state (PR EoS)16 with the Mathias-Copeman alpha function17, the Wong-Sandler mixing rules18 incorporating the NRTL activity coefficient model19. The Mathias-Copeman coefficients for the PR EoS are presented in Table 24,14. The interaction parameters (ij andji) are adjusted directly utilizing the measured VLE data through a modified Simplex algorithm24 using the following objective function:
2 exp exp 2 exp exp 100 y y y x x x N F cal cal (eq.01)Where N is the number of experimental data points, x, y are liquid and vapor phase mole fractions, respectively, exp and cal are subscripts denoting experimental and calculated, respectively.
4. Results and discussion
4.1 Vapor-Liquid Equilibrium data
Vapor-liquid equilibrum data for the binary mixture, CO2 (1) - R365mfc (2), were mesuread for six isotherms, i.e., (283.19, 293.23, 303.32, 317.73, 327.90, 337.81) K. Experimental and
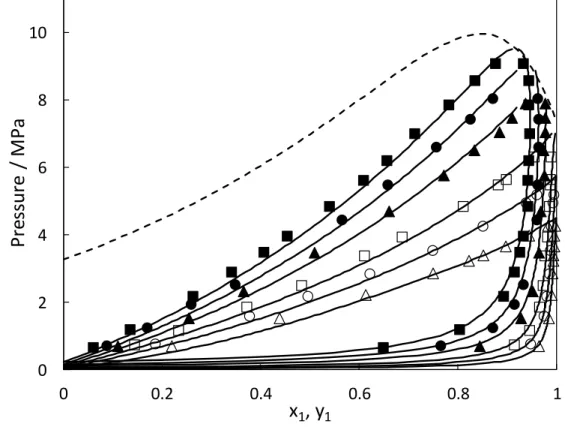
6 calculated results are reported in Table 3 and plotted in Figure 1, the mixture shows a strong negative deviation from the ideality (the vapor pressure of the mixture is lower than expected from Raoult’s law). This can be attributed to the large dipole moment of the R365mfc (μ365mfc
= 3.807 Debyes4) and quadrupole moment of CO2 which cause the increase of intermolecular attractive forces between the two components of the mixture. The phase diagram of the CO2 (1) - R365mfc (2) mixture is a type I in the Scott and van Konynenburg six types classification with one critical line joining the CO2 and R365mfc critical points.
To quantify the fit of the model to the experimental data, the deviations, AADU (average absolute deviation), RDU (relative deviation) and ARDU (average relative deviation) were determined for both the liquid and vapor phase mole fractions. The deviations are defined by:
exp 1 exp , , exp , exp / 100 N i i cal i i U U U N BIASU (eq.02)
exp 1 exp , , exp / 1 N i i cal i U U N AADU (eq.03)
, ,exp
/ ,exp . 100 Uical Ui Ui RDU (eq.04)
exp 1 exp , exp , , exp / / 100 N i i i cal i U U U N ARDU (eq.05)Where N, exp, cal as defined previously and U= x1 or y1.
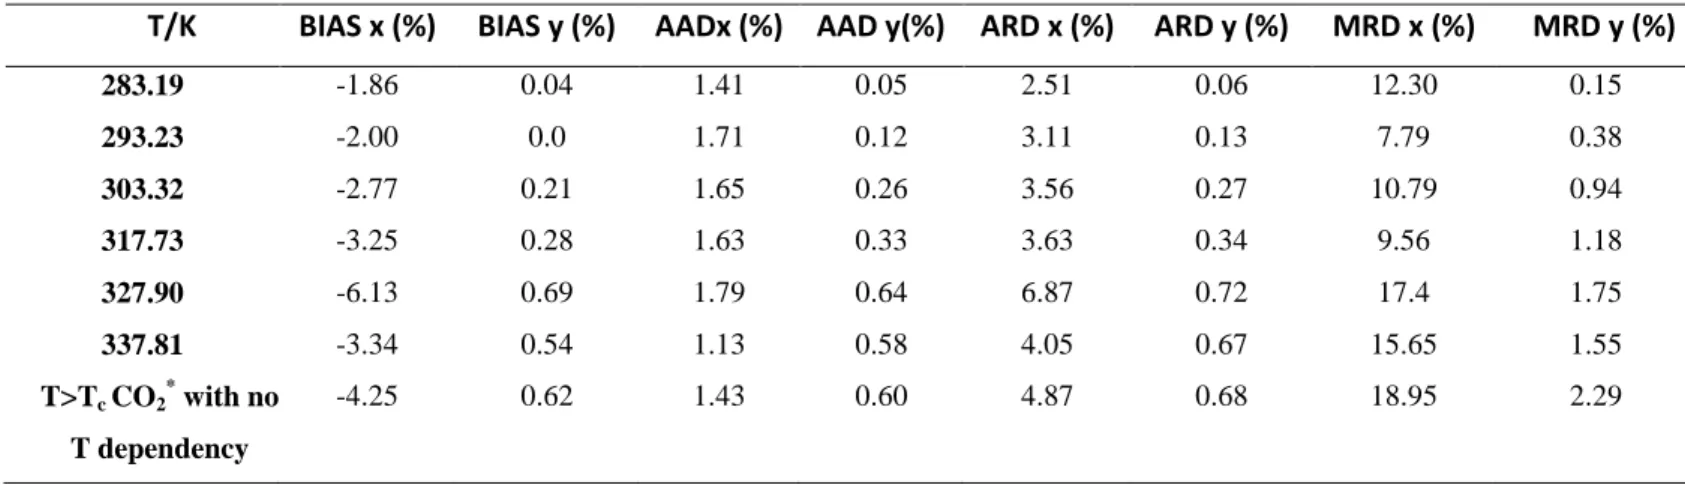
These indicators which give information about the agreement between model and experimental results are presented in Table 4. Generally, the model gives a good fit of the experimental data for both liquid and vapor compositions as shown in Table 4.
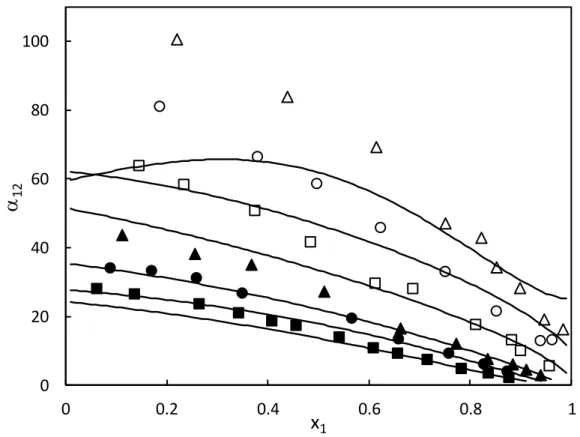
The relative volatilities were computed by means of the model and compared to the experimental values. Figure 2 shows the composition dependency of the relative volatility for the six measured isotherms. It can be seen that the separation factor α12 for the mixture CO2 (1) – R365mfc (2) decreases with increasing the temperature and the CO2 composition. Although the shape of the curves appears to be the same, the alpha values calculated by the model are lower than those determined from the experimental data, especially at low CO2 concentrations because of the uncertainties on vapor composition caused by the large differences in volatilities between the two substances.
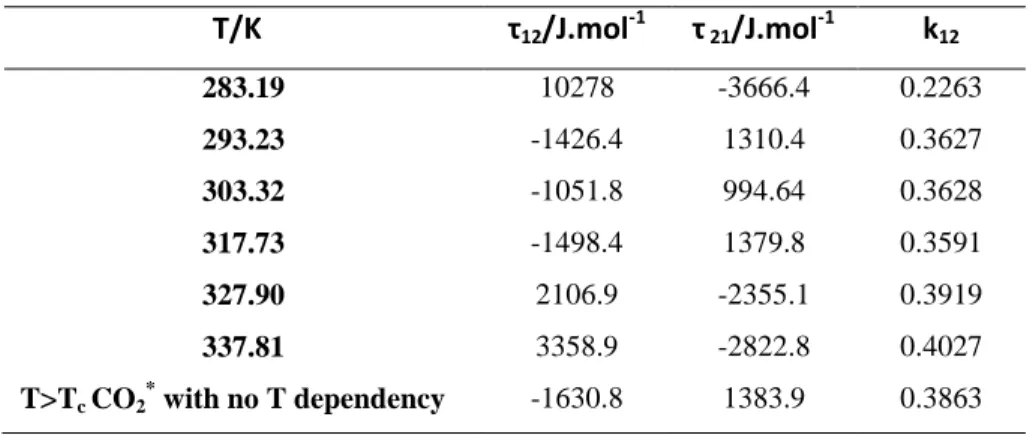
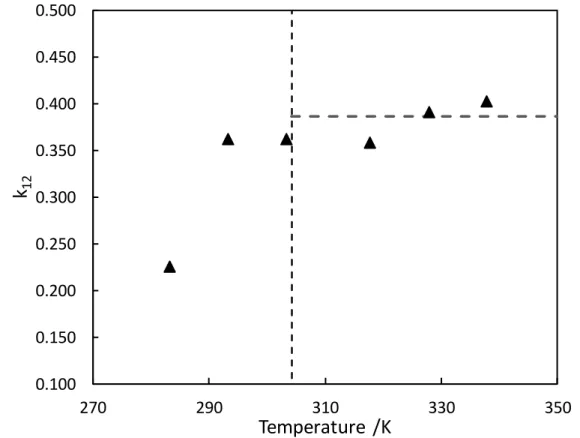
7 Binary interaction parameters τ12, τ21 and kij for the WS mixing rules are given in Table 5 and
plotted in Figures 3, 4 and 5. As it was observed in previous studies8-13, the parameters τ12, τ21
and kij behave differently below and above the critical temperature of the volatile component
(CO2). So it would be totally wrong to extrapolate temperature dependent binary parameters (adjusted only at temperatures above or below the lighter component’s critical temperature) to temperatures at the other side of the critical point. Also, parameters have been adjusted using all the data for T>TC of CO2. The results are presented in Table 5. These parameters are used to compute the critical line.
4.2 Critical point determination
Methods to calculate critical points were proposed by Heidemann and Khalil25 in 1980 and Michelsen and Heidemann26 in 1981. These authors assumed that the stability criterion for an isothermal variation between an initial stable point and a very close new one can be explained with a minimum of the Helmholtz energy (eq.06) and they considered that the volume variation at the critical point was constant.
0
0
0
0 0 0 0 0
i i i i i i i n n A A n V V P A A (eq.06)In this method the Taylor series expansion of the Helmholtz energy A was used around the stable state at constant total volume V (eq.07).
k j i V T i j k i j k j i V T i j i j n n n n n n A n n n n A
, 2 , 2 6 1 21 + Residual term > 0 (eq.07)
with the critical point corresponding to the limit of stability. They developed an algorithm to calculate the critical point with a van der waals type EoS, combined with the classical mixing rules. In 1998, Stockfleth and Dohrn27 improved this method by generalizing the algorithm of Heidemann and Khalil25 to a generalized equation of state. The Stockfleth and Dohrn27 method is chosen in this work to calculate the critical line using the PR EoS with WS mixing rules involving the NRTL model. The binary parameters used in this method were those obtained by correlating the VLE data in the CO2 supercritical domain. The predicted critical locus line is in good agreement with the experimental isothermal phase envelopes (Figure1). For four temperatures above the critical temperature of pure CO2, the critical phase behaviors of mixture were estimated at each temperature by using power laws with asymptotic behavior at critical point28-31 with the experimental data highly close to the critical point. The obtained results are presented in Table 6.
8
5. Conclusion
In this paper, Vapor-Liquid Equilibrium (VLE) data for the mixture (CO2 + C4H5F5) are presented at six isotherms: three isotherms below and three above the critical temperature of CO2. This mixture has not been previously studied and the measurements represent novel data in the open literature. The experimental setup using a “static-analytic” method is completely described and the uncertainties in the experimental data are also given for the temperature, the pressure and the equilibrium phase moles fractions. The experimental data were well correlated using in-house thermodynamic software based on the Peng-Robinson equation of state combined with the Mathias-Copeman alpha function and the Wong-Sandler mixing rule incorporating the NRTL model. Critical conditions were reported for the mixture under study and the binary critical point line was also calculated using this model.
The R365mfc is not principally used as a refrigerant but as blowing agent32. Its use as a refrigerant mixture requires that it be used with another refrigerant in the liquid state at ambient temperature and pressure. With the refrigerant mixture (R365mfc- CO2), a glide of pressure / temperature is observed. The application potentially targeted by this mixture would be heat pumps with thermal water as heat source, for example.
9
6. Appendix A
The thermodynamic model used in this study is based on the Peng Robinson cubic equation of state (PR EoS)16 with the Mathias-Copeman alpha function17, the Wong-Sandler mixing rules18 incorporating the NRTL activity coefficient model19. The PR EoS and the Mathias-Copeman alpha function are expressed as follows:
V b
b V b
V T a b V T R P (eq.01) C C P T R b 0.07780 (eq.02)
3 2 2 1 3 2 2 1 2 2 1 1 1 1 1 1 c TR c TR c TR T for Tr < 1 (eq.03)
12 2 1 1 1 c TR T for Tr > 1 (eq.04) where TC and PC are the critical temperature and pressure, respectively and TR is the reducedtemperature.
Wong-Sandler mixing rules is represented as:
i E i i i i ij j i j m CRT G T R b a x T R a b x x b 1 (eq.05)
i E i i i m m C G b a x b a (eq.06)
ij
j i ij k T R a b T R a b T R a b 1 2 1 (eq.07)Where Cln
21
/ 2 for the PR EoS, and k is the adjustable binary interaction ijparameter.
In this study, we have used the NRTL activity coefficient model to calculate the excess Gibbs energy:
ji j k ki ki k ji ji j i i i E T R x T R x x T R x P T g
exp exp , , (eq.08) ji is the non-randomness parameter which is fixed to 0.3 for such mixtures. ij and ji are
10
List of figures
Figure 1. Phase diagram (P-x-y) for CO2 (1) + C4H5F5 (2) mixture. Symbols: experimental work (△:283.19 K, ○:293.23 K, □: 303.32 K, ▲:317.73 K, ●: 327.90 K, ■:337.81 K); Black lines: PR EoS; dashed line: critical locus.
Figure 2. Plot of relative volatility (α12) against mole fraction for for CO2 (1) + C4H5F5 (2) mixture. Symbols: values obtained from experimental work (△:283.19 K, ○:293.23 K, □: 303.32 K, ▲:317.73 K, ●: 327.90 K, ■:337.81 K); Black lines: values obtained from PR EoS and are decreasing function of temperature.
Figure3.12 binary parameter as a function of temperature. Vertical dashed: CO2 critical temperature. Horizontal dashed line: parameter value obtained after considering all the data for T > Tc (CO2).
Figure4. 21 binary parameter as a function of temperature. Vertical dashed: CO2 critical temperature. Horizontal dashed line: parameter value obtained after considering all the data for T > Tc (CO2).
Figure 5. k12 binary parameter as a function of temperature. Vertical dashed line: CO2 critical temperature. Horizontal dashed line: parameter value obtained after considering all the data for T > Tc (CO2).
List of tables
Table 1. Critical properties and acentric factors for each pure component4.
Table 2. Mathias-Copeman coefficients for the PR EoS.
Table 3. Vapor-liquid equilibrium pressure and phase compositions for the CO2 (1) + C4H5F5 (2) binary mixture. composition: y for vapor phase and x for liquid phase, n: samples number). U(T)= 0.04 K, U(P)=0.004 MPa., U(x), U(y) (U: expanded uncertainties for a 0.95 confidence level (k=2)).
Table 4. Deviations BIAS, AADU, ARDU and MRDU (maximum RDU) obtained in fitting experimental VLE
data with PR EoS, Mathias-Copeman alpha function and WS mixing rules involving NRTL model for the CO2 (1) + C4H5F5 (2) binary mixture.
Table 5. Model parameters regressed for the PR EoS with the Mathias-Copeman alpha function and the WS
mixing rules incorporating the NRTL activity coefficient model for the CO2 (1) + C4H5F5 (2) binary mixture.
Table 6. Determination of critical points using power laws with asymptotic behavior for the CO2 (1) + C4H5F5 (2) binary mixture.
11
Table 1. Critical properties and acentric factors for each pure component4.
Compound TC/K PC/ MPa ω
CO2 304.2 7.377 0.22394
12
Table 2. Mathias-Copeman coefficients for the PR EoS.
Coefficients CO24 C4H5F514
c1 0.704 1.014
c2 -0.314 -1.214
13
Table 3. Vapor-liquid equilibrium pressure and phase compositions for the CO2 (1) + C4H5F5 (2) binary mixture. composition: y for vapor phase and x for liquid phase, n: samples number). U(T)= 0.04 K, U(P)=0.004 MPa., U(x), U(y) (U: expanded uncertainties for a 0.95 confidence level (k=2)).
T/K = 283.19 P/MPa x1 y1 U (x1) U(y1) nx1 ; ny1 0.7067 0.22 0.966 1E-02 2E-03 4;5 1.5355 0.439 0.985 2E-02 1E-03 5;5 2.2290 0.61 0.9915 2E-02 6E-04 4;4 2.8605 0.75 0.9934 2E-02 5E-04 4;4 3.2524 0.82 0.9953 1E-02 4E-04 4;4 3.4038 0.853 0.9958 9E-03 4E-04 5;4 3.6726 0.898 0.9967 7E-03 3E-04 5;4 3.9840 0.946 0.9972 4E-03 5E-04 5;4 4.2939 0.984 0.9991 1E-03 1E-04 4;5 T/K = 293.23 P/MPa x1 y1 U (x1) U(y1) nx1 ; ny1 0.7442 0.19 0.949 1E-02 3E-03 4;4 1.5745 0.38 0.976 2E-02 2E-03 5;4 2.1774 0.50 0.983 2E-02 1E-03 6;4 2.8301 0.62 0.9868 2E-02 9E-04 5;5 3.5419 0.75 0.9912 1E-02 7E-04 5;4 4.2497 0.853 0.9922 1E-02 6E-04 5;5 4.9454 0.944 0.9948 4E-03 4E-04 6;5 5.1753 0.962 0.9967 3E-03 4E-04 5;4 T/K = 303.32 P/MPa x1 y1 U (x1) U(y1) nx1 ; ny1 0.7263 0.146 0.916 9E-03 5E-03 5;4 1.1478 0.23 0.947 1E-02 4E-03 6;6 1.8411 0.37 0.968 2E-02 2E-03 6;6 2.4958 0.48 0.975 2E-02 2E-03 6;5 3.3739 0.61 0.979 2E-02 2E-03 4;5 3.9206 0.69 0.984 2E-02 1E-03 4;4 4.8458 0.812 0.987 1E-02 1E-03 4;5 5.4825 0.883 0.99 7E-03 7E-04 5;6 5.6522 0.901 0.989 6E-03 1E-03 4;4 6.3139 0.957 0.992 3E-03 6E-04 5;4
14 T/K = 317.70 P/MPa x1 y1 U (x1) U(y1) nx1 ; ny1 0.7021 0.112 0.846 7E-03 9E-03 5;4 1.5377 0.25 0.929 1E-02 5E-03 4;4 2.3358 0.37 0.953 2E-02 3E-03 4;6 3.4718 0.51 0.966 2E-02 2E-03 6;6 4.6955 0.66 0.971 2E-02 3E-03 5;5 5.7744 0.77 0.976 1E-02 2E-03 5;5 6.5165 0.83 0.975 1E-02 4E-03 4;6 7.0504 0.885 0.979 7E-03 7E-03 5;7 7.4811 0.911 0.979 6E-03 1E-03 4;4 7.8999 0.939 0.978 4E-03 2E-03 5;5 T/K = 337.81 P/MPa x1 y1 U (x1) U(y1) nx1 ; ny1 0.6602 0.062 0.65 4E-03 2E-02 4;5 1.1754 0.136 0.81 8E-03 1E-02 6;8 2.1828 0.26 0.895 1E-02 7E-03 7;5 2.8915 0.34 0.916 2E-02 5E-03 4;5 3.4900 0.41 0.928 2E-02 6E-03 5;6 3.9530 0.46 0.935 2E-02 4E-03 5;5 4.8282 0.54 0.943 2E-02 4E-03 6;6 5.6248 0.61 0.944 2E-02 5E-03 6;6 6.1989 0.66 0.946 2E-02 6E-03 6;6 7.002 0.71 0.948 1E-02 4E-03 6;7 7.8516 0.78 0.945 1E-02 8E-03 5;8 8.5800 0.84 0.945 1E-02 4E-03 7;5 9.0945 0.878 0.935 7E-03 4E-03 5;6
15
Table 4. Deviations BIAS, AADU, ARDU and MRDU (maximum RDU) obtained in fitting experimental VLE
data with PR EoS, Mathias-Copeman alpha function and WS mixing rules involving NRTL model for the CO2 (1) + C4H5F5 (2) binary mixture.
T/K BIAS x (%) BIAS y (%) AADx (%) AAD y(%) ARD x (%) ARD y (%) MRD x (%) MRD y (%)
283.19 -1.86 0.04 1.41 0.05 2.51 0.06 12.30 0.15 293.23 -2.00 0.0 1.71 0.12 3.11 0.13 7.79 0.38 303.32 -2.77 0.21 1.65 0.26 3.56 0.27 10.79 0.94 317.73 -3.25 0.28 1.63 0.33 3.63 0.34 9.56 1.18 327.90 -6.13 0.69 1.79 0.64 6.87 0.72 17.4 1.75 337.81 -3.34 0.54 1.13 0.58 4.05 0.67 15.65 1.55 T>Tc CO2* with no T dependency -4.25 0.62 1.43 0.60 4.87 0.68 18.95 2.29 *Tc CO2: critical temperature of CO2.
16
Table 5. Model parameters regressed for the PR EoS with the Mathias-Copeman alpha function and the WS
mixing rules incorporating the NRTL activity coefficient model for the CO2 (1) + C4H5F5 (2) binary mixture.
T/K τ12/J.mol-1 τ 21/J.mol-1 k12 283.19 10278 -3666.4 0.2263 293.23 -1426.4 1310.4 0.3627 303.32 -1051.8 994.64 0.3628 317.73 -1498.4 1379.8 0.3591 327.90 2106.9 -2355.1 0.3919 337.81 3358.9 -2822.8 0.4027 T>Tc CO2* with no T dependency -1630.8 1383.9 0.3863 *Tc CO2: critical temperature of CO2.
17
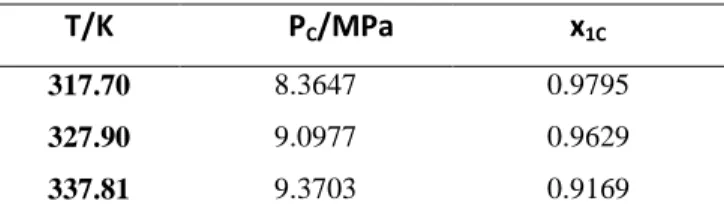
Table 6. Determination of critical points using power laws with asymptotic behavior for the CO2 (1) + C4H5F5 (2) binary mixture.
T/K PC/MPa x1C
317.70 8.3647 0.9795
327.90 9.0977 0.9629
18
7. References
(1) Montreal Protocol on substances that deplete the ozone layer, Montreal; 1987.
(2) Bhatkar, V.W., Kriplani, V.M., Awari, G.K. Alternative refrigerants in vapour compression refrigeration cycle for sustainable environment: A review of recent research, Int. J. Environ. Sci. Technol. 2013,10, 871-880.
(3) Aprea, C., Greco, A., Maiorino, A. An experimental study on charge optimisation of trans-critical CO2 cycle, Int. J. Environ. Sci. Technol. 2015, 12, 1097-1106.
(4) REFPROP software, ver.9., NIST Thermodynamic properties of refrigerants and refrigerant mixtures database. US Dept. of Commerce, USA, 2010.
(5) Bivens, D.B. Refrigeration and Air Conditioning with Reduced Environmental Impact. International Refrigeration and Air Conditioning conference 2010, 505-512.
(6) Grenfell, M.W., Klink, F.W., Yanome, H., Owens, J.G. New fluorinated solvent alternatives, Precision cleaning’95 proceedings. 1995, 301-309.
(7) Agopovich, J.W. Fluorocarbons and supercritical carbon dioxide serve niche needs. reprinted from Precision Cleaning magazine, 1995, Witter Publishing Co., Inc.
(8) Valtz, A., Coquelet, C., Baba-Ahmed, A., Richon, D. Vapour-liquid equilibrium data for the CO2 + 1, 1, 1, 2, 3, 3, 3-heptafluoropropane (R227ea) mixture at temperatures from 276.01 K to 367.30 K and pressures up to 7.4 MPa, Fluid Phase Equilib. 2003, 207, 53-67. (9) Valtz, A., Coquelet, C., Richon, D. Vapour-liquid equilibrium data for the hexafluoroethane + carbon dioxide mixture at temperatures from 253 to 297 K and pressures up to 6.5 MPa, Fluid Phase Equilib. 2007, 258, 179-185.
(10) Valtz, A., Courtial, X., Johansson, E., Coquelet, C., Ramjugernath, D. Isothermal vapour-liquid equilibrium data for the carbon dioxide (R744) + decafluorobutane (R610) mixture at temperatures from 263 to 353 K, Fluid Phase Equilib. 2011, 304, 44-51.
(11) Rivollet, F., Chapoy, A., Coquelet, C., Richon, D., Vapour-liquid equilibrium data for the carbon dioxide (CO2) + difluoromethane (R32) mixture at temperatures from 283.12 to 343.25 K and pressures up to 7.46 MPa, Fluid Phase Equilib. 2004, 218, 95-101.
(12) Duran-Valencia, C., Pointurier, G., Valtz, A., Guilbot, P., Richon, D. Vapour-liquid equilibrium data for the (carbon dioxide + 1, 1,1,2-Tetrafluoroethane) system at temperatures from 252.95 to 292.95 K and pressures up to 2 MPa, J. Chem. Eng. Data. 2002, 47, 59-61. (13) Jeong, K., Im, J., Lee, G., Lee, Y.-J., Kim, H. Vapour-liquid equilibria of the carbon dioxide (CO2) + 2, 2-dichloro-1, 1, 1-trifluoroethane (R123) system and carbon dioxide (CO2) + 1-chloro-1, 2, 2, 2-tetrafluoroethane (R124) system, Fluid Phase Equilib. 2007, 251, 63-67. (14) El Ahmar, E., Valtz, A., Abbas, L., Coquelet,C., Rached, W. Isothermal Vapour-liquid equilibrium data for binary azeotropic systems containing pentafluoro-chemicals at Temperatures from 363 to 413 K, Int. J. of Refrigeration. 2012, 35, 2297-2310.
(15) Madani, H., Valtz, A., Coquelet, C. Vapour-liquid equilibrium data concerning refrigerant systems (R3110 + R365mfc), Matec Web of Conferences, 2013.
(16) Peng, D.Y., Robinson, D.B. A new two constant equation of state, Ind. Eng. Chem. Fundam.1976, 15, 59-64.
(17) Mathias, P.M., Copeman, T.W. Extension of the Peng- Robinson equation of state to complex mixtures: Evaluation of various forms of the local composition concept, Fluid Phase Equilib. 1983, 13, 91-108.
(18) Wong, D.S.H., Sandler, S.I., A theoretically correct mixing rules for cubic equations of state, AIChE J.1992, 38, 671-680.
(19) Renon, H., Prausnitz, J.M. Local composition in thermodynamic excess function for liquid mixtures, AIChE J. 1968, 14, 135-144.
19 (20) Valtz, A., Coquelet, C., Baba-Ahmed, A., Richon, D. Vapour-liquid equilibrium data for the propane + 1, 1, 1, 2, 3, 3, 3-heptafluoropropane (R227ea) system at temperatures from 293.16 K to 353.18 K and pressures up to 3.4 MPa, Fluid Phase Equilib. 2002, 202, 29-47. (21) Taylor, B.N., Kuyatt, C.E. Guidelines for evaluating and expressing the uncertainty of NIST measurement results, National Institute of Standards and Technology, Gaithersburg, MD, 1994.
(22) Zhang, F., Théveneau, P., El Ahmar, E., Canet, X., Soo, C.-B., Coquelet, C., An improved static-analytic apparatus for vapour-liquid equilibrium (PTxy) measurement using modified in-situ samplers, Fluid Phase Equilib., 2016, 409, 425-433.
(23) Guilbot, P., Valtz, A., Legendre, H., Richon, D. Rapid on-line Sampler-injector: a reliable tool for HT-HP sampling and on-line GC analysis, Analusis. 2000, 28, 426-431. (24) Aberg, E.R., Gustavsson, A.G. Design and evaluation of modified simplex methods, Anal. Chim. Acta. 1982, 144, 39-53.
(25) Heidemann, R.A., Khalil, A.M. The Calculation of critical points, AIChE J. 1980, 26, 769-779.
(26) Michelsen, M.L., Heidemann, R.A. Calculation of critical points from cubic 2 constant equations of state, AIChE J.1981, 27, 521-523.
(27) Stockfleth, R., Dohrn, R. An algorithm for calculating critical points in multicomponents mixtures, Fluid Phase Equilib. 1998, 45, 43-52.
(28) Spain I. L., Paauwe, J. High Pressure Technology, 1977, volume 2, CRC Press.
(29) Rainwater, J., Williamson, F. Vapor-liquid equilibrium of near-critical binary alkane mixtures, International Journal of Thermophysics. 1986, 7, 65-74.
(30) Moldover M. R., Rainwater, J. C. Interfacial tension and vapor-liquid equilibria in the critical region of mixtures, The Journal of chemical physics, 1988, 88, 7772-7780.
(31) Ungerer, P., Tavitian, B., Boutin, A. Applications of molecular simulation in the oil and gas industry: Monte Carlo methods, Editions Technip, 2005.
(32) Marrocho, I.M., Olivera, N.S., Dohrn, R. Vapor-phase thermal conductivity, vapor pressure, and liquid density of R365mfc, J. Chem. Eng. Data. 2002, 47, 554-558
20
Figure 1. Phase diagram (P-x-y) for CO2 (1) + C4H5F5 (2) mixture. Symbols: experimental work (△:283.19 K, ○:293.23 K, □: 303.32 K, ▲:317.73 K, ●: 327.90 K, ■:337.81 K); Black lines: PR EoS; dashed line: critical locus. 0 2 4 6 8 10 0 0.2 0.4 0.6 0.8 1
P
re
ssu
re
/
M
P
a
x
1, y
121
Figure 2. Plot of relative volatility (α12) against mole fraction for for CO2 (1) + C4H5F5 (2) mixture. Symbols: values obtained from experimental work (△:283.19 K, ○:293.23 K, □: 303.32 K, ▲:317.73 K, ●: 327.90 K, ■:337.81 K); Black lines: values obtained from PR EoS and are decreasing function of temperature.
0 20 40 60 80 100 0 0.2 0.4 0.6 0.8 1
12x
122
Figure3.12 binary parameter as a function of temperature. Vertical dashed: CO2 critical temperature. Horizontal dashed line: parameter value obtained after considering all the data for T > Tc (CO2).
-3000 -1000 1000 3000 5000 7000 9000 11000 270 290 310 330 350
12/J
.m
o
l
-1Temperature /K
23
Figure4. 21 binary parameter as a function of temperature. Vertical dashed: CO2 critical temperature. Horizontal dashed line: parameter value obtained after considering all the data for T > Tc (CO2).
-4000 -3000 -2000 -1000 0 1000 270 290 310 330 350
21/J
.m
o
l
-1Temperature /K
24
Figure 5. k12 binary parameter as a function of temperature. Vertical dashed line: CO2 critical temperature. Horizontal dashed line: parameter value obtained after considering all the data for T > Tc (CO2).
0.100 0.150 0.200 0.250 0.300 0.350 0.400 0.450 0.500 270 290 310 330 350
k
12Temperature /K
25 For Table of Contents Only:
0 2 4 6 8 10 12 0 0.2 0.4 0.6 0.8 1 P re ss u re / M P a x1, y1