HAL Id: hal-02182349
https://hal.telecom-paris.fr/hal-02182349v2
Submitted on 16 Oct 2019
HAL is a multi-disciplinary open access
archive for the deposit and dissemination of
sci-entific research documents, whether they are
pub-lished or not. The documents may come from
teaching and research institutions in France or
abroad, or from public or private research centers.
L’archive ouverte pluridisciplinaire HAL, est
destinée au dépôt et à la diffusion de documents
scientifiques de niveau recherche, publiés ou non,
émanant des établissements d’enseignement et de
recherche français ou étrangers, des laboratoires
publics ou privés.
Understanding the Role of Alternatives in Data Analysis
Practices
Jiali Liu, Nadia Boukhelifa, James Eagan
To cite this version:
Jiali Liu, Nadia Boukhelifa, James Eagan. Understanding the Role of Alternatives in Data Analysis
Practices. IEEE Transactions on Visualization and Computer Graphics, Institute of Electrical and
Electronics Engineers, In press, pp.1-1. �10.1109/TVCG.2019.2934593�. �hal-02182349v2�
Computer Graphics. The final version of this record is available at:10.1109/TVCG.2019.2934593
Understanding the Role of Alternatives in Data Analysis Practices
Jiali Liu, Nadia Boukhelifa, and James R. Eagan
Abstract—
Data workers are people who perform data analysis activities as a part of their daily work but do not formally identify as data scientists. They come from various domains and often need to explore diverse sets of hypotheses and theories, a variety of data sources, algorithms, methods, tools, and visual designs. Taken together, we call these alternatives. To better understand and characterize the role of alternatives in their analyses, we conducted semi-structured interviews with 12 data workers with different types of expertise. We conducted four types of analyses to understand 1) why data workers explore alternatives; 2) the different notions of alternatives and how they fit into the sensemaking process; 3) the high-level processes around alternatives; and 4) their strategies to generate, explore, and manage those alternatives. We find that participants’ diverse levels of domain and computational expertise, experience with different tools, and collaboration within their broader context play an important role in how they explore these alternatives. These findings call out the need for more attention towards a deeper understanding of alternatives and the need for better tools to facilitate the exploration, interpretation, and management of alternatives. Drawing upon these analyses and findings, we present a framework based on participants’ 1) degree of attention, 2) abstraction level, and 3) analytic processes. We show how this framework can help understand how data workers consider such alternatives in their analyses and how tool designers might create tools to better support them.
Index Terms—alternatives, data workers, data analysis, data science, sensemaking, qualitative study
1 INTRODUCTION
Data analysis shares similar characteristics with experimental [41] and design processes [31]: both are open-ended, highly interactive, and iterative—where a broad space of possible solutions are explored until a satisfactory result emerges [15, 24]. Today, data analysis is carried out not only by trained professionals such as data scientists but also by “data workers”—people who come from a variety of domains and perform data analysis as part of their daily work but would not call themselves data scientists. Data workers have different levels of skill and handle analysis tasks with various degrees of formalism [4, 14, 22]. Their work often involves solving open-ended problems by exam-ining different sources of data and a broad space of possible solutions to extract insight and refine their mental models [13, 24]. As such, data workers explore different alternatives: they generate and compare multiple schemas [33], formulate solutions by combining parts from different exploration paths [24], and deal with uncertainty that could arise throughout analysis [4]. Moreover, multiple types of data worker need to collaborate to perform more complex analytic tasks [3, 22].
In this work, we focus on the role of these different kinds of alterna-tives in data work. Previous research has looked at different notions of alternatives such as multiples and multiforms [34] and experimented with various prototypes and design mechanisms aimed at providing better support for alternatives [5, 24, 37]. In visualization and related disciplines, the concept of alternatives has been widely used, yet there is no unified framework to reason about alternatives. Moreover, while real-world analyses tend to be messy and complex, today’s tools still largely rely on single-state models involving one user at a time [39]. This disconnect contributes to making analytic practices cumbersome and increases cognitive load [24, 28]. Worse still, a lack of support for exploring alternatives, explicit management of uncertainty in analysis, and support for collaboration in sense-making can lead to poor problem
• Jiali Liu is with LTCI, T´el´ecom Paris, Institut Polytechnique de Paris e-mail: [email protected].
• Nadia Boukhelifa is with INRA, Universit´e Paris-Saclay e-mail [email protected].
• James Eagan is with LTCI, T´el´ecom Paris, Institut Polytechnique de Paris e-mail: [email protected].
Manuscript received 31 Mar. 2019; accepted 1 Aug. 2019. Date of Publication 16 Aug. 2019. This is the authors’ version available for your personal use. For other uses or for obtaining reprints of this article, please send e-mail to: [email protected]. Digital Object Identifier: 10.1109/TVCG.2019.2934593
solving and decision-making [29].
Despite this breadth of work around sensemaking, the particular role of alternatives in sensemaking remains under-explored. To bridge this gap, we conducted an empirical study with 12 data workers from a variety of domains. The aim of this study was to identify the various concepts around alternatives that exist in practice; the reasons why data workers explore alternatives; the high-level processes around al-ternatives; and strategies adopted to cope with alternatives. Drawing from interview observations, we present a framework to reason about alternatives, based on participants’ 1) degree of attention, 2) abstraction level, and 3) analytic processes. Our goal is to provide a systematic way to think about alternatives for data workers and for tool designers. We show through examples how the proposed framework can clarify and enrich the description of alternatives, and how it may inspire tool designers to create tools to better support alternatives.
2 RELATEDWORK
In this section we review different notions and concepts of alternatives, the role of alternatives in the sensemaking process, and how alternatives are supported by current tools. We focus on the design and data analysis domains because they share common characteristics. Both portray highly iterative processes and handle ill-defined open-ended problems.
2.1 Various Concepts Around Alternatives
Merriam-Webster’s online dictionary [1] defines an alternative as some-thing that is “available as another possibility or choice.” Designers are encouraged to explore alternatives as the approach is believed to lead to better design solutions [40]. Hartmann et al. [15] further find that interaction designers build alternative design prototypes to better understand the design space, to reason about various design trade-offs, and to enable effective decision making within organisations. Wood et al.’s “branching narratives” model [43] in LitVis aims to further such design exploration by capturing design rationales to prompt the sharing and learning of alternative designs in visualization work. Parametric de-sign [7, 12, 44, 46] further distinguishes between the two related notions of alternatives and variations in design. Woodbury et al. [44] define alternatives as “structurally different solutions to a design,” while varia-tions are “design soluvaria-tions with identical model structure, but having different values assigned to parameters.”
Recent studies on data scientists’ work practices have found that they write alternative versions of exploratory code [2, 16, 24, 36] or use multiple alternative models, typically generated by different classes of
machine-learning algorithms [18]. Even within a single model, alterna-tives can also exist. In the context of model-based business intelligence, analysts vary input model parameters to explore alternative what-if scenarios [11, 32]. Similarly, Boukhelifa et al. [3] find that alternative analysis scenarios branch out from previous research questions and hypotheses in collaborative model sensemaking. In the context of in-telligence analysis, analysts often weigh alternative explanations and competing hypotheses [17, 23]. Kale et al. [21] focus on the importance of alternative analyses to managing uncertainty in research synthesis, and refer to alternatives as a “garden of forking paths.” Focusing on vi-sual analytics systems, Chen [7] and Guenther [12] describe other types of alternatives, including data and visualization alternatives. Whereas many of those studies observe alternatives in specific contexts, such as design-space exploration and computational notebooks [16, 24], our aim is to study the variety of alternatives that might exist in the wild and the processes around those alternatives.
2.2 Alternatives in Sensemaking Models
General sensemaking models provide a high-level view of alternatives in the sensemaking process. Pirolli & Card’s sensemaking loop [33] involves continuous generation of alternative hypotheses, which lead to updated mental schemas, finding new evidence, or gathering relevant data for processing. Analysts, however, may fail to generate new hypotheses due to time constraints or data overload. Pirolli & Card [33] argue for improving coverage of the space of possibilities by a set of generated hypotheses as a leverage point for sensemaking. Huber [20] also stresses the importance of conducting alternative what-if analyses and suggests pooling some subsets of the data and using a different, simpler, or more complex model. In Klein’s Data-Frame model [25], the process of questioning a frame can lead to both the generation of new alternative frames and the comparison of existing ones.
Other research looked at the role of alternatives in specific sense-making contexts. Guo [13] focuses on research programming, where researchers from different domains write code to obtain insight from data. In his characterization of this process, “exploring alternatives,” such as by tweaking scripts or execution parameters, ties together two key phases of the sensemaking process: reflection and analysis. In-sight is gained by making comparisons between output variants and exploring the different alternatives.
Although sensemaking models often consider alternatives as a single stage of analysis occurring within an iterative sensemaking loop, in practice it may be difficult to separate what-if analyses from other sensemaking actions. Huber [20] explains that this is because it is difficult to order the sensemaking phases since they naturally and repeatedly appear in cycles between different actions. In this work, we use interviews and scenario walkthroughs to delineate data workers’ sensemaking practices around alternatives.
2.3 Tools to Support Alternatives
Many analysis tools, including those used by data workers, rely on single-state models that involve one user at a time [38]. As a result, data workers use workarounds to explore and keep track of alternatives, such as by duplicating code snippets, functions, and files and by us-ing comments and undo commands [24, 35, 45]. Terry & Mynatt [38] observe some of the ways that designers improvise to create and ma-nipulate alternatives, such as creating and toggling layers; using a large canvas for multiple designs; versioning and file naming conventions; and using undo and redo to cycle between different states. Few tools, however, provide systematic or formal methods to handle alternatives. Below, we review such tools from the design and data analytics do-mains and illustrate with a few examples how they support alternatives generation and management.
From the design domain, Kolari´c et al.’s CAMBRIA [26] displays alternatives in a grid or in a user-defined layout, with “pass variable” and “pass value” operations to make it easier to manipulate alternatives. Zaman et al.’s GEM-NI and MACE [46] support creating and managing alternatives in generative design. In this context, they compare parallel editing methods and post-hoc synchronization of alternatives. Guen-ther’s Shiro [12] uses a declarative dataflow language for expressing
alternatives in parametric systems and provides a multi-state document model. Chen [7] introduces spaces, heads, and operations to describe variations in parametric systems. Their work provides a vocabulary for expressing alternative inputs to a parametric system. To facilitate the exploration of alternatives in parameter space, Design Galleries [10] automatically generates parametric alternatives in a spreedsheet layout. Parallel Pies [39] embed multiple parameter configurations of an im-age by sub-dividing the canvas for different transformations and using set-based interactions while manipulating images.
To support data scientists, Kery et al.’s Variolite [24] and Head et al.’s Code Gathering [16] extend computational notebooks and attempt to generalize interactions for dealing with alternatives and histories in exploratory programming tasks. In Variolite, users create alternative code blocks of any size, test different combinations of alternatives, and navigate through them using revision trees. Code Gathering deploys a “post-hoc mess management” strategy, which allows users to select desired results. It automatically generates ordered, minimal subsets that produced them. Wood et al.’s LitVis [43], described above in the context of design, uses computational notebooks to help designers explore alternate designs for visualizations. Lunzner & Hornbæk’s Subjunctive Interfaces [28] pioneered techniques for parallel exploration of multiple scenarios by extending the application’s user interface. They showed that their approach is useful in information processing tasks. Hartmann et al. [15] extended this work to create Juxtapose, a tool that supports both code and interface alternatives. Many interactive machine learning tools allow data analysts to quickly explore alternative machine learning algorithms as well as variations of those algorithms, e. g. [9, 19, 30]. In the context of mixed initiative systems, EvoGraphDice [5] combines the automatic detection of visual features with human evaluation to propose alternative views of the data in the form of two-dimensional projections organized in a scatterplot matrix.
These prototypes illustrate the variety of ways alternatives are gen-erated and managed, either as improvised workarounds or, to a lesser extent, as built-in tool functionalities. Our study aims to improve our understanding of how data workers cope with alternatives during the entire sensemaking process, the support tools, and informal strategies they rely on to generate, explore and manage those alternatives.
3 STUDYDESIGN
Our goal is to understand the role of alternatives in data workers’ real-world analyses and how they fit into their overall sensemaking practices. We conducted semi-structured interviews with twelve data workers from a variety of disciplines. In particular, we wanted to understand:
Q1 To what extent do data workers explicitly consider alternatives in their workflow?
Q2 When do they consider alternatives? Are there specific triggers & barriers for exploring alternatives?
Q3 What types of alternatives do they consider?
Q4 What strategies do they deploy to cope with alternatives?
3.1 Participants
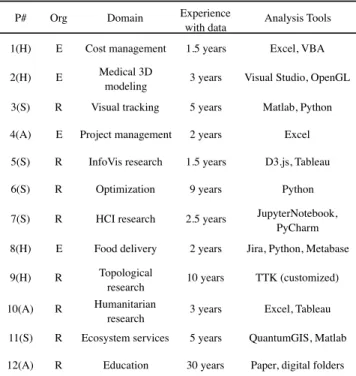
We recruited twelve participants who perform data work daily. Ages ranged from 22 to 63; three identified as female, nine as male. Par-ticipants were recruited by email through our social and professional networks. They come from a variety of disciplines: four participants work in industry, in sectors such as marketing, medical data modeling, and cost management. Eight participants work in research domains including Human-Computer Interaction (HCI), humanitarian research, and biology (see Table 1). They held a range of job titles from “re-searcher” to “assistant project manager,” “cost manager,” “consultant,” and “data analyst.” Most (nine) are junior in terms of experience in deal-ing with their specific domain of activity (1–5 years). Three have nine or more years of experience. While all participants have experience in data work, they have diverse levels of domain and computational exper-tise. In Kandel’s categorization [22], which focuses on computational tool capabilities, four can be classified as hackers, five as scripters, and three as application users.
Computer Graphics. The final version of this record is available at:10.1109/TVCG.2019.2934593
P# Org Domain Experience
with data Analysis Tools 1(H) E Cost management 1.5 years Excel, VBA
2(H) E Medical 3D
modeling 3 years Visual Studio, OpenGL 3(S) R Visual tracking 5 years Matlab, Python
4(A) E Project management 2 years Excel
5(S) R InfoVis research 1.5 years D3.js, Tableau
6(S) R Optimization 9 years Python
7(S) R HCI research 2.5 years JupyterNotebook, PyCharm 8(H) E Food delivery 2 years Jira, Python, Metabase 9(H) R Topological
research 10 years TTK (customized) 10(A) R Humanitarian
research 3 years Excel, Tableau 11(S) R Ecosystem services 5 years QuantumGIS, Matlab 12(A) R Education 30 years Paper, digital folders Table 1. Interview participants by domain of expertise. Brackets after IDs refer to S: Scripter, H: Hacker, A: Application User. Org is short for Organization, where R: research, E: enterprise.
Figure 1 shows participants’ level of expertise in programming and the application domain. Participants ranked their expertise from 1 to 5, with 1 as rudimentary knowledge of programming/little knowledge of the domain and 5 as good programming skills/strong domain knowl-edge. All study participants (except P3) fall either under a group we label mDomainExperts for data workers with strong domain knowledge but weak programming skills (mostly application users), or the group mHackers, with relatively strong computational skills but little knowl-edge of the domain. An exception is P3, a final year Ph. D. student who has relatively good domain knowledge and who also self-identifies as an expert in computational skills due to his engineering background.
3.2 Setting & Procedure
The study was conducted through semi-structured interviews. Inter-views were conducted in English, French, or Chinese, depending on the participant’s preference. Seven interviews were conducted in the participant’s primary workplace. Five were conducted by videocon-ference, including the participant’s computer desktop, for practical or workplace security restrictions.
Questions were open-ended to encourage participants to describe their experiences in their own words. Each interview consisted of three phases. The first phase aimed at understanding the participants’ general work context (goals, data, methods, tools, role in the team, etc.) and workflows. In the second phase, participants were asked to describe their workflow in more detail and to walk us through a recent analysis, step-by-step. (Participants were asked to prepare this analysis walkthrough during the recruitment phase.)
During recruitment and these first two phases, we did not reveal to participants that this work focussed on alternatives. Participants were told that we were interested in their reasoning and sensemaking process and in understanding their workflows. Our goal was to understand whether and how participants think about alternatives throughout their sensemaking process [Q1]. We did ask questions of the form “Did you think of other ways to do this?” or “Did you generate any other [artifacts, e. g., models]?” to encourage participants to describe any tacit alternatives they may have explored without explicitly orienting their thinking toward alternatives.
In the third phase, we revealed to participants that the main goal of
Fig. 1. Participants’ diverse levels of expertise in terms of computational skill and domain knowledge. Most participants belong to one of the following two groups: group “mDomainExperts” (mostly domain experts), who have more domain knowledge than programming skills; and partici-pants with mostly strong computational skills but little knowledge of the application domain, “mHackers.”
this study was to understand the role of alternatives in their work. How-ever, we attempted not to give any concrete definition of alternatives so as to reveal participants’ own interpretations. If pressed, we gave vague definitions such as “different possibilities you considered or tried out” or grounded them in the descriptions participants had already shared: For example, if a participant mentioned having tried several machine learning models, we might ask, “Do you think the different models that you explored are alternatives?” and if so, “Are there any other kinds of alternatives?” The goal of this third phase was to understand what alternativesmeant to participants and to focus more deeply on how they specifically managed them throughout their workflows [Q2–4].
3.3 Data Collection & Analysis
All interviews were recorded, generating 827 minutes of recordings in total. Recordings were transcribed into 73 895 words. Two authors in-dividually open-coded the transcripts, highlighting interesting portions of text or key ideas. We then collectively cross-checked these extracts to reach agreement, yielding 585 unique extracts (which we call notes or snippets).
We then used an iterative coding approach based on grounded the-ory [6] and digital affinity diagramming. We iteratively grouped notes based on common themes using a custom application on a wall-sized multi-touch display. Multiple analyses grouped snippets according to different facets drawn from the initial study goals (e. g., types of alternatives, tasks around alternatives, strategies for dealing with alter-natives, triggers & barriers) as well as those that emerged during the analysis phase (e. g., the role of expertise, collaboration). We further created higher-level diagrams to identify themes amongst the different categories (or clusters) of direct observations. This analysis yielded a collection of the various topics and themes extracted directly from the participants’ interviews.
We also conducted a second analysis that aimed at describing the overall workflows the participants followed. This analysis consisted of four steps: 1) we analyzed the transcript data and drew a high-level process diagram of the participant’s workflow; 2) each diagram was submitted to the corresponding participant for validation; 3) we analyzed the validated workflow diagrams to better understand when and how participants explore alternatives and the link between the different stages of analysis.
4 OBSERVATIONS
All participants described considering and exploring alternatives in their data analysis activities. Their diverse backgrounds in programming, modeling, and domain knowledge contribute to the different kinds of alternatives and strategies involved. In this section, we structure our
Triggers of
Exploring alternatives
Barriers of
Exploring alternatives - confront a dead-end - limited availability - realize limitation - too much learning effort - cognitive leap - time limitation
- collaboration - cognition bias - lack of expertise - collaboration
Table 2. Triggers and barriers to alternative exploration.
observations on our participants around four topics: why data workers explore alternatives (Section 4.1), what are alternatives as revealed by our participants (Section 4.2), participants’ high-level processes around alternatives (Section 4.3), and strategies they employ to cope with alternatives (Section 4.4). In Section 5, we structure these dimensions into a framework for understanding alternatives.
4.1 Why Data Workers Explore Alternatives
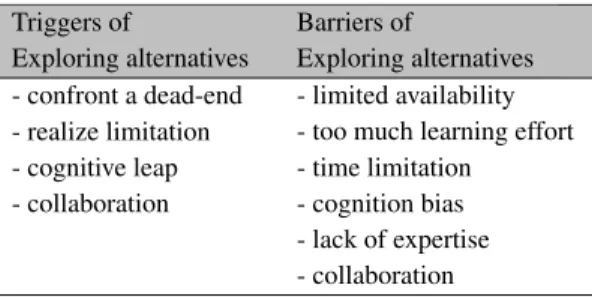
All participants—with the exception of P4, whose work tended to follow a clearly-defined pipeline—described that alternatives play an important role in their analysis practices. In this section, we describe some of the reasons why data workers consider alternatives, as revealed by our participants. We also look at factors that instigated the exploration of alternatives, as well as barriers that reduced such activities. We discuss these triggers and barriers below, summarized in Table 2.
4.1.1 Reasons to Value Alternatives
We found four main reasons why participants valued exploring alter-natives during sensemaking: to clarify goals and processes, to delay decision making, to build confidence in a solution, and to partition the sensemaking workload.
The very nature of data work and sensemaking is messy, with partial hypotheses, loosely defined goals, and incomplete methods to address them, particularly at the start of an analysis. Analysts must instantiate multiple ideas and iteratively update them to better define the problem and a reasonable path to solve it. P9 describes how he needs to consider multiple visualisation and analysis methods: “One of the things that is specific to our research is that [data providers] are not sure what they want. So if there are several options there, possible or interesting for them, they need to be able to switch between them.”
When different exploration paths are equally viable, data workers may delay decision making by considering as many of them as possible. In such cases, deciding which analysis path is the most pertinent does not have to be taken at the start of the exploration. As P6 observes, “For machine learning, . . . it’s correct that there is no single technique
that is the best for every problem. . . . so you try them all.”
Other participants considered alternatives when they felt their current alternative was just “not good enough.” By considering alternatives, they would either find a better solution or build their confidence in the current solution. This lack of confidence can also originate from the analyst’s lack of experience, as expressed by P8: “If you have more experience, maybe you will know, for this type of data that method will always be bad, so you don’t need to try it, but this needs more experience. So for now, we just try all the possibilities that we can.”
Often collaboration with other data workers led our participants to consider new alternatives. For example, a colleague might suggest a new direction to consider: “I tried with some evolutionary algorithms I coded myself with Matlab. Then I worked with [a colleague], he proposed to use some packages for evolutionary algorithms”(P11). In this way, participants would partition the sensemaking workload. 4.1.2 Triggers & Barriers
We coded interview transcripts to look for specific triggers or barriers to considering alternatives. We found four main triggers evoked by our participants that led them to consider alternatives and six main types of
barriers that reduced the likelihood of doing that. Table 2 summarizes these findings.
Triggers It is common for a data worker to run into a dead-end during analysis or to find evidence counter to the current hypothesis. These events act as triggers to finding alternate solutions. For example P7 initially wanted to model his data with machine learning algorithms, but he failed to find an appropriate solution and decided to manually annotate the data instead: “All of these things [ML algorithms] we explored, they don’t work as we would like them to. Because in the end, they are very prone to errors, outliers. . . . In the end, we decided to annotate our data manually instead”(P7).
When data workers recognize a limitation or deficiency in the current solution, they may consider new alternatives. For example, when P10 realized that online data scraping was not providing the rich information she needs, she recognized the “. . . need to go and collect data with refugees themselves.”
When inspiration strikes, a data worker’s cognitive leap might trigger a new collection of alternatives to explore. For example, P9 made the cognitive leap that a less-realistic orientation of the data would lead to easier interpretation of the data: “everybody showed it the real way, . . . but I figured that to see the geometry of the thing, it was better to flip it and we would have a better view.”
Finally, collaboration events can trigger the pursuit of alternatives. Different people in a team may have diverse background and exper-tise, which can bring new points of view on how to solve a problem. For example, P11 used a manually-created model until his collabora-tor suggested trying out machine-learning approaches. Similarly, P5 changed his coding environment to Jupyter Notebooks to facilitate communication with his mentor.
Barriers To identify barriers to exploring alternatives, we included questions of the form, “What stopped you from trying alternatives?” and “You just mentioned you considered other options, did you pur-sue them? (If not) why not?” Participants also revealed such barriers through their own descriptions about the difficulties or problems en-countered. We coded transcripts for these kinds of barriers, yielding six common types of barriers amongst our participants.
Limited data and tool availability often prevented participants from instantiating their ideas. For example, when P11 wanted to enrich his model, he could not because “. . . at that moment, I didn’t have the data” (P11). Similarly, when he wanted to perform a different analysis, he found that his open-source tool did not have that feature implemented. Just as financial constraints limited his tool availability, time constraints prevented participants from exploring potential alternatives. As P5 succinctly described: “we didn’t have that much time.” Similarly, too much learning effort hindered efforts to attempt new solutions, as when P10 was hesitant to try a new tool “because there are not that many tools that you can learn how to use without training.”
A lack of expertise prevented some participants from judging or evaluating alternative approaches. For example, P4 abandoned automat-ing her analysis pipeline usautomat-ing Excel macros because she realized she did not sufficiently understand the VBA language used to write them. More generally, such lack of expertise often acted as a counterforce to recognizing, evaluating, or pursuing alternatives.
While a lack of expertise can act both as a reason why participants considered alternatives and as a barrier to considering alternatives, we do not include it as a trigger since we did not see it act as a specific catalyst to considering alternatives.
Cognitive biases tended to guide participants to reuse alternatives that they had considered in previous projects, thus preventing them from considering new alternatives. Conversely, participants sometimes justified excluding alternatives because they had found them not to work in a past project. This tendency has been recognized as a bias that can lead intelligence analysts and policy makers to make poor decisions [29].
Finally, collaboration effects can act not only as a trigger but also as a barrier to exploring alternatives. In order to maintain consistency within an organization, improve communication efficiency, and facili-tate management, data workers often follow certain predefined pipelines
Computer Graphics. The final version of this record is available at:10.1109/TVCG.2019.2934593
Multiples
Options
Choices Alternatives
Low attention degree Medium attention degree
High attention degree
http:// data.gov.sg Datasets on Marriage Certain important
LineGraphs Chord diagram
Using animation method Six distinguable colors Data on two websites clusters on different themes LineGraphs with interesting patterns Three potential Visualisations Methods to solve time issues Certain color schemas All Datasets LineGraphs [Generated by
Tableau] Visualisations in d3 gallery + + +
Choose datasets Build visual model Refine visualisations
(b) Apply the M-O-C model (left) on P5’s data analysis processes
(a) M-O-C model: alternatives characterised on degree of attention
Color schemas
online
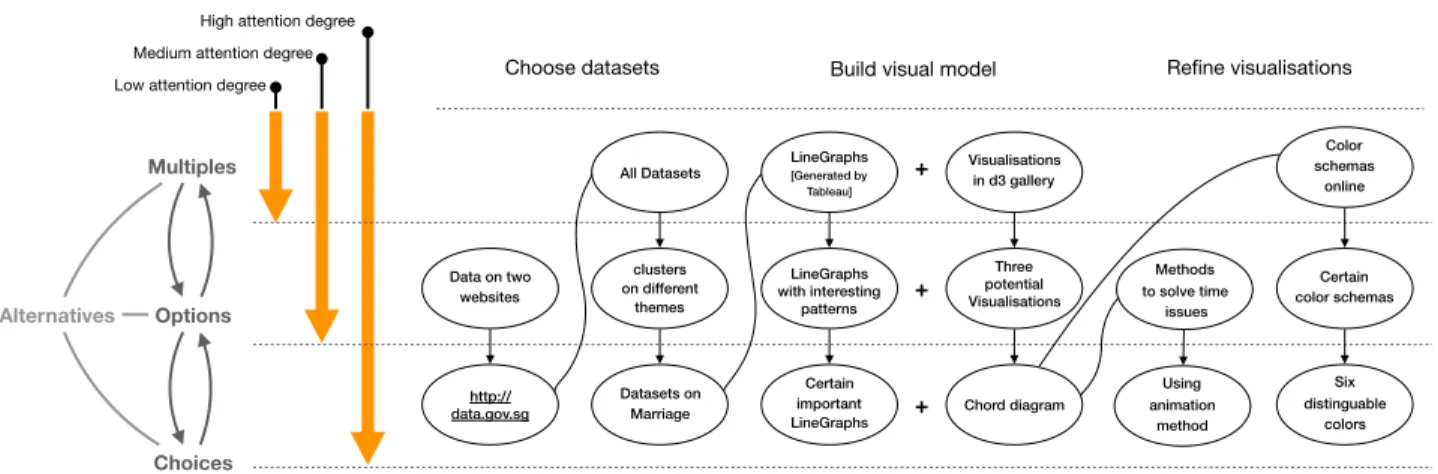
Fig. 2. (a), left: Alternatives characterized based on the data worker’s degree of attention. (b) A workflow showing alternatives for P5. Alternatives are grouped along the y-axis according to their degree of attention. Along the x-axis are different stages along the analysis. We can see different alternatives migrate between different attention degrees at different stages of the analysis as their frames of reference evolve.
and use a set of predetermined tools. Introducing a new tool, analysis, or model not shared by collaborators introduces a collaboration cost, even if individually it may be worthwhile to pursue. For example, P1 continues to perform analyses using Excel: “Personally, I would like to try Python, but if we use Python, it’s kind of difficult for others to manipulate the interface or the code inside. . . . The people who need to see are not developers, but likely managers or directors.”
4.2 What are Alternatives
While past work (see Section 2) has explored various concepts of alter-natives, what constitutes an alternative remains ambiguous. Different meanings of alternative exist in different contexts, and the term itself encapsulates many concepts. In this section, we unpack alternatives through the lens of data workers’ analytic practices, focusing on the different kinds and meanings of alternatives for our data workers.
Rather than treating the exploration of alternatives as a separate stage of the data analysis pipeline [20] or as a separate activity that ties reflection with analysis during research programming workflows [13], participants revealed that alternatives and their impact on data analysis activities are ubiquitous.
Just what constitutes an alternative, however, can be ambiguous. Alternatives could encompass multiple iterative versions of the same artifact or refined versions of a given hypothesis or altogether distinct methods to analyze data. Intuitively, however, these different kinds of alternatives seem fundamentally different.
To clarify these multiple notions and roles of alternatives, we struc-ture our observations in terms of participants’ degree of attention (Section 4.2.1) and around the abstraction level of alternatives (Sec-tion 4.2.2).
4.2.1 Degree of Attention
We first classify alternatives according to the amount of attention paid by the analyst: Multiples are analytic artifacts generated or explored during the sensemaking process, such as code versions, annotations in a notebook, or visualisation trails. They exist as direct entities evoked during ideation and exploration, drawn from the larger universe of possibilities. Data workers are aware of them, but no special attention is put on any single one. Options are drawn from these multiples as they are brought into the analyst’s consciousness for closer examination or deeper consideration, such as when the analyst narrows down focus to a smaller set of potential analyses drawn from the literature. Choices are options that are actively pursued in analysis. The distinction between multiples, options, and choices thus depends on the amount of attention paid by the analyst. In the remainder of this paper, we use the term
alternativeto refer to the union of multiples, options, and choices, regardless of the analyst’s degree of attention.
Past work has distinguished between variations and versions (e. g., [13, 16, 24, 36]), with these definitions depending on the iter-ation of the alternative. While this distinction is useful, we find it incomplete—alternatives can evolve throughout the analytic process. What might be ephemeral (a multiple) at one stage might become the focus of attention later (an option or a choice), as when P1 attempts to retrieve a past version of work.
Fluidity of Attention At different phases throughout the analytic process, a given alternative might be a multiple, then an option, a choice, and end up a mere multiple. At any given time, there may be any number of each of these types of alternative.
Multiples may be generated as an initial step in exploration to enlarge the possible solution space. For example, P2 collected around 50 papers describing potential methods to use in modeling organs. We can think of these articles as multiples drawn from the larger universe of potential methods. P2 then skimmed through these multiple methods to identify two options to pursue. At first, she implemented one technique, making a choice. Later, she implemented the other one. After comparing these two options and analyzing the trade-offs, she chose to continue her project with the first technique.
The distinction between multiples, options, and choice can be fuzzy as alternatives fluidly move both up and down among these three levels. A multiple can turn into an option or even a choice along the sensemak-ing process. On the other hand, a choice can become again an option or multiple when the analyst gives consideration to other alternate options. These definitions thus depend on the analyst’s “frame of reference.” For example, P5 collected multiple potential datasets to visualize. Dur-ing this process, the different datasets are active alternatives that move up and down along the three-levels. Once he had selected a given a dataset and moved on to considering what type of visualisation to use, the consideration of alternative datasets faded into the background. As such, under his new frame of reference, the dataset becomes a fixed choice and different visualisation types become the current active alternatives, as shown in Figure 2.
Moreover, exploration can start at any of these three levels, depend-ing on the strategy involved (see Section 4.4). In a breadth-first, or “shotgun,” strategy, multiple multiples are selected first to identify and focus on as options. In a depth-first, or “sniper,” strategy, a data worker may make an immediate choice to focus on a given path until some trig-ger motivates the exploration of other alternatives (see Section 4.1.2).
4.2.2 Level of Abstraction
We performed a bottom-up analysis of interview transcripts and iden-tify ten types of alternative considered by our participants: hypothesis, mental model, interpretation, data, model, representation, tool, code, pa-rameter, and method. Most of these alternative types, such as methods, were explicitly identified by participants. Others, such as mental mod-els, were not explicitly mentioned by participants but were revealed in the course of their interviews. We group these types of alternative into three levels of abstraction based on their role in the analytic process: Cognitive alternatives pertain to human reasoning, including
alterna-tive hypotheses, mental models, and interpretations.
Artifact alternatives relate to different types of concrete artifacts, such as alternative data, models, representations, or tools.
Execution alternatives refer to how data workers carry out an activity, including method, code and parameter alternatives.
While these ten types of alternative are not intended to comprise an exhaustive taxonomy of the different kinds of alternative that may exist, we do expect any other alternative types to fit within these three layers of abstraction.
Cognitive Alternatives pertain to data workers’ evolving mental processes throughout the different iterations of their analysis. Data workers may develop alternate interpretations, adjust their mental mod-els, and formulate new hypotheses. For example, when analyzing apps built for migrants, P10 considered alternative hypotheses about their production rate: “When these apps were built, is there kind of a pattern there [e. g. following refugee crises], or it’s like 20 every year?”P7 expressed alternate interpretations of a finding on people’s behaviors in log data: “This is also an interesting result, because this may indicate that people actually started considering to switch. . . before they actu-ally did, or maybe this finding is just noise. . . we need to analyze more data to see.”
Artifact Alternatives involve the different things involved in anal-ysis, such as data, models, representations, or tools: which data sets are to be analysed, what kinds of models to use on the data, what visual designs are best-suited for presenting results, or which analysis tools to use to perform these tasks. Each of these types of artifact alternative describes a collection of different specific kinds of alternative. For ex-ample, data alternatives include all alternatives pertaining to data, such as using different data sets, data providers, dimensions, or even differ-ent values. Model alternatives involve, for example, differdiffer-ent machine learning algorithms, statistical models, mathematical models, or other ways of structuring the interpretation of data. They may be machine-centric (e. g., neural networks or random forests), human-machine-centric (e. g., manual annotation or hand-crafted models), or even hybrids of the two. Representation alternatives pertain to different ways of depicting the various artifacts in the sensemaking process. Finally, tool alternatives include the different analytic tools that can be used, including software tools (e. g., Excel, Tableau, home-grown libraries) or analyses.
Execution Alternatives involve the means by which the data worker carries out an activity. This can include method, code, and parameter alternatives. For example, to obtain data from a given data source, P5 would choose between directly downloading data or using a data scraper. Six participants described tuning parameters of their models. Another six participants described using or creating different versions of code. In all of these cases, execution alternatives describe the means by which to accomplish a particular task.
The abstraction level of an alternative can further depend on its degree of attention. For example, when tuning a model, different parameter alternatives fall in the execution level: they pertain to the means by which the data worker carries out the activity. At some point, however, different parameter configurations of the same model might themselves become distinct artifacts, as when P3 compares different computer vision solutions. As such, the type of an alternative does not appear to be a concept intrinsic to the alternative; rather, it seems to at least partially depend on the data worker’s frame of reference.
Alternatives arose throughout the data analysis processes and at different abstraction levels. They are often interdependent: changing
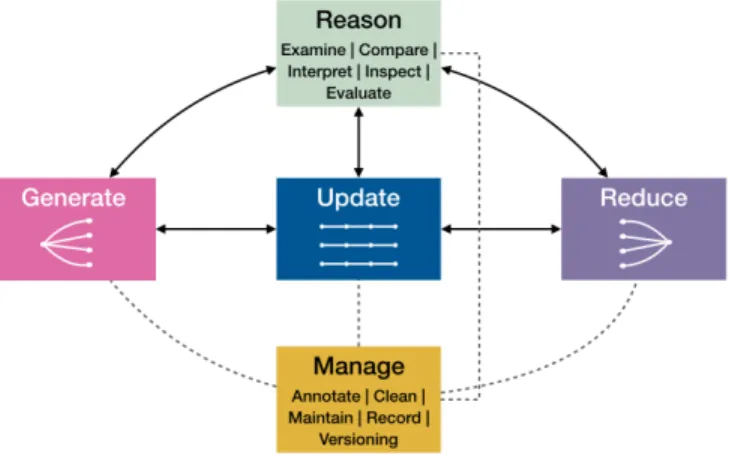
Fig. 3. The five high-level processes around alternatives: Generate, Update, and Reduce are distinguished by their different “shapes” within the alternative space (divergent, parallel, convergent). Reason and Manage do not directly produce alternatives, but operate on them.
between alternatives at one level can influence the others. For example, changing hypotheses may lead to building alternate models, running scripts with different parameters as input, or even changing the under-lying methods. Similarly, choosing new parameter values can result in new findings that lead to alternate mental models and hypotheses.
This interwoven nature among different types of alternatives corre-sponds to the complex, intertwining processes of data analysis activities. The analytic results or insights generated are also sensitive to these alternatives at different layers—how data are collected, what features are extracted, what methods are used to produce them. Any alternative in the analysis pipeline can lead to different results. As such, different types of alternatives cannot be treated as wholly independent.
4.3 High-level Processes on Alternatives
In this section, we describe five high-level processes, or abstract tasks, that our participants engaged in when handling alternatives: Generate, Update, Reduce, Reason,and Manage (see Figure 3). Each process operates on alternatives. The first three differ in the shape of how they affect the cardinality of the alternative space. The other two do not directly produce alternatives, but operate on them. As we will see below, Generate, Reduce, and Manage apply to alternatives at all three levels of attention, whereas Update and Reason seem to apply only to options and choices. Each process happens at all three layers of abstraction.
Generate expands the alternatives space. It encompasses tasks such as formulating new hypotheses, finding a new visual design (e. g., from the D3 example gallery), identifying a new data collection method, combining parts of several methods to make a new one, or creating a new code branch. All participants generated alternatives during their analysis, either in a preparatory phase prior to exploration or during the analysis as situated actions [27] in response to new task requirements. For example, prior to analysis, P3 performed a literature review and consulted with colleagues to select several promising approaches to improve a visual tracking application. During analysis, however, he found that the results were still not satisfactory, so he investigated a different family of methods.
Update refines an existing set of options and choices. At first glance, this process might seem to be contradictory: updating an al-ternative typically produces a new alal-ternative. For example, when tuning (updating) an image saturation parameter, this refinement yields a new (tuned) alternative in addition to the original. In most cases, however, either the original alternative or its update becomes a mere multiple: it no longer receives any attention. As such, while the number of alternatives may increase, the number of options or choices remains constant. In other words, the difference between updating an alternative
Computer Graphics. The final version of this record is available at:10.1109/TVCG.2019.2934593 and generating a new alternative largely has to do with whether the user
intendsto come back to both alternatives.
For example, P10 who studies the use of technology by migrants, regularly receives new, updated, data. Although each new update provides more up-to-date information, P10 continues to store all the different versions: “I stored all of them. . . . For now, I don’t need to look at the previous versions, but I feel safe that they are there. I can reach them when needed.”
Reduce decreases the number of alternatives and represents the convergent phase of analysis. It includes tasks such as filtering, exclud-ing data sets (e. g., those identified as poor in quality), and mergexclud-ing multiple code versions. These operations can be manual, automatic, or semi-automatic. For example, P6 works on a multi-objective problem where he needs to present the set of alternative optimal solutions to a de-cision maker. He deploys a two-level filtering approach, where he first uses a multi-objective optimization algorithm to automatically select a subset of optimal solutions (the Pareto front), then the decision maker manually selects the best solution(s) according to his preferences.
Reason encapsulates all tasks that result in the generation of thoughts, insights, or decisions on alternatives. We identified reasoning tasks such as compare, inspect, examine, interpret, understand, and evaluate. The process of reasoning is often a combination of a series of tasks. For example, P6 created a table to compare the performance of different classifiers and regressors, revealing that decision trees tend to produce better results. Reflecting on his past experience and domain knowlege, he could confirm this finding and share it with colleagues.
Manage refers to the operations that structure, organize and main-tain alternatives for later reference or reuse, such as annotating (e. g., comments on pros & cons of alternate methods), versioning pieces of code, and writing scripts to remove multiples that are no longer needed.
4.4 Strategies to Cope with Alternatives
In this section, we share various strategies deployed by our participants, structured by process. We do not try to give an exhaustive categorization by enumerating all possible strategies. Instead, we provide descriptions based on recurring strategies observed among participants.
The two most common strategies for exploring alternatives could be called depth-first (or “sniper”) and breadth-first (“shotgun”). In the depth-first strategy, the participant would concentrate on a given, promising alternative (choice), considering other alternatives only when needed (such as when recognizing a dead-end). In the breadth-first strategy, the analyst would generate many multiples or options to pursue before eventually focusing down on one or two promising choices. For example, P6 would throw “all” of the machine learning algorithms in his tool chest at a particular problem (“So you try them all”) before winnowing them down to those that perform best.
Generating, Updating and Reducing Alternatives In each of these three processes, participants would often consult external re-sources; draw on past experience or domain knowledge; or use trial and error. Participants frequently consulted external sources to gen-erate new methods, update current models, or eliminate impertinent alternatives. These external sources could be artifacts (e. g., research papers, code repositories) or human (e. g., colleagues, domain experts). For example, P2 often consults external resources before using a sniper strategy: “. . . I read a lot of papers, and then I will see which algorithm is highly referenced among those papers and can apply to a wide range of cases.” Participants also rely on their past analytic experience or domain knowledge to generate, update and reduce alternatives, as when P3, P10–12 generate new hypotheses or when P2 eliminated algorithms based on past experience: “We had a previous project about liver which used the first method. . . . It’s about 20 000 points. The first method was already time-consuming. So this time we have more than 50 000 points and a more complicated structure, so sure the first one cannot meet our requirements, so we directly used the second.”
When a problem is poorly defined or the goal is unclear, participants might employ “trail & error.” For example, P9 describes generating visualisations for clients: “We need to talk with them to understand what they mean by block, or by thing. Once we think we understood,
we write down a mathematical definition of the object, we compute it, and show it to the people and say this is what you were talking about, this geometry here. They are like yes or no.”
When working in a team, partipants might adopt a divide & conquer strategy, with each team member exploring a subset of the alternatives. For example, P5 and his teammate individually collected potential datasets. After separately filtering and clustering, they presented the clusters to their professor to decide which one to pursue. Similarly, P7 works with two other colleagues to find a model for their data collected in experiments, where each of them implemented one or more algorithms to see whether it works.
Reasoning About Alternatives often involves sub-tasks. One common task is to compare and contrast alternatives to inform evalua-tion or decision-making. Some participants would use metric guidance for this comparison, as when P3, P6–8 calculated percentage accu-racy, error rate, or deviation from a baseline. Other participants used qualitative approaches, such as making visual comparisons between alternatives (P1–2, P5, P9). Our participants expressed the need to view and compare multiple alternatives simultaneously, as was also highlighted in other studies on alternatives [15, 28, 42]. They often compared alternatives side-by-side (P1–3, P5, P7, P11), such as when comparing two program files. Others used layering (P3, P5–6, P9) and animation (P2, P6). Some alternatives exist for the sole purpose of comparison. For example, P1 created an intermediate alternative of a spreadsheet calculation that served as a link to a past version that he could use when communicating with his boss.
Reasoning also involves drawing on data workers’ past experience or domain knowledge, as when P3 and P10–12 rely on their domain knowledge to generate new hypotheses. P3, for example, would inter-pret the results of different visual trackers by inspecting their output layers in a convolutional neural network. When beyond their expertise, they might consult external resources, such as by asking doctors to make sense of different modeling results or consulting data providers to better understand data features.
Reasoning is harder when facing a large scale of alternatives. Four participants needed to tackle a large number of alternatives during their analyses (P1, P3, P6, P9), ranging from hundreds of alternative graphs to thousands of data alternatives. For example, P1 analyzes graphs of hundreds of model simulations. His approach resembles the small multiples technique, where he arranges the resulting graphs in a matrix, providing an overview and allowing comparisons. He describes, “We have pictures of more than 80 cartographies, with different parameters. We save them as pictures to Powerpoint, like a list of images or matrix. At that moment we can start looking at them, to analyze the change of parameters and the impacts, what changes, why it changes, when it changes, changes how.”P6, instead, uses an optimisation algorithm to narrow the solution space before focusing on specific simulations.
Managing Alternatives Participants managed alternatives either informally via annotations, using folder systems, or via dedicated versioning tools such as Git or Microsoft TFS. Often, however, they used a combination of methods and tools. Some distinguish alternatives management at different abstraction layers. For example, P2 records different interpretations in her notebooks, saves parameter trails in spreadsheets to facilitate future analyses, and uses TFS to collaborate with colleagues. P6 saved all generated multiples in one place and moved promising options to a separate folder. Four users felt tension between exploration and management, as P11 struggled, “if I’m in the mode of exploring, I really don’t want to lose time in making things clean. . . .”Two participants performed post-hoc cleanup, while another tried to balance generating alternatives with maintaining a cleaner record of those explored. Another admitted to rarely cleaning up: “I want to go and clean it up afterwards, so that I can share it with other people. It’s kind of my responsibility to do it afterwards, but I don’t do it, in theory you can easily delete a cell, but I don’t do it”(P7).
4.5 The Role of Expertise
Our participants have diverse levels of computational expertise and domain knowledge; they play different roles within their broader
organ-isational contexts. These different types of expertise may influence both the kinds of alternatives data workers tend to consider during analysis and the various coping strategies they generally deploy.
Expertise and Types of Alternatives We found that participants with strong domain knowledge (≥ 3) tend to mention cognitive alterna-tives more often than participants with less domain expertise. As such, the group with more domain expertise (mDomainExperts) describes many alternative cognitive hypotheses, whereas the group with more programming expertise (mHackers) focuses on other types of alterna-tives, such as models—e. g., to test the cognitive hypotheses provided by domain experts. Participants P4, P10, P12 (group mDomainExperts) did not handle any type of model alternatives during their analyses. This could be attributed to a lack of computational skill (≤ 2) or to the type of analysis they engage in, often qualitative in nature (P10, P12). We found that data and tool alternatives are common in both groups. However, participants who work in research organisations tend to ex-plore more tool alternatives than participants who work in an enterprise. This could be because data workers in industry may be required to use the same analysis tools as their colleagues to facilitate collaboration and the exchange of results. Although mHackers may face lower barriers to trying out different tools, they tend to stick to a small set of familiar tools (or programming frameworks), such as Python and Matlab.
Expertise and Coping Strategies We found that the mHackers group consulted external resources the most. They are often in close contact with domain experts or data providers/consumers as they gener-ate, reason about, and reduce alternatives. Indeed, due to their limited domain knowledge, they tended to seek feedback from third parties to help them better understand data features and relationships and to evaluate the models they built.
The mDomainExperts group, on the other hand, mainly tended to draw on their own domain knowledge to make decisions, but they also consulted experts from other domains. P10, for example, a humanitar-ian researcher, consulted computer scientists to gain deeper insight into the technologies at play. We also saw that the mDomainExperts group tends to evaluate alternatives qualitatively, whereas mHackers tend to lean toward more quantitative evaluations. Both groups, however, widely used the “trial and error” and “draw on experience” strategies.
5 ALTERNATIVESFRAMEWORK
In Section 4, we present our findings on our participants’ data analysis practices around alternatives. These findings characterize alternatives based on three primary dimensions: 1) degree of attention, 2) level of abstraction, and 3) processes on alternatives. Together, these di-mensions form our proposed framework for understanding alternatives within the sensemaking process.
The orthogonal combination of degree of attention with level of abstraction can help clarify the different, often conflated, notions of al-ternatives in sensemaking activities. The third dimension describes the processes around these different kinds of alternative. This framework thus aims to enrich the vocabulary used to describe alternatives.
In the remainder of this section, we apply this framework to four data analysis systems drawn from the literature. We chose the first two systems—Variolite [24] and LitVis [43]—because they seem concep-tually similar: both explicitly address non-linear, branching processes involved in data science coding activities. The framework’s dimensions can help reveal the different kinds of alternatives they address.
Variolite integrates version tracking/history logging similar in con-cept to Git directly into the code editing environment [24]. It introduces the conceptual concept of code variants, where the user creates alternate implementations directly in the code editing environment—for example to use a “strict matching” vs. a “fuzzy matching” implementation of a search function. These variants can be revisited through a branch map directly embedded within each variant.
In terms of degree of attention, a variant under active development is a choice, with other variants as options. As the user no longer considers certain variants, they may become multiples rather than options until the user eventually (perhaps) revisits them. As such, Variolite provides explicit support for managing these three types of alternative.
The key insight of Variolite is in the execution abstraction level, focusing on providing support for how the user can manage such al-ternatives directly within the coding environment and reducing the interactive friction involved. Rather than managing chronological ver-sions of a whole project, the user explores these alternatives and their combinations directly in the interface through explicit support for the execution-oriented processes: generating, updating, reducing, and aging alternatives. Variolite reduces the friction involved in the man-agement of these execution and code artifact alternatives so that more cognitive resources can be devoted to the cognitive aspects of the task, beyond the scope of the system.
LitVis also provides explicit support for alternatives in a code edit-ing environment, focusedit-ing on the concept of design expositions rather than code variants in the context of a literate visualisation computational notebook [43]. Instead of creating alternatives in a single document as in Variolite, in LitVis a user generates alternatives by adding a new parallel “branch.” Each branch is a single file which can be referenced in the root file and can further diverge into subbranches by referenc-ing to other files, which together form a document tree structure. As the user’s attention shifts in the analysis processes, the role of these branches can move along multiples, options, and choices. Alternatives can arise at a more fine-grained level—for example, a single branch can contain many code blocks, each of which can render a different visualisation with various encodings or take different data as input.
LitVis also introduces “narrative schemas,” which drive visualisation designers to reflect on and share each design’s rationale, reifying these cognitive alternatives in the system design. For example, by applying the Socratic questioning schema, users answer questions such as “What would you do differently if you were to start the project again?”
In terms of the alternatives framework, both systems thus provide explicit support for multiples, options, and choices. Variolite focuses primarily on the execution abstraction level, leaving cognitive alterna-tives beyond the direct scope of the system. In contrast, LitVis provides more explicit support for cognitive alternatives, while providing more limited, coarser-grained support for execution-level alternatives.
Whereas the first two systems focus on code-oriented tasks, the second two systems—EvoGraphDice [5] and Aruvi [37]—both focus on interactive data exploration and modeling. These two systems address different kinds of problems, both conceptually and in terms of their fundamental relationship to alternatives.
EvoGraphDice helps users explore multidimensional datasets on a large number of alternative projections [5]. The primary alterna-tives here are different visual projections. EvoGraphDice combines the automatic detection of visual features with human interpretation and focuses on the generation of new multiples as well as the transition between multiples, options, and choices. The tool first presents the user with a scatterplot matrix of potentially interesting views based on principal component analysis (PCA). In terms of degree of attention, the individual views in the scatterplot matrix are multiples, receiving only limited attention from the user. As the user explores and considers different multiples, those with meaningful or interesting visual patterns often become options. The user can select a specific view to inspect and can provide a satisfaction score to help guide the system as it uses an evolutionary algorithm to breed new candidate projections. Users iteratively repeat this process until reaching a satisfactory finding. Us-ing the notion of “frame of reference,” the user’s choice itself becomes a multiple amongst the new generation of multiples bred by the evo-lutionary algorithm. As such, EvoGraphDice is the only one of the four systems to provide explicit support for the Generation of multiples. Moreover, a “selection history” panel helps users manage insightful views by saving them as favorites (options) and revisiting previously saved configurations (making choices).
In terms of abstraction level, we find that EvoGraphDice provides limited support for alternatives at the cognitive or execution layers. The latter would seem beyond the scope of this system. For the former, the user can generate, update, test, and discard hypotheses, but the application provides little explicit support to manage them beyond saving interesting views.
Computer Graphics. The final version of this record is available at:10.1109/TVCG.2019.2934593 Aruvi aims to better support the sensemaking process during
in-teractive data exploration [37]. Of the four tools, it provides the most explicit support for all three abstraction levels. The system interface combines three views—a data view, a knowledge view, and a navigation view. The user can explore artifact and execution alternatives in the data view, such as for testing different types of visualizations and various encodings. The knowledge view supports generating and managing cognitive alternatives such as different hypotheses and mental models. It provides a flexible graphical environment where users can construct diagrams to externalize their cognitive alternatives. These cognitive artifacts can be linked with related visualizations in the data view to provide context and arguments.
During the exploration process, all changes made in the data view are captured automatically and represented as a history tree in the navi-gation view. The interdependency among artifact/execution alternatives and cognitive alternatives is partially shown on this tree, as the node which represents a specific state in the data view is marked when linked to a cognitive artifact in the knowledge view. With these three views, it is relatively easy for the user to navigate alternatives, recover contexts, and generate new ones based on existing state.
6 DISCUSSION
In this section, we discuss our main findings and framework of alter-natives in light of existing work, and we reflect on our study method before describing our study limitations.
Framework We have presented a framework for alternatives based on three dimensions: degree of attention, layer of abstraction, and processes around alternatives. Many of the alternatives we have iden-tified can be found in related studies. For example, code and data alternatives correspond to the alternative types mentioned in prior work [7, 12, 15, 18, 24, 28]. In contrast to our work, many of those studies focus on specific contexts such as computational notebooks. Our findings contribute new observations into how data workers con-sider alternatives in their daily practices and in a variety of contexts. In particular, we find an interdependency between artifact alternatives and alternatives at the cognitive and execution abstraction layers.
We also characterize alternatives based on how much attention is paid by the data worker, introducing the distinction between multiples, options, and choices. The orthogonal combination of these degrees of attention with levels of abstraction may help clarify the notion of alter-natives in data analysis and can enrich our vocabulary to describe them. Finally, our high-level processes around alternatives share similarities to Peng’s double-diamond metaphor on the data analysis process [31]. By looking at data analysis systems under this framework, we find that current analysis tools often lack or have limited support for alter-natives at the cognitive layer. Cognitive alteralter-natives are intrinsically difficult to manage, as it requires getting such tacit learning out of the head of the individual and into a form that can more easily be shared within collaborative contexts. LitVis [43] provides one solution to reduce this friction by structuring computational notebooks around narratives, but this approach may not easily transfer to other contexts. Richer capture of alternatives, especially at the cognitive level, could, however, yield more detailed case studies or VAST Challenge reports. We find that current analysis environments break the chain of alter-natives across different abstraction levels, as data workers often use a combination of tools to record alternatives at the cognitive, artifact, and execution levels. As such, these alternatives are treated as tangen-tial and independent, separate from the actual analytic process. Users must mentally manage and navigate these different alternatives across distinct tools and environments. Linking and navigating alternatives across abstraction levels and tools remains an open challenge.
At minimum, tool designers could provide more explicit support for managing data workers’ degree of attention and the non-linear, fluid nature of alternatives. Existing tools commonly treat such analyses more linearly. Moreover, many systems leave this management beyond the scope of the system, leaving data workers to create ad-hoc solutions. Finally, we find that participants frequently struggle with other chal-lenges around alternatives, such as how to evaluate them properly, how
Goals Analytic
Process Details
False Starts
Online Data Stories 3 3 — 3
Kaggle 3 3
Vast Challenges 3 —
Interviews 3 3 — 3
Table 3. Four study methods based on how they reveal: high-level analytic goals; data workers’ analytic processes; detailed descriptions on how they worked; any dead-ends encountered. Partial information is represented by a line.
to decide when to stop exploring more alternatives, or how to compare, reason about, and manage a large space of alternatives.
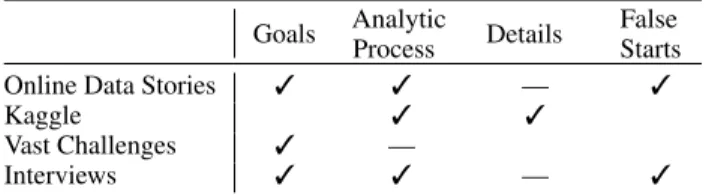
Method Before adopting the interview method for this study, we initially collected online data stories such as blogs and computational notebooks (e.g. from Kaggle and other open sources [8]), as well as from the IEEE VAST challenge reports. Although these resources are valuable to track the provenance of data analytics, they vary in terms of how much they reveal on the high-level goals of the analysis; the analy-sis processes data workers go through; the amount of detail regarding how the analysis is performed; and most important, the false starts or the dead ends encountered during analysis. Table 3 compares the four approaches we investigated: data stories, computational notebooks, reports from the IEEE VAST challenge, and interviews.
We found that data stories and blogs contain more detail about diffi-culties data workers meet during analysis, how they explore different alternatives, and how they reason about them. However, the number of high quality data stories we could find was limited. Computational notebooks combine code, visualizations, and text in a single docu-ment. Though computational notebooks are designed to support the construction and sharing of analytical reasoning, it has been shown that data workers tend to use them to explore ideas rather than to tell an explanatory story of a real world analysis scenario [36]. Similarly, the computational notebooks we collected are either personal, messy artifacts that are hard for others to understand, or cleaned versions used to share distilled findings or to teach others. VAST challenge reports explain how new techniques and visualization systems function and share findings reached using those systems. However, few or no rich details can be found on the sensemaking process (especially failed analyses). As a result, we opted for a semi-structured interview method to unpack the processes behind successful and failed analysis scenarios. Limitations With a sample size of 12 participants, we do not claim generalizability of our results. Our focus is on getting a deeper and rich analysis, rather than generalization from a larger sample size. In addition, although we did not control for expertise in this study, our study participants fell into two main categories: those with high programming skills and little domain expertise, and those with high domain expertise but little programming skills. We believe that many data workers in practice fall into those two groups. Our framework however does not assume any specific level of data work expertise.
7 CONCLUSIONS& FUTUREWORK
We have presented observations from interviews with 12 data workers from a variety of disciplines. Alternatives are present throughout the various stages of their analysis pipelines. We propose a framework based on these observations that helps clarify and characterize the role of alternatives in data work. It is based on 1) degree of attention, 2) abstraction level, and 3) analytic processes. This work provides an initial attempt to unpack the notion of alternatives in data work, but there still remain many unexplored questions. Moreover, further study using complementary methods is necessary to help reveal data workers’ true underlying practices.
ACKNOWLEDGMENTS
Funding in part by Digiscope (ANR-10-EQPX-26-01) and by Institut Mines-T´el´ecom (Futur & Ruptures project Data Expression).