HAL Id: hal-03025808
https://hal.archives-ouvertes.fr/hal-03025808
Submitted on 26 Nov 2020
HAL is a multi-disciplinary open access
archive for the deposit and dissemination of
sci-entific research documents, whether they are
pub-lished or not. The documents may come from
teaching and research institutions in France or
abroad, or from public or private research centers.
L’archive ouverte pluridisciplinaire HAL, est
destinée au dépôt et à la diffusion de documents
scientifiques de niveau recherche, publiés ou non,
émanant des établissements d’enseignement et de
recherche français ou étrangers, des laboratoires
publics ou privés.
Recovery of microalgal protein by three-steps membrane
filtration: Advancements and feasibility
I Gifuni, L Lavenant, Jeremy Pruvost, A Masse
To cite this version:
I Gifuni, L Lavenant, Jeremy Pruvost, A Masse. Recovery of microalgal protein by three-steps
mem-brane filtration: Advancements and feasibility. Algal Research - Biomass, Biofuels and Bioproducts,
Elsevier, 2020, 51, �10.1016/j.algal.2020.102082�. �hal-03025808�
Contents lists available atScienceDirect
Algal Research
journal homepage:www.elsevier.com/locate/algal
Recovery of microalgal protein by three-steps membrane filtration:
Advancements and feasibility
I. Gifuni
a, L. Lavenant
c, J. Pruvost
b, A. Masse
b,⁎aDipartimento di Ingegneria Chimica, dei Materiali e della Produzione Industriale, Università degli Studi di Napoli “Federico II”, Piazzale Tecchio, 80, Naples, Italy bGEPEA, UMR CNRS 6144, University of Nantes, 37 bd de l'Université, 44602 Saint Nazaire Cedex, France
cINRA UR1268 BIA Biopolymers Interactions & Assemblies, 44300 Nantes, France
A R T I C L E I N F O Keywords: Microalgae Chlorella Proteins Membrane filtration Costs A B S T R A C T
Microalgae are recognized as source of proteins for nutraceuticals, food additives and bioactive peptides. Also, the exploitation of the protein fraction can contribute to reach the profitability of the microalgal biorefinery. Among the available technologies, membrane filtration is one of the most sustainable and cost-effective tech-nique for the protein recovery and purification. This study proposes a three-step filtration for the recovery, the purification and the concentration of proteins extracted from microalgal biomass. The selected microalgal strain was Chlorella sorokiniana. The proposed membrane process includes: 1) Prefiltration (0.22 μm – ceramic membrane) to remove cell fragments; 2) Diafiltration (0.22 μm – ceramic membrane) to recover the proteins retained in the first step; 3) Concentration (3 kDa – ceramic membrane) to concentrate the proteins and wash out salts and small sugars. The overall filtration process allowed the recovery of 12% of the initial proteins. The resulting proteins are uncoloured which suggests interesting industrial application. The reproducibility of the process was demonstrated by three different replicates. Finally, different strategies, for improving the economic viability of the refinery chain, have been proposed and discussed in the article.
1. Introduction
Microalgae are widely studied as sources of renewable feedstock for food and energy production [1,2]. The biorefinery approach for the valorisation of several microalgal components, remains the most ac-credited solution to reduce the costs and drive investments. The feasi-bility to refine the biomass has to be proved from a technical as well as economic point of view. As already seen, the biorefinery should allow the recovery of most of the microalgal components without causing harm to the other fraction [3]. Then, mild and low-cost techniques are advisable.
Membrane filtration is one of the techniques widely applied in several industrial fields, from the desalinization and purification of the water to the recovery of high value and fragile compounds [4–6]. No chemical addition is needed and the operating conditions (temperature, shear stress) are relatively soft. The membrane filtration is already used at large scale and it constitutes a mature technology. Membrane fil-tration was investigated, for example, for TAG (Triacylglycerol) se-paration [7,8], phycoerythrin and polysaccharides purification, toxins and proteins recovery [9–11]. The membrane filtration can be con-sidered as one of the best techniques preserving the functional and
nutritional properties of the proteins [12] and it was also proved to remove or reduce the strong chlorophyll colour and taste [13]. The proteins recovery by membrane filtration generally occurs after the microalgal cells disruption. The latter is also a crucial step which in-fluences the recovery yield and the degradation of the proteins. Safi et al. [14] demonstrates that the best compromise between the quantity of proteins released and the quality of the proteins is ensured by me-chanical disruption method, such as bead milling.
The separation of the microalgal components from the whole bead milling lysate was tested by Safi et al. [15]. They proposed a strategy of two-step membrane filtration for the separation of microalgal compo-nents. They used 100 kDa and 10 kDa polyethersulfone membranes for the separation of a model suspension reproducing cells lysate of T.
suecica. Some proteins were lost after filtrations and chlorophyll was
poorly separated from proteins. Moreover, fouling seemed to be im-portant for all the pressure tested (0.69–2.07 bar). The approach seemed interesting and merit to be pursued in order to reduce the loss of proteins as well as the fouling. Other authors worked on proteins separation from microalgal lysate after centrifugation focusing also on the characterization of the recovered proteins [12,16]. These studies demonstrated that the separation process and their operating conditions
https://doi.org/10.1016/j.algal.2020.102082
Received 25 May 2020; Received in revised form 8 September 2020; Accepted 8 September 2020
⁎Corresponding author.
E-mail address:anthony.masse@univ-nantes.fr(A. Masse).
Available online 22 September 2020
2211-9264/ © 2020 Elsevier B.V. All rights reserved.
not only influence the recovery yield of proteins, but also the proteins quality (especially the emulsifying property). In particular, the emul-sifying activity was attributed to soluble fraction of the microalgal protein.
Safi et al. [10] proposed another strategy composed of disruption and centrifugation steps followed by membrane filtration and diafil-tration for the recovery of soluble proteins from N. gaditana. Three different membranes cut off, 300, 500 and 1000 kDa were tested to identify the optimal cut off for recovering proteins in the permeate. The best performances for proteins recovery and fouling mitigation were observed for 300 kDa membrane. The fouling of the membrane is often a key issue to be resolved in view of a large-scale production. The fouling can act on the reduction of the flow rates as well as the se-lectivity/retention of the process and it is largely influenced by the upstream disruption process.
Our previous work [17] optimized the bead milling disruption for the recovery of dense and insoluble particles (i.e. starch) in the pellet -after a mild centrifugation- and proteins in the supernatant. This strategy aimed to valorise the entire biomass. The present study focuses on the recovery of the proteins from the supernatant by membrane filtration. The membrane filtration process was designed in three steps: prefiltration (concentration mode) and diafiltration on 0.22 μm mem-brane then concentration on 3 kDa memmem-brane in order to retain cells debris, increase the transmission of proteins through the membrane, and concentrate the proteins, respectively. The repartition of sugars and chlorophyll during the filtration steps was also analysed.
2. Material and methods
The experimental work covered the entire production chain form the cultivation of the microalgal strain to the protein purification, the biochemical analysis of the fractions obtained and the analysis of the process performances.
The work comprises: 1) the cultivation of the microalga in a pho-tobioreactor (PBR) and harvesting in continuous mode, 2) the disrup-tion of the microalgal biomass by bead milling, 3) the centrifugadisrup-tion of the disrupted biomass for the separation of big and dense particles in the pellet; 4) Analysis of the supernatant features for the design of the filtration step; 5) three-step membrane filtration for the recovery, purification and concentration of proteins in the supernatant; 6) bio-chemical characterization of the filtration samples and filtration pro-ducts.
2.1. Microalgal culture
The green microalga Chlorella sorokiniana was cultivated in con-tinuous mode in a 5 L flat panel PBR using modified BBM medium [18]. About 2 L of biomass, with a concentration of 1 g L−1were harvested every 24 h and directly processed in bead milling for cell disruption, without previous concentration.
2.2. Cell disruption for proteins extraction
The inlet of the bead milling was the untreated culture at biomass concentration of 1 g L−1. Disruption was performed in Dyno-mill multi
lab from Willy A Bachofen AG (Muttenz, Switzerland). The temperature
was maintained at 20 °C, the flow rate was set at 200 mL min−1and the filling ratio of the grinding media at 80%.The bead milling operated in continuous mode as described by [18]. The bead milling conditions have been selected in the previous study [17]. In particular, for the microalgal strain used in this study, glass beads of 0.6 mm were se-lected, and the rotational speed of the milling motor was fixed at 14 m s−1. Based of the disruption kinetic reported in the previous study, a residence time of 4 min was used to reach 90% of cell dis-ruption.
2.3. Centrifugation for preliminary clarification
The disrupted biomass suspension was centrifuged for 5 min at 2500g by Sorvall™ LYNX 6000 superspeed centrifuge, (Thermo Scientific,
US), in order to recover most of the starch and insoluble particles in the
pellet. The supernatant was collected for 3 days before to reach enough volume to perform filtration experiment (7 L). To preserve the proteins during the storage, the supernatant was heated at 60 °C for 1 min for protease inactivation, then 0.02% m/v of sodium azide was added for inhibition of bacterial growth. Three batch of supernatant were pro-duced in order to carry out the membrane filtration on three biological replicates and demonstrate the reproducibility of the process.
2.4. Preliminary analysis of the supernatant: DLS and SDS-PAGE
The supernatant produced by disruption and centrifugation was analysed for particles and protein size to define rationally the choice of the membrane cut off. The dynamic light scattering (DLS) was used to measure the size distribution of the particles suspended in the super-natant. The supernatant sample was measured without treatment and after filtration with 0.8, 0.45 and 0.22 μm cellulose filter. The pre-liminary filtration, with cellulose filter, allow to reduce the inter-ferences and to have a clearer signal by the instrument. The proteins present in the supernatant were analysed by SDS-PAGE in order to determine the molecular mass of the soluble proteins under denaturing conditions. The SDS_PAGE protocol followed [19]. 20 μL of protein solution were loaded on 10% SDS gel. Protein standard (26614 Thermo
Scientific) was used as marker of molecular weight. The gel was stained
overnight using Comassi Brilliant blue R250. The de-staining was car-ried out with distilled water. DLS and SDS-PAGE were also performed on the final products of the filtration: permeate and retentate of the three steps.
2.5. Membrane filtration process 2.5.1. Description of the equipment
Membrane filtration was performed on a pilot-scale equipment:
Microlab40 pilot plant by VMA Industries (France), already described in
[20]. The filtration plant was equipped by tubular ceramic membranes
Inside CeRAM, Cell 60, 7 channels from TAMI Industries (France)
char-acterized by a surface area of 0.032 m2. Two different membrane were used: MWCO of 0.22 μm for microfiltration and MWCO of 3 kDa for ultrafiltration. The water permeability of the selected membrane was 140 ± 12 and 16 ± 3 L h−1m−2bar−1for the 0.22 μm and 3 kDa, respectively.
2.5.2. Description of the process
The membrane process for the protein recovery was composed of three steps operated as showed in theFig. 1:
1) Prefiltration with 0.22 μm membrane. It was aimed to remove the cell fragments and retain them in the retentate while the proteins passed through the membrane. The final volume reduction factor was equal to about 10 (initial volume 7 L).
2) Diafiltration of the retentate of the step 1 with 0.22 μm membrane. In this step, 6 dia-volumes of demineralized water were added for recovering residual proteins from the retentate. Prefiltration and diafiltration steps on the 0.22 μm membrane were consecutives meaning no washing step was carried out between prefiltration and diafiltration.
3) Concentration of the protein rich permeates produced in the step 1 and 2, with a 3 kDa membrane. Here, the permeates of the previous two steps were mixed and concentrated 10 folds (initial volume of 8 L).
I. Gifuni, et al. Algal Research 51 (2020) 102082
2.5.3. Description of the operating conditions
The filtration was carried out at 20 °C by means of a cooling system connected to the pilot plant. The transmembrane pressure (TMP) was 2–5 bar, which corresponds to the minimal operating pressure for the Microlab40 in microfiltration and ultrafiltration mode. The recircula-tion flow rate was fixed at 250 L h−1, that means a crossflow velocity inside the channel lumen equal to 2.5 m s−1. The duration of each filtration step varied between 2 and 5 h as function of the feed volume. Every 20 min the permeate flux was measured and a permeate sample was collected for the biochemical analysis.
After each trial, the membranes were washed with 5 L of demi-neralized water at room temperature, 2 L of water at 50 °C and 2 L of NaOH (15 g L−1, pH = 12) and flushed with demineralized water at 20 °C until the pH of the permeate was equal to the demineralized water pH. Then, the water permeability of the membrane was measured. A new filtration experiment was conducted only if at least 80% of the initial permeability was recovered after cleaning.
2.5.4. Calculations
Permeate flux (J) during the filtration was calculated according to the following equation:
= × J V t A permeate filtration (1)
The volume of permeate (Vpermeate) was reported in L; ∆t is the time
necessary to collect the permeate volume (h); Afiltrationis the filtration
area (m2).
The permeate flux will be reported as function of the volume re-duction factor (VRF). VRF is defined as:
= VRF V
Vretent te 0
a (2)
where V0is the initial volume of the supernatant to be treated (L) and
Vretentateis the volume of the retentate in the feed tank at the instant of
the sampling.
During a concentration step, the mean retention factor (TR) of the proteins was calculated by the following equation:
=
Cr C VRF0 TR (3)
Here, Cris the protein concentration in the retentate (g L−1), C0is the protein concentration in the initial feed solution (g L−1), and VRF is the volume reduction factor. It is worth noting that TR can change during the filtration. We reported the TR corresponding to the mean retention rate during the operations.
For the diafiltration step, the relative flux and the number of dia-volume are considered. The relative flux (J/J0) is defined as the ratio between permeate flux of the diafiltration and the permeate flux at the end of the prefiltration step.
The number of dia-volume (DV) is the relative volume of deminer-alized water added (Vwater) during the process with respect to the initial
volume in the feed tank (Vr):
= DV V
V
water
r (4)
The protein yield or protein recovery rate (Y) was calculated in-dependently for the three filtration steps and for the entire filtration process: = Y C V C V prefiltration p p 1 1 0 0 = Y C V C V diafiltration p p r r 2 2 1 1 = + + Y C V C V concentration r r 3 3 1 2 1 2 = Y C V C V tot r r 3 3 0 0 (5)
Here, C and V represent the protein concentration and the volume respectively (g L−1; L). The subscript i; f; p; r refers to the initial and final solution, the permeate and the retentate. The superscript 1; 2; 3 refers respectively to the prefiltration, diafiltration and concentration steps; 1 + 2 for the solution resulting from the mixing of the permeates from the prefiltration and diafiltration steps. The protein yield of the full process is reported as Ytot.
2.6. Quantification of proteins, sugars, and chlorophyll
Protein concentration was quantified using BCA kit assay by Thermo
Scientific. The quantification of the proteins was performed on the
sample before the filtration, for the samples collected during the fil-trations and in the final permeate and retentate recovered for the three filtration steps. The sensitivity of the method allows detecting proteins from 0.05 to 1 g L−1. Samples that were more concentrated were op-portunely diluted. The analysis was performed in duplicates for each sample collected.
Sugars and chlorophyll were assayed in the initial supernatant and in the final permeate and retentate of each filtration step to have an indication of the repartition of these molecules during the filtration. Sugars were quantified by Dubois's method. Pigments were assayed according to the protocol reported by Safi et al. [15]. Chlorophyll and carotenoids concentration were determined using the equations already reported in [21]. The analysis were performed in duplicates for each sample collected.
2.7. Statistical analysis
The membrane filtration tests were conducted on three biological replicates. The three different biological replicates were presented on the same plot with the aim to show the reduced variability and the robustness of the process. The biochemical analysis were conducted in duplicates and the standard deviation between the analytical dupli-cated was calculated using Statgraphics Sigma Express.
3. Results and discussion
The analysis of the results is focused on the filtration process since the cell disruption, proteins extraction and centrifugation have been deeply discussed in our previous paper [17]. The previous work showed that, for a limited energy input in the bead milling followed by mild centrifugation, important amount of metabolites are recovered in the supernatant in the form of micro-particles. In such microparticles even non soluble proteins and pigments are put in suspension in the liquid phase. This phenomenon allows the recovery of 80% of the total pro-teins in the supernatant and 75% of the initial pigments. Then mem-brane filtration was applied to purify the proteins recovered in the supernatant.
The choice of the membrane cut off for prefiltration and con-centration step (Fig. 1) has been made on the basis of a preliminary DLS and SDS analysis of particles and proteins present in the supernatant.
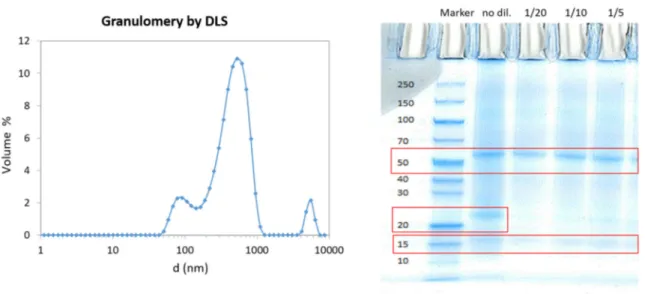
The mean particle diameter, detected by DLS, was about 0.6 μm. The proteins detected by the SDS-PAGE have a size between 55 and 15 kDa, as highlighted by the red square inFig. 2. A light band around 25 kDa is only detectable in the no diluted sample. Similar results were already found by [12,13]. The highlighted bands correspond to subunit of Rubisco (55 and 15 kDa) and other proteins involved in the photo-synthesis.
Then, the MWCO selected for the prefiltration step was 0.22 μm: 3 times less than the particles detected by DLS. Such MWCO ensures the retention of the particles and helps the purification of the soluble proteins.
The MWCO selected for the ultrafiltration step was 3 kDa: more than 3 times lower than the smallest detected proteins (15 kDa). This MWCO has been chosen to retain most of the proteins.
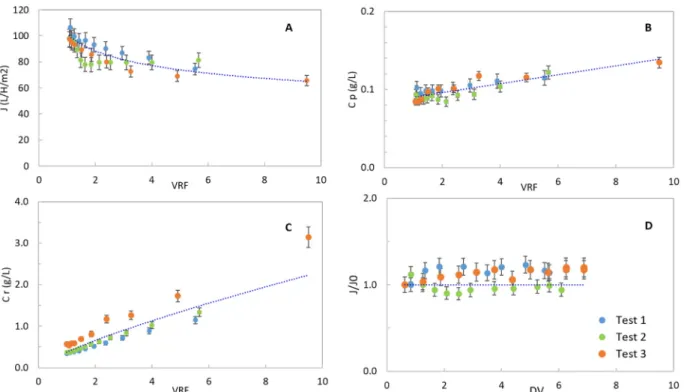
3.1. Prefiltration
In theFig. 3, the results of the prefiltration step are reported. In particular, theFig. 3.A shows the permeate flux as function of the VRF. The permeate flux of the test 2 was not registered. The permeate flux decreases slowly with the VRF and it attains an almost constant value of 70 L m−2h−1from VRF of 6.The values of the permeate fluxes here reported are considered in line with the current microfiltration process involving proteins, like milk filtration [22]. In theFig. 3.B the con-centration of proteins in the retentate is reported. The relationship between protein concentration and the VRF follows a power law, re-ported in the Eq.(3). The exponent represents the mean retention rate of the proteins (TR). It was estimated to be equal to 0.78. The con-centration of the proteins recovered in the permeate slightly increases during the prefiltration step. The retention rate varied from the be-ginning to the end of the filtration from 0.71 to 0.88 respectively (Fig. 3.C). The final recovery yield of this step was 23 ± 5%. The retention of a part of proteins could find explanation in different hy-pothesis. I) A fouling (cake, adsorption, pore blocking), formed by the components of the supernatant, is established and it limits the trans-mission of proteins through the membrane. II) The proteins released in the supernatant after the disruption are still linked to small cell debris that cannot pass through the membrane. III) The protocol for the sto-rage (heating at 60 °C for 1 min) or the stosto-rage itself (10 days at 4 °C) causes aggregations protein-protein or protein-debris and the final size of the aggregate cannot pass through the 0.22 μm membrane. IV) proteins can be adsorbed on membrane, pipes, valves, etc. of the pilot plant.
3.2. Diafiltration
TheFig. 3.D shows the permeate flux during the dialfiltration step. Around seven dia-volumes (DV) were added. The goal of the diafiltra-tion is to continue the transmission of proteins through the 0.22 μm membrane. Indeed, it seems not acceptable to lose too much protein during the concentration and purification chain. The permeate flux was almost constant during the diafliltration, while the protein concentra-tion within the permeate decreases from 0.05 g L−1at the beginning of the test, to 0.01 g L−1after 5 DV (results not shown). The quantity of proteins recovered for each diavolume of water added was also calcu-lated (data not showed). After 3 DV, no relevant increase of the
Fig. 2. The volume distribution of the particles in the supernatant (filtration feed) on the left. Gel electrophoresis of the proteins in the supernatant, under denaturing
conditions, on the right. Red squares on the gel highlight the bands corresponding to the detected proteins. (For interpretation of the references to colour in this figure legend, the reader is referred to the web version of this article.)
I. Gifuni, et al. Algal Research 51 (2020) 102082
protein's recovery was found. The proteins recovery rate of the diafil-tration was equal to 14 ± 3%. These results are comparable with that obtained by Safi et al. [10] using high-pressure disrupter (16, 10, 4% with 300, 500 and 100 kDa membrane).
3.3. Concentration
TheFig. 4reports the monitored parameters of the concentration step. TheFig. 4.A shows the trend of the permeate flux (J) along the VRF. The flux decreases of about 15% at the VRF of 2, then it remains constant until the end of the process. Low deviation is noted among the three different tests performed. TheFig. 4.B shows the increase of the protein concentration in the retentate (Cr) as the VRF increases. The mean retention factor (TR) is 0.91 then, most of the proteins are re-tained. Anyway, the proteins yield in the concentrate was 54 ± 3%, while 31% of the proteins are recovered in the permeate. A proteins loss
of 15 ± 2% was calculated, probably due to the dead volume of the filtration plant and/or adsorption on the membrane surface. According to the protein size reported in theFig. 2, almost complete retention of the proteins was expected in the concentration step. The loss of proteins in the permeate fraction could be associated to degradation into small peptides during the storage and the membrane process.
3.4. Process performance
The characterization of the permeate and retentate of each filtration step has been carried out in order to assess the process efficiency. In the
Table 1, the mass balance and the composition of each fraction are reported. Thus, the amount of sugars that could not be separated from the proteins is an important information, as well as the content of chlorophyll that gives to the protein isolate a green colour. We can notice that the chlorophyll is removed with the prefiltration/
Fig. 3. Prefiltration results about A) permeate flux (J, L h−1m−2); B) protein concentration in the permeate (Cp, g L−1); C) protein concentration in the retentate (Cr,
g L−1) as function of the volume reduction factor (VRF); D) Diafiltration step, J/J
0is reported as function of the dia-volumes added (DV). NOTE: In this graphs, Cp
and Cr is referred to the protein concentration in the permeate and retentate of the single sample at defined VRF. Blue dotted curves report the mean trend of J, Cp, Cr and J/J0 according to the mathematical model fitting the 3 biological replicates (n = 3: Test 1,2,3). (For interpretation of the references to colour in this figure legend, the reader is referred to the web version of this article.)
Fig. 4. A) The permeate flux (J) and B) the protein concentration in the retentate (Cr) along the volume reduction factor (VRF) for the concentration step (3 kDa
membrane). Blue dotted curves report the mean trend of J and Cr according to the mathematical model fitting the 3 biological replicates (n = 3:Test 1,2,3). (For interpretation of the references to colour in this figure legend, the reader is referred to the web version of this article.)
diafiltration steps and uncoloured permeate solution is obtained after the first two steps. This is a promising result, since the green colour is not desirable for all the food-applications. Similar separation was ob-tained by Safi et al. [15] by ultrafiltration (100 kDa). In this study the retention of the chlorophyll was obtained by a microfiltration step (0.1 μm) probably because of c the storage protocol. In fact, the heating could cause aggregation of the chlorophyll complex to other molecules and their retention by the membrane. Otherwise, the complex chlor-ophyll-proteins can be adsorbed on the membrane. However, not only the pigments are retained but also most of the proteins (as already re-ported in [23,24]). The retained proteins are reasonably structural proteins, mainly unsoluble. The sugars retained by the 0.22 μm mem-brane are probably represented by polysaccharides: little starch gran-ules that are not able to be separated in the previous centrifugation, damaged starch granules that lose their granular structure during the disruption step, other polysaccharides produced by the algae or simple sugars (mono-, di- saccharides). The sugars that are recovered in the retentate of the concentration step (on 3 kDa) are probably part of glycoproteins or oligosaccharides, while the sugars of permeate are mainly simple soluble sugars. The final yield of protein recovery after the entire filtration process was 12 ± 3%, which is in line with other studies focused on the recovery of soluble proteins from microalgae [10,23,24]. Even if the low yield seems to be strongly influenced by the storage protocol, these results are preliminary and fundamental for the effective integration of the membrane filtration in the microalgal biorefinery. It gives many starting points for further tests and the in-troduction of a storage protocol is not far from the reality. Indeed, many times the microalgal production platform is not localized near the processing platform. Then logistic problem forces the use of a storage strategy. The results of this study suggest that many factors should be considered when delicate molecules, such as proteins, want to be re-covered. Furthermore, in deep analysis of molecules size, molecules-molecules interaction and target molecules-molecules activity during the biomass processing should be performed for the achievement of the biorefinery concept.
Additional studies are required for the optimisation of the mem-brane material, molecular weight cut off and operating condition of the filtration plant (pressure, velocity). Nevertheless, based on the permeate flux values during each step as well as retention perfor-mances, the use of three step membrane filtration remains relevant.
It should be noted that, in this study, special attention was payed to the process repeatability. To the author knowledge, experimental tri-plicates in this field are not common and the variability raises doubt among scientist and manufacturer about the reproducibility of the mi-croalgal fractionation.
Here, the same filtration experiment was carried out three times using different batches of supernatant (feed) coming from different cell disruption and centrifugation tests. The reproducibility of the flow rate and the proteins recovery yield demonstrates the robustness of mem-brane filtration technologies and supports its application in
industrialization of the microalgal biorefinery. Ceramic membranes showed the ability of recovering their permeability after contact (and/ or adsorption) of organic materials such as microalgal cell debris.
3.5. Analysis of the operative costs of the three-steps membrane filtration
The results of this research study refer to a lab-scale equipment characterized by a working volume of 10 L and membrane filtrating area of 0.032 m2. Improved performances could be obtained, in larger scale equipment, notably in terms of energy consumption.
A preliminary analysis of the operating costs of the proposed process was carried out in this section and strategies of cost reductions were proposed and simulated.
The preliminary analysis of the costs considered a single batch of 10 L, using 0.032 m2and producing 0.5 g of proteins in 6 h (present study). The increase of the production was calculated as fold-increase of the 3 connected parameters: volume-membrane surface-protein pro-duction. Then, the increase of the plant volume to 1 m3 implies the use of 3.2 m2 of membranes and the production of 500 g of proteins each 6 h.
The main operating costs (OPEX) involved in the operation of a filtration plant are: labour costs, electricity, water, consumables (re-agents for membrane cleaning) and analytics costs (biochemical char-acterization of the obtained fractions).
Assuming the data obtained from the three-step filtration experi-ments, the operating time of each step was calculated. Simple excel model was built for obtaining the operating cost of a single batch. The ratio between the operating cost of the batch and the quantity of pro-teins produced per batch, gives the operating cost of the process per gram of protein produced.
The labour cost was calculated as product of the average gross-hourly wage for a technician in Europe (21 €/hour) and the overall process time per batch (including cleaning and preparation of the equipment) [25].
The electricity cost was calculated according to the power require-ment of each operation unit and the working time for a single batch. An average price of 0.14 € per kWh of electricity was considered.
The water cost was also calculated as the amount of water required for the preparation and the cleaning of the filtration plant, based on the laboratory experiments. The price of 4 €/m3of water was considered for the calculations (http://www.publicpolicyarchive.ie).
The consumables were considered as all the reagents for the equipment cleaning and all the disposable materials for sampling and for the protection of the operator.
Analytical costs are the costs associated to the biochemical analysis of each fraction produced. Broadly, the routine quality control and process assessment analysis of a production plant.
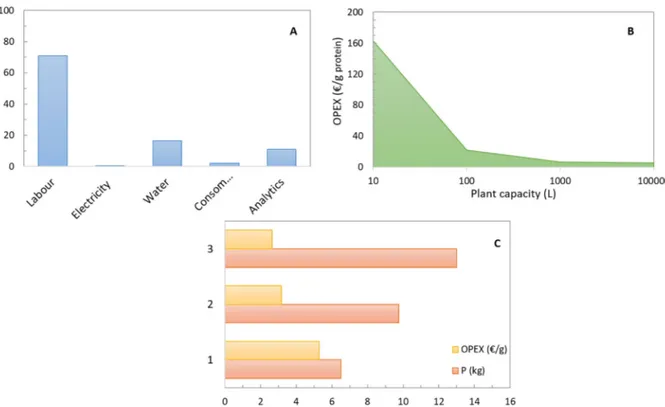
The distribution of the different operating cost, for the three-step membrane filtration, is reported in theFig. 5.A. Clearly, the main op-erating cost is the labour cost. Common strategy for labour cost
Table 1
Mass balance and composition of the different fraction obtained during the 3 steps membrane filtration. The values are the results of an average of three different experiments (biological replicates, n = 3); the standard deviation between the biological replicates was ≤10%. Note that proteins lost occurs because of degradation processes and/or adsorption on the membrane surface (total proteins loss 32.8%).
Prefiltration 0.22 μm Diafiltration 0.22 μm Concentration 3 kDa
Feed (0) Retentate 1 Permeate 1 Retentate 2 Permeate 2 Retentate 3 Permeate3
Volume (L) 8 1 7 0.9 6 1 10 Proteins (g) 4.32 2.83 0.79 2.08 0.3 0.52 0.3 (g L−1) 0.54 2.83 0.12 2.31 0.05 0.52 0.03 Pigments (g) 0.22 0.21 ND 0.19 ND ND ND (g L−1) 0.03 0.21 0.21 Sugars (g) 0.92 0.58 0.34 0.47 0.11 0.10 0.19 (g L−1) 0.12 0.58 0.05 0.52 0.02 0.10 0.02 ND: not detected.
I. Gifuni, et al. Algal Research 51 (2020) 102082
reduction is automation of the production line, but in this case one single operator is considered and even automatized production requires human control. The most appropriate strategy, in this case, is the in-crease of the production volume, using the same labour power. The increase of the production volume involves the increase of the pro-duction plant capacity: bigger equipment, higher filtration area, higher energy, water, and consumable consumption. However, energy and consumables costs do not increase linearly with the scale-up.
A simulation of the production performances at increasing produc-tion volume is presented in theFig. 5.B. The power requirement for the scale-up of filtration equipment was calculated based on the advices of the filtration plant suppliers. TheFig. 5.B shows that the operating cost per gram of protein produced, suddenly decreases with the increase of the production volume and it attains a reasonably lower price from 1000 L (1 m3) filtration plant. Further reduction of the operating costs could be attained by the elimination of proteins loss during the process (7.6%, as mentioned in the previous paragraph), or by increasing the proteins solubility and then the yield of the overall process.
Accordingly, three scenarios were simulated and compared: 1) Production volume of 100 m3and protein recovery yield of 12% (as
per lab experiments)
2) Production volume of 100 m3 and elimination of the protein loss during the filtration process (32.8%, seeTable 1)
3) Production volume of 100 m3and doubling of the protein recovery yield.
The scenario 2 (reduction of protein loss) could be achieved, at industrial level by using some technical facilities: 3 filtration units working simultaneously on the 3 steps to limit the storage and filtration time; backwash to limit absorption of the proteins in the cake; con-trolled temperature in the plant for reducing proteins degradation. Indeed, proteins are especially sensible molecules which can easily lose their structure and functionality once extracted from the cells.
The scenario 3 could be achieved by improving the proteins
solubilization during the extraction step and optimizing the filtration parameters of the step 1.
The results of the proteins production per batch and the operating cost per gram of protein produced, are presented in theFig. 5.C. The operating cost could be reduced from 5.3 to 2.6 €/g if the proteins yield could be doubled. The calculated cost per gram of proteins does not claim a comparison with the current protein sources available in the market (whey, soya, pea). Here, the authors simply provide a global analysis of the operating costs for a three-steps membrane filtration and strategies for costs reduction. Moreover, beyond the mass of protein it is important to consider the functionality and activities of proteins. These kinds of proteins could exhibit particular properties, different from the soya, whey, pea proteins.
4. Conclusions
A membrane filtration chain was suggested for the recovery and the preliminary concentration of the soluble microalgal proteins. The in-tegration of the filtration strategy with the optimized disruption step and mild centrifugation, really contribute to the fulfilment of the mi-croalgal biorefinery. The hydraulic performances of the membrane fil-tration chain are promising; the fouling seems not such important and the reproducibility of the process was also demonstrated by three dif-ferent replicates. The final recovery yield of proteins was 12% and the recovered proteins were uncoloured, which is particularly appealing for food supplements application. Improvement of the recovery yield could be attained introducing additional steps, between cell disruption and membrane filtration, in order to increase the solubility of the proteins in the aqueous phase. This field is still in its infancy, but it has great po-tential. However, reasonable process design could be obtained with an in deep characterization of the structure, the size, and the interaction of the different molecules in the suspension obtained after the disruption.
Fig. 5. A) Distribution of the operating cost (OPEX) for the 3 steps membrane filtration process B). Operating cost (€/g of proteins produced) as function of the plant
volume (L). C) Proteins production (kg) and relative operating cost (€/g of produced proteins) for 3 different scenarios simulated: 1) production volume of 100 m3; 2)
Statement of informed consent
No conflicts, informed consent, or human or animal rights are ap-plicable to this study.
CRediT authorship contribution statement
- I. Gifuni: Writing Original Draft – Experimenter - L. Lavenant: Experimenter
- J. Pruvost: Supervisor
- A. Massé: Experimenter - Supervisor
Declaration of competing interest
The authors declare that they have no known competing financial interests or personal relationships that could have appeared to influ-ence the work reported in this paper.
Acknowledgements
This work was performed thanks to the contribution of the Italian “Ministero dell’Istruzione, dell’Università e della Ricerca”, which fi-nanced the scholarship, and the internal funding of the GEPEA “Laboratoire de Génie des Procédés–Environnement–Agro-alimentaire” which covered the material costs.
References
[1] M. Vanthoor-Koopmans, R.H. Wijffels, M.J. Barbosa, M.H.M. Eppink, Biorefinery of microalgae for food and fuel, Bioresour. Technol. 135 (2013) 142–149,https://doi. org/10.1016/j.biortech.2012.10.135.
[2] C. Enzing, M. Ploeg, M. Barbosa, L. Sijtsma, Microalgae-based Products for the Food and Feed Sector: An Outlook for Europe, (2014),https://doi.org/10.2791/3339. [3] I. Gifuni, A. Pollio, C. Safi, A. Marzocchella, G. Olivieri, Current bottlenecks and challenges of the microalgal biorefinery, Trends Biotechnol. 37 (2019) 242–252,
https://doi.org/10.1016/j.tibtech.2018.09.006.
[4] A. Massé, H.N. Thi, G. Roelens, P. Legentilhomme, P. Jaouen, Seawater ultra-filtration: role of particles on organic rejections and permeate fluxes, Environ. Technol. (United Kingdom) 34 (2013) 2553–2561,https://doi.org/10.1080/ 09593330.2013.777127.
[5] R. Balti, R. Le Balc’h, N. Brodu, M. Gilbert, B. Le Gouic, S. Le Gall, C. Sinquin, A. Massé, Concentration and purification of Porphyridium cruentum exopoly-saccharides by membrane filtration at various cross-flow velocities, Process Biochem. 74 (2018) 175–184,https://doi.org/10.1016/j.procbio.2018.06.021. [6] A.K. Patel, C. Laroche, A. Marcati, A.V. Ursu, S. Jubeau, L. Marchal, E. Petit,
G. Djelveh, P. Michaud, Separation and fractionation of exopolysaccharides from Porphyridium cruentum, Bioresour. Technol. 145 (2013) 345–350,https://doi.org/ 10.1016/j.biortech.2012.12.038.
[7] F. Giorno, R. Mazzei, L. Giorno, Purification of triacylglycerols for biodiesel pro-duction from Nannochloropsis microalgae by membrane technology, Bioresour. Technol. 140 (2013) 172–178,https://doi.org/10.1016/j.biortech.2013.04.073. [8] M. Gong, A. Bassi, Carotenoids from microalgae: a review of recent developments,
Biotechnol. Adv. 34 (2016) 1396–1412,https://doi.org/10.1016/j.biotechadv. 2016.10.005.
[9] F. Ba, A.V. Ursu, C. Laroche, G. Djelveh, Haematococcus pluvialis soluble proteins:
extraction, characterization, concentration/fractionation and emulsifying proper-ties, Bioresour. Technol. 200 (2016) 147–152,https://doi.org/10.1016/j.biortech. 2015.10.012.
[10] C. Safi, G. Olivieri, R.P. Campos, N. Engelen-Smit, W.J. Mulder, L.A.M. van den Broek, L. Sijtsma, Biorefinery of microalgal soluble proteins by sequential proces-sing and membrane filtration, Bioresour. Technol. 225 (2017) 151–158,https://doi. org/10.1016/j.biortech.2016.11.068.
[11] L. Zaouk, A. Massé, P. Bourseau, S. Taha, M. Rabiller-Baudry, S. Jubeau, B. Teychené, J. Pruvost, P. Jaouen, Filterability of exopolysaccharides solutions from the red microalga Porphyridium cruentum by tangential filtration on a poly-meric membrane, Environ. Technol. (United Kingdom) 41 (2020) 1167–1184,
https://doi.org/10.1080/09593330.2018.1523234.
[12] A.V. Ursu, A. Marcati, T. Sayd, V. Sante-Lhoutellier, G. Djelveh, P. Michaud, Extraction, fractionation and functional properties of proteins from the microalgae Chlorella vulgaris, Bioresour. Technol. 157 (2014) 134–139,https://doi.org/10. 1016/j.biortech.2014.01.071.
[13] A. Schwenzfeier, P.A. Wierenga, H. Gruppen, Isolation and characterization of so-luble protein from the green microalgae Tetraselmis sp, Bioresour. Technol. 102 (2011) 9121–9127,https://doi.org/10.1016/j.biortech.2011.07.046.
[14] C. Safi, A.V. Ursu, C. Laroche, B. Zebib, O. Merah, P.Y. Pontalier, C. Vaca-Garcia, Aqueous extraction of proteins from microalgae: effect of different cell disruption methods, Algal Res. 3 (2014) 61–65,https://doi.org/10.1016/j.algal.2013.12.004. [15] C. Safi, D.Z. Liu, B.H.J. Yap, G.J.O. Martin, C. Vaca-Garcia, P.Y. Pontalier, A
two-stage ultrafiltration process for separating multiple components of Tetraselmis suecica after cell disruption, J. Appl. Phycol. 26 (2014) 2379–2387,https://doi. org/10.1007/s10811-014-0271-0.
[16] A. Schwenzfeier, P.A. Wierenga, M.H.M. Eppink, H. Gruppen, Effect of charged polysaccharides on the techno-functional properties of fractions obtained from algae soluble protein isolate, Food Hydrocoll. (2014),https://doi.org/10.1016/j. foodhyd.2013.07.019.
[17] T.R. Zinkoné, I. Gifuni, L. Lavenant, J. Pruvost, L. Marchal, Bead milling disruption kinetics of microalgae: process modeling, optimization and application to biomo-lecules recovery from Chlorella sorokiniana, Bioresour. Technol. 267 (2018) 458–465,https://doi.org/10.1016/j.biortech.2018.07.080.
[18] R. Kandilian, T.C. Tsao, L. Pilon, Control of incident irradiance on a batch operated flat-plate photobioreactor, Chem. Eng. Sci. 119 (2014) 99–108,https://doi.org/10. 1016/j.ces.2014.07.056.
[19] S. Carfagna, G. Salbitani, V. Vona, S. Esposito, Changes in cysteine and O-acetyl-l-serine levels in the microalga Chlorella sorokiniana in response to the S-nutritional status, J. Plant Physiol. 168 (2011) 2188–2195,https://doi.org/10.1016/j.jplph. 2011.07.012.
[20] C. Denis, A. Massé, J. Fleurence, P. Jaouen, Concentration and Pre-purification With Ultrafiltration of a R-phycoerythrin Solution Extracted From Macro-algae Grateloupia Turuturu: Process Definition and Up-scaling, vol. 69, (2009), pp. 37–42,https://doi.org/10.1016/j.seppur.2009.06.017.
[21] J. Pruvost, G. Van Vooren, B. Le Gouic, A. Couzinet-Mossion, J. Legrand, Systematic investigation of biomass and lipid productivity by microalgae in photobioreactors for biodiesel application, Bioresour. Technol. 102 (2011) 150–158,https://doi.org/ 10.1016/j.biortech.2010.06.153.
[22] O. Al-Akoum, L. Ding, R. Chotard-Ghodsnia, M.Y. Jaffrin, G. Gésan-Guiziou, Casein micelles separation from skimmed milk using a VSEP dynamic filtration module, Desalination 144 (2002) 325–330,https://doi.org/10.1016/S0011-9164(02) 00337-5.
[23] E. Suarez Garcia, J.v. Leeuwen, C. Safi, L. Sijtsma, M.H.M. Eppink, R.H. Wijffels, C. van den Berg, Selective and energy efficient extraction of functional proteins from microalgae for food applications, Bioresour. Technol. 268 (2018) 197–203,
https://doi.org/10.1016/j.biortech.2018.07.131.
[24] E.S. Garcia, J.J.A. Van Leeuwen, C. Safi, L. Sijtsma, L.A.M. Van Den Broek, M.H.M. Eppink, R.H. Wijffels, C. Van Den Berg, Techno-functional properties of crude extracts from the green microalga Tetraselmis suecica, J. Agric. Food Chem. 66 (2018) 7831–7838,https://doi.org/10.1021/acs.jafc.8b01884.
[25] G. Olivieri, T. Guida, P. Salatino, A. Marzocchella, A Techno-economic Analysis of Biodiesel Production From Microalgae, vol. 12, (2013), pp. 1563–1573.
I. Gifuni, et al. Algal Research 51 (2020) 102082