Publisher’s version / Version de l'éditeur:
ICCM International Conferences on Composite Materials, 2009
READ THESE TERMS AND CONDITIONS CAREFULLY BEFORE USING THIS WEBSITE.
https://nrc-publications.canada.ca/eng/copyright
Vous avez des questions? Nous pouvons vous aider. Pour communiquer directement avec un auteur, consultez la première page de la revue dans laquelle son article a été publié afin de trouver ses coordonnées. Si vous n’arrivez pas à les repérer, communiquez avec nous à [email protected].
Questions? Contact the NRC Publications Archive team at
[email protected]. If you wish to email the authors directly, please see the first page of the publication for their contact information.
NRC Publications Archive
Archives des publications du CNRC
This publication could be one of several versions: author’s original, accepted manuscript or the publisher’s version. / La version de cette publication peut être l’une des suivantes : la version prépublication de l’auteur, la version acceptée du manuscrit ou la version de l’éditeur.
Access and use of this website and the material on it are subject to the Terms and Conditions set forth at
Cure cycle optimisation for composite panels fabricated by RTM using
dielectric sensors
Chen, J. H.; Octeau, M. A.; Hojjati, M.; Yousefpour, A.
https://publications-cnrc.canada.ca/fra/droits
L’accès à ce site Web et l’utilisation de son contenu sont assujettis aux conditions présentées dans le site LISEZ CES CONDITIONS ATTENTIVEMENT AVANT D’UTILISER CE SITE WEB.
NRC Publications Record / Notice d'Archives des publications de CNRC: https://nrc-publications.canada.ca/eng/view/object/?id=42b75457-6f32-494f-9f03-70f6718f0a15 https://publications-cnrc.canada.ca/fra/voir/objet/?id=42b75457-6f32-494f-9f03-70f6718f0a15
J. H. Chen*, M. A. Octeau, M. Hojjati and A. Yousefpour National Research Council Canada
Institute for Aerospace Research Aerospace Manufacturing Technology Center 5145 Avenue Decelles, Montréal, Québec, Canada, H3T 2B2
In this study, carbon fiber/epoxy composite flat panels were fabricated by a resin transfer molding (RTM) process. A dielectric sensor was used to monitor the curing process of these panels. In the experiment, three dielectric cure monitoring tests were first conducted under isothermal conditions to correlate the dielectric ionic conductivity with the degree of cure and the glass transition temperature of the epoxy resin. Then panels were fabricated using RTM process in three different scenarios: the resin was injected at three different temperatures: 100°C, 120°C and 180°C, respectively, and then cured at 180°C for about 2 hours. The degree of cure and the glass transition temperature of the composite panels were displayed by custom.made software “Cure Watch” in real time. Based on the degree of cure and glass transition temperature obtained in the experiment, the optimization of the cure cycles was suggested. DMA measurements were conducted to verify the cure monitoring results.
Dielectric on.line cure monitoring has been used for process development, quality assurance and production control of composites. To carry out dielectric cure monitoring, initially, a dielectric sensor has to contact the resin. An AC voltage is then applied between the electrodes of the sensor to create an electrical field over a range of frequencies. It is known that there are dipoles and ions present in polymer resins. Before an electric field is applied to a resin, the dipoles and ions in the resin have random orientation. After an electric field is applied, the dipoles start to get oriented and the ions begin to move towards the electrodes with opposite polarity. This movement of the dipoles and the ions is a function of resin viscosity and temperature.
It has been reported that on.line dielectric monitoring has been used in resin transfer molding process (RTM) in the past years [1.5]. It is known that RTM offers the advantage of fabricating cost effective high performance composite structures with complex shape and good surface quality. During the RTM process, a dry preform is first placed in a mould, then resin is injected into the closed mould cavity to impregnate the preform; the part is removed from the mould after a curing process. To ensure the composite part reaches its desired properties, it is important that the part is cured properly. Conventionally, composite parts are cured according to a cure cycle outlined by the materials suppliers. However, these cycles often need to be adjusted because of the particular shape or non.uniform thickness of the part being fabricated. These problems are commonly solved using trial. and.error and/or process modeling. Unfortunately, these approaches are often time consuming and labor intensive. Also, an optimal cure cycle developed by these methods does not always produce the best results because of variations in materials and operating conditions. Due to these problems, a sensor system that can monitor the curing process on. line would be very useful for RTM process.
In this study, carbon fiber/epoxy composite panels were fabricated using RTM process. On. line dielectric cure monitoring was carried out to support the RTM process development. The optimization of the cure cycles was suggested for the manufacturing of the panels based on the data obtained from the dielectric cure monitoring. DMA measurements were used to verify the dielectric cure monitoring results.
The resin system used in the experiment is the Cycom 890 RTM epoxy resin system from CYTEC Engineered Materials. It is available as a one.part resin system. The viscosity of this resin system is low enough at 80ºC (175ºF) for resin transfer molding (RTM) process. The manufacturer suggested cure cycle for the resin system is 2 hours at 180ºC for full cure. The glass transition temperature of the resin system is 190 ºC (E’ onset) for full cure and 213 ºC after postcure. The carbon fiber used in the experiment is a 5.harness satin woven fabric from Cytec Engineered Materials Inc.
! " # $ % !
DSC (Q1000, TA Instruments) was used to determine the total heat of reaction. First, DSC tests were conducted on uncured resin samples using the dynamic scanning mode at the heating rates of 2, 3, 4, 5, 8, 10, 12, 15, 20°C/min. The samples were about 10 mg and were heated from –50°C to 350°C under nitrogen atmosphere. In the measurement, 18 samples were tested. Second, a series of isothermal scanning of uncured samples was conducted at three different temperatures: 160°C, 180°C, and 200°C for different time periods (up to 5 hours). To rapidly reach the desired isothermal temperature, the samples were heated at a rate of 100°C/min. Dynamic scanning was conducted following the isothermal measurements, in order to determine the glass transition temperature ( ) and the residual
heat of reaction. Degree of cure is also calculated using the residual heat of reaction. The heating rate in these dynamic measurements was 4°C/min.
% ! # $ & ' ! &
A 10.channels dielectric sensor system, DEA 230/10, from NETZSCH Instruments was used in the study. The sensor used in the experiment is a tool.mounted sensor, which has two planar interdigitated comb electrodes placed on a flat ceramic substrate. The resin sample (about 8g) was held by the sensor surface and sealed using sealant tape. Isothermal cure of the epoxy resin samples was conducted at three different temperatures: 160°C, 180°C, and 200 °C in an oven for about 5 hours. Dielectric measurements were conducted at various frequencies, from 0.1 Hz to 10 kHz. Release agent was applied to the sensor surface to allow resin samples to be removed easily.
The ion conductivity measured by the dielectric sensor is related to the ion mobility, which is a function of the resin viscosity; therefore, the change in ion conductivity can be used as an indicator of the arrival of the resin flow front as well as the curing state of composites. To display on.line the development of and degree of cure in a composites manufacturing process, the correlations between ion conductivity and as well as degree of cure under different isothermal conditions have to be established. The equation used to correlate ion conductivity and is shown as follow [6,7]:
ϕ φ σ σ + = 0 (1)
where
σ
0 is the initial ion conductivity, which is the ion conductivity before the start of thecuring reaction;
φ
andϕ
are material parameters. Furthermore, following expression has been proposed to describe the correlation between ion conductivity and degree of cure [8]:α
λ
α
λ
λ
σ
σ
3 2 1 0 1 − + = (2) where α is degree of cure, andλ
1,λ
2, andλ
3are material parameters.( %
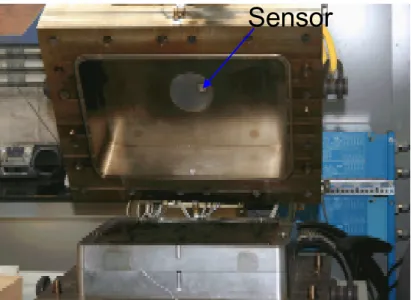
Three scenarios were tested in the RTM experiments: the resin was injected at three different temperatures: 100°C, 120°C and 180°C, respectively, then cured at 180°C for about 2 hours. A 1.inch tool.mounted dielectric sensor was mounted on the RTM mold to monitor the resin flow and cure. A flat panel preform with nine plies woven carbon fiber was prepared and put in the mold cavity. To avoid direct contact of the electrodes of the sensor with the carbon fiber preform, a small piece of woven glass fiber was used to isolate the sensor surface. The location of the dielectric sensor is shown in Figure 1. A custom. made computer program “Cure Watch” was used to transfer the dielectric data into degree of cure and the glass transition temperature and display them in real time.
Figure 1 Location of the dielectric sensor in the RTM mold
" ! ' " # $
Dynamic Mechanical Analyzer (Q800, TA Instruments) was used in the experiment to verify the cure monitoring results. The three point bending method was used to test the samples. The testing frequency was 1 Hz. The heating rate was 5°C/min. Samples were cut from the composite panel with a size of 60 x 10 mm.
) * &% + " & % , &
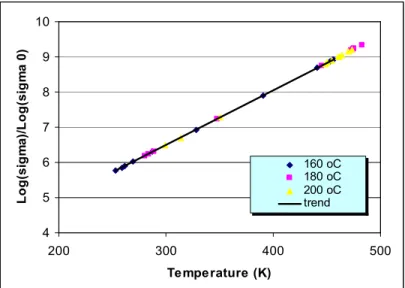
To correlate dielectric ion conductivity and curing process of the epoxy resin, degree of cure and glass transition temperatures at three isothermal temperatures were determined using DSC. First, the total heat of reaction of the epoxy resin system was measured by using dynamical DSC. The average value of the total heat of reaction obtained in all the 18 dynamic DSC measurements with different heating rates was 374.7 J/g. Second, a series of isothermal scanning of uncured samples was conducted at three different temperatures: 160°C, 180°C, and 200°C. Degree of cure and Tg at these three temperatures were calculated for different time periods (up to 5 hours). Third, a dielectric sensor was used to monitor the ion conductivity change at the above mentioned three isothermal temperatures. To simplify the data interpretation, only the ion conductivity at 1 Hz was used to correlate to the Tg, degree of cure in this study. Furthermore, to ensure the accuracy of the correlation between the Log Ion Conductivity and Tg, as well as degree of cure, temperature influence on the measured ion conductivity has been removed. The ion conductivity as a function of the glass transition temperature is shown in Figure 2. It can be seen that the correlation between the ion conductivity and the DSC measured Tg agrees
with Eqn.1 very well. The parameters in Eqn.1 are therefore obtained by fitting the experimental data: ϕ = 0.0156 and φ = 1.8105.
Figure 2
σ
/σ
as a function of (Kelvin)The correlation between ion conductivity and degree of cure is shown in Figure 3. The parameters in Eqn. 2 are determined by fitting the measured data for the CYCOM 890 RTM resin system:
λ
1= 5.4669,λ
2= 2.729, andλ
3= 0.3053. These parameters will be used in on.line cure monitoring in the non.isothermal RTM curing process. The vs. degree of cure plot measured by DSC is presented in Figure 4.Figure 4 vs. degree of cure plot measured by DSC
( %
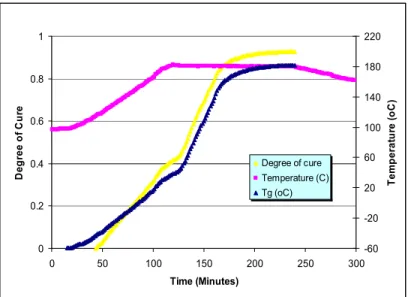
In the RTM experiments, three scenarios were tested. The resin and the mould were first heated up to the preselected temperatures: 100°C, 120°C and 180°C, respectively. Then resin was injected by applying pressure and vacuum. The injection was stopped as resin exited from the vacuum port, assuming that the preform was fully saturated. After blocking the injection port and the vacuum ports, a one.step cure cycle was conducted to cure the parts. The mould was ramped to 180°C at a rate of 0.8 °C/min and held for about two hours, and then the mould was cooled down to room temperature. The dielectric cure monitoring was conducted throughout the RTM processes. The data acquisition was actually started before the resin injection. As soon as resin reached the sensor, there was a jump in the measured ion conductivity, which can be used to detect resin flow front. Figure 5 shows the real time displayed temperature, degree of cure and in scenario 1 (injection temperature: 100°C). It can be seen in Figure 5 that the panel was not fully cured after the cure cycle was completed. The final degree of cure displayed on.line in “Cure Watch” was 0.92 and the glass transition temperature was 182oC. Figure 6 shows the temperature, degree of cure and in scenario 2 (injection temperature: 120°C). The final degree of cure displayed on.line in “Cure Watch” was 0.93 and the glass transition temperature was
189oC. Figure 7 shows the temperature, degree of cure and in scenario 3 (injection
temperature: 180°C). The final degree of cure displayed on.line in this case was 0.98 and the glass transition temperature was 206oC. From the results we can conclude that a post cure is required for the parts cured in scenario 1 and scenario 2. Since the Tg value in the data sheet was from DMA measurement, therefore, DMA tests were conducted in the experiment to verify if the panel in scenario 3 was fully cured.
! "# $ % ! $ %
Figure 5 Temperature, degree of cure and in scenario 1
! "# $ % ! $ %
! "# $ % ! $ %
Figure 7 Temperature, degree of cure and in scenario 3
" ! ' " # $
To verify the cure monitoring results, the composite panel fabricated in scenario 3 was cut and tested using DMA. Three samples were tested. The average Tg of the samples were 191 °C (E’ onset) and 214 °C (Tan Delta), conforming that the panel was fully cured. Figure 8 shows an example of the DMA results.
In this study, three carbon fiber/epoxy flat panels were fabricated using RTM process under three different scenarios: The resin was injected at three different temperatures: 100°C, 120°C and 180°C, and then cured at 180°C for about 2 hours. The development of the degree of cure and glass transition temperature in the composite panels were monitored using a dielectric sensor and displayed by “Cure Watch” software in real time. DMA tests were conducted to verify the results of the dielectric cure monitoring. Results show that the panels fabricated in scenario 1 and 2 are not fully cured, a postcure is required to reach the 100% degree of cure and the maximum glass transition temperature. The degree of cure of the panel made in scenario 3 is 0.98 and the glass transition temperature is 206 °C. The DMA test measured Tg were 191 °C (E’ onset) and 214 °C (Tan Delta), close to the maximum Tg (213oC) described in the data sheet. Therefore, no postcure is required in scenario 3.
. /
This work was performed as a part of an internal project, 46M4.I005, at the NRCC/IAR/AMTC. The authors would like to express their appreciation to Mr. G. Chouinard for the DSC and DMA measurements.
1. Kranbuehl, D.E., Kingsley, P., Hart, S., Hasko, G., Dexter, B. and Loos, A., , V15, No. 4, 299.305 (1994)
2. Kranbueh, D. E. and Loos A., Edited by T. Kruckenberg and R. Paton, Published by Chapman & Hall, London, ISBN 0412731509, 1998
3. Engelbart, R. W., Proceeding of 44th International SAMPE Symposium, V44, 1227. 1232 (1999)
4. McIlhagger, A., Brown, D. and Hill, B., Composites Part A, 31, P1373.1381 (2000) 5. Maistros, G. M., Pantelelis, N. and Kanarachos, A., Proceeding of ICCM 13, Beijing,
2001
6. J. P. Eloundou, O. Ayina, H.N.Nga, J. F. Gerard, J.P. Pascault, G.Boiteux, G.Seytre, Journal of Polymer Science, Part B, 36 2911 (1998)
7. J. P. Eloundou, European Polymer Journal, 35, 1481 (1999)
8. J. Chen and M. Hojjati, Polymer Engineering & Science, Volume 47, Issue 2, Pages 150 – 158 (2007)