HAL Id: hal-00495263
https://hal.archives-ouvertes.fr/hal-00495263
Submitted on 25 Jun 2010
HAL is a multi-disciplinary open access
archive for the deposit and dissemination of
sci-entific research documents, whether they are
pub-lished or not. The documents may come from
teaching and research institutions in France or
abroad, or from public or private research centers.
L’archive ouverte pluridisciplinaire HAL, est
destinée au dépôt et à la diffusion de documents
scientifiques de niveau recherche, publiés ou non,
émanant des établissements d’enseignement et de
recherche français ou étrangers, des laboratoires
publics ou privés.
Fatigue evaluation in maintenance and assembly
operations by digital human simulation
Liang Ma, Damien Chablat, Fouad Bennis, Wei Zhang, Bo Hu, François
Guillaume
To cite this version:
Liang Ma, Damien Chablat, Fouad Bennis, Wei Zhang, Bo Hu, et al.. Fatigue evaluation in
mainte-nance and assembly operations by digital human simulation. Virtual Reality, Springer Verlag, 2010,
14 (1), pp.339-352. �10.1007/s10055-010-0156-8�. �hal-00495263�
Noname manuscript No. (will be inserted by the editor)
Fatigue evaluation in maintenance and assembly operations by digital
human simulation
Liang MA · Damien CHABLAT · Fouad BENNIS · Wei ZHANG · Bo HU ·
Franc¸ois GUILLAUME
Abstract Virtual human techniques have been used a lot in industrial design in order to consider human factors and er-gonomics as early as possible. The physical status (the phys-ical capacity of virtual human) has been mostly treated as invariable in the current available human simulation tools, while indeed the physical capacity varies along time in an operation and the change of the physical capacity depends on the history of the work as well. Virtual Human Status is proposed in this paper in order to assess the difficulty of manual handling operations, especially from the physi-cal perspective. The decrease of the physiphysi-cal capacity be-fore and after an operation is used as an index to indicate the work difficulty. The reduction of physical strength is simulated in a theoretical approach on the basis of a fa-tigue model in which fafa-tigue resistances of different mus-cle groups were regressed from 24 existing maximum en-durance time (MET) models. A framework based on digi-tal human modeling technique is established to realize the comparison of physical status. An assembly case in airplane assembly is simulated and analyzed under the framework. The endurance time and the decrease of the joint moment strengths are simulated. The experimental result in
simu-Liang MA· Damien CHABLAT · Fouad BENNIS
Institut de Recherche en Communications et Cybern´etique de Nantes, UMR 6597 du CNRS, ´Ecole Centrale de Nantes, IRCCyN - 1, rue de la No¨e - BP 92 101 - 44321 Nantes CEDEX 03, FRANCE
Tel.:+33-02 40 37 69 58 Fax: +33-02 40 37 69 30
E-mail:{liang.ma, damien.chablat, fouad.bennis}@irccyn.ec-nantes.fr Wei ZHANG· Bo HU
Department of Industrial Engineering, Tsinghua University, 100084, Beijing, P.R.CHINA
E-mail: [email protected], [email protected] Franc¸ois GUILLAUME
EADS Innovation Works, 12, rue Pasteur - BP 76, 92152 Suresnes Cedex - FRANCE
E-mail: [email protected]
lated operations under laboratory conditions confirms the feasibility of the theoretical approach.
Keywords Virtual human simulation· muscle fatigue
model· fatigue resistance · physical fatigue evaluation ·
human status
1 Introduction
Although automation techniques have played a very impor-tant role in industry, there are still lots of operations re-quiring manual handling operations thanks to the flexibility and the dexterity of human. Some of these manual handling operations deal with relative heavy physical loads, which might result in physical fatigue in the muscles and joints, and further generate potential risks for Musculoskeletal Dis-orders (MSDs) (Li and Buckle, 1999).
In order to improve the work design, digital human mod-eling (DHM) technique has been used more and more in in-dustry taking human as the center of the work design system (Chaffin, 2002, 2007), since it benefits the validation of the workspace design, the assessment of the accessibility of an assembly design, the reduction of the production cost, and the reduction of the physical risks as well.
Several commercial available DHM tools have already been developed and integrated into computer aided design (CAD) tools, such as Jack (Badler et al, 1993), 3DSSPP (Chaffin et al, 1999), RAMSIS (Bubb et al, 2006), AnyBody (Damsgaard et al, 2006), SantosT M(VSR Research Group, 2004), etc. In general, the virtual human in those tools is modeled with a large number of degrees of freedom (DOF) to represent the joint mobility, create the cinematic chain of human, and complete the skeleton structure of human. Meanwhile, the graphical appearance of virtual human is realized by bone, muscle, skin, and cloth models from the interior to the exterior, from simple stick models to compli-cated 3D mesh models. Normally, biomechanical database
and anthropometry database are often set up to determine virtual human’s dimensional and physical properties.
The main functions of the virtual human simulation tools are posture analysis and posture prediction. These tools are capable of determining the workspace of virtual human (Yang et al, 2008), assessing the visibility and accessibility of an operation (Chedmail et al, 2003), evaluating postures (Bubb et al, 2006), etc. Conventional motion time methods (MTM) and posture analysis techniques can be integrated into vir-tual human simulation systems to assess the work efficiency (Hou et al, 2007). From the physical aspect, the moment load of each joint (e.g., 3DSSPP) and even the force of each individual muscle (e.g., AnyBody) can be determined, and the posture is predictable for reach operations (Yang et al, 2006) based on inverse kinematics and optimization meth-ods. Overall, the human motion can be simulated and an-alyzed based on the workspace information, virtual human strength information, and other aspects. However, there are still several limitations in the existing virtual human simula-tion tools.
There is no integration of physical fatigue model in most of the human simulation tools. The physical capacity is of-ten initialized as constant. For example, the joint strength is assigned as joint maximum moment strength in 3DSSPP, and the strength of each muscle is set proportional to its physiological cross section area (PSCA) in AnyBody. The physical capacity keeps constant in the simulation, and the fatigue effect along time is not considered enough. However, the change of the physical status can be experienced every-day by everyone, and different working procedures generate different fatigue effects. Furthermore, it has been reported that the motion strategy depends on the physical status, and different strategies were taken under fatigue and non-fatigue conditions (Chen, 2000; Fuller et al, 2008). Therefore, it is necessary to create a virtual human model with a variable physical status for the simulation.
Some fatigue models have been incorporated into some virtual human tools to predict the variable physical strength. For example, Wexler’s fatigue model (Ding et al, 2000) has been integrated into SantosT M(Vignes, 2004), and Giat’s fa-tigue model (Giat et al, 1993) has been integrated based on Hill’s muscle model (Hill, 1938) in the computer simulation by Komura et al (2000). However, either the muscle fatigue model has too many variables for ergonomic applications (e.g. Wexler’s model), or there is no confidential physiolog-ical principle for the fatigue decay term (Xia and Frey Law, 2008) in the previous studies. It is necessary to find a simple fatigue model interpretable in muscle physiological mecha-nism for ergonomics applications.
In addition, some assessments in those tools provide in-dexes generated by traditional evaluation methods (e.g., Rapid upper limb assessment (RULA)). Due to the intermittent record-ing procedures of the conventional posture analysis
meth-ods, the evaluation result cannot analyze the fatigue effect in details. In this case, a new fatigue evaluation tool should be developed and integrated into virtual human simulation.
In order to assess the variable human status, a prototype of a digital human modeling and simulation tool developed in OpenGL is presented in this paper. This human model-ing tool is under a virtual environment framework involvmodel-ing variable physical status on the basis of a fatigue model.
The structure of the paper is as follows. First, a vir-tual human model is introduced into the framework for pos-ture analysis based on kinematic, dynamic, biomechanical, and graphical modeling. Second, the framework is presented with a new definition called Human Status. Third, the fatigue model and fatigue resistance for different muscle groups are introduced. At last, an application case European Aeronau-tic Defence & Space (EADS) Company is assessed using this prototype tool under the framework with experimental validation.
2 Digital human modeling
2.1 Kinematic modeling of virtual human
In this study, the human body is modeled kinematically as a series of revolute joints. The Modified Denavit-Hartenberg (modified DH) notation system (Khalil and Dombre, 2002) is used to describe the movement flexibility of each joint. According to the joint function, one natural joint can be de-composed into 1 to 3 revolute joints. Each revolute joint has its rotational joint coordinate, labeled as qi, with joint limits: the upper limit qUi and the lower limit qLi. A general coordi-nate q= [q1, q2, . . . , qn] is defined to represent the kinematic chain of the skeleton.
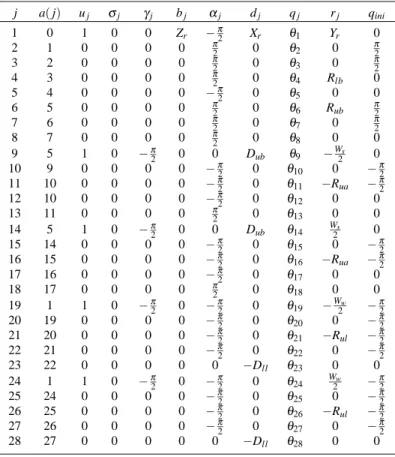
The human body is geometrically modeled by 28 rev-olute joints to represent the main movement of the human body in Fig. 1. The posture, velocity, and acceleration are expressed by the general coordinates q, ˙q, and ¨q. It is fea-sible to carry out the kinematic analysis of the virtual hu-man based on this kinematic model. By implementing in-verse kinematic algorithms, it is able to predict the posture and trajectory of the human, particularly for the end effec-tors (e.g., the hands). All the parameters for modeling the virtual human are listed in Table 1.[Xr,Yr, Zr] is the Carte-sian coordinates of the root point (the geometrical center of the pelvis) in the coordinates defined by X0Y0Z0.
The geometrical parameters of the limb are required in order to accomplish the kinematic modeling. Such informa-tion can be obtained from anthropometry database in the lit-erature. The dimensional information can also be used for the dynamic model of the virtual human. The lengths of dif-ferent segments can be calculated as a proportion of body stature H in Table 2.
Table 1 Geometric modeling parameters of the overall human body j a( j) uj σj γj bj αj dj qj rj qini 1 0 1 0 0 Zr −π2 Xr θ1 Yr 0 2 1 0 0 0 0 π2 0 θ2 0 π2 3 2 0 0 0 0 π2 0 θ3 0 π2 4 3 0 0 0 0 π2 0 θ4 Rlb 0 5 4 0 0 0 0 −π2 0 θ5 0 0 6 5 0 0 0 0 π2 0 θ6 Rub π2 7 6 0 0 0 0 π2 0 θ7 0 π2 8 7 0 0 0 0 π2 0 θ8 0 0 9 5 1 0 −π2 0 0 Dub θ9 −W2s 0 10 9 0 0 0 0 −π2 0 θ10 0 −π2 11 10 0 0 0 0 −2π 0 θ11 −Rua −π2 12 10 0 0 0 0 −π2 0 θ12 0 0 13 11 0 0 0 0 π2 0 θ13 0 0 14 5 1 0 −π2 0 0 Dub θ14 W2s 0 15 14 0 0 0 0 −π2 0 θ15 0 −π2 16 15 0 0 0 0 −2π 0 θ16 −Rua −π2 17 16 0 0 0 0 −π2 0 θ17 0 0 18 17 0 0 0 0 π2 0 θ18 0 0 19 1 1 0 −π2 0 −2π 0 θ19 −W2w −π2 20 19 0 0 0 0 −π2 0 θ20 0 −π2 21 20 0 0 0 0 −2π 0 θ21 −Rul −π2 22 21 0 0 0 0 −π2 0 θ22 0 −π2 23 22 0 0 0 0 0 −Dll θ23 0 0 24 1 1 0 −π2 0 −2π 0 θ24 W2w −π2 25 24 0 0 0 0 −π2 0 θ25 0 −π2 26 25 0 0 0 0 −2π 0 θ26 −Rul −π2 27 26 0 0 0 0 −π2 0 θ27 0 −π2 28 27 0 0 0 0 0 −Dll θ28 0 0
Table 2 Body segment lengths as a proportion of body stature (Chaffin
et al, 1999; Tilley and Dreyfuss, 2002)
Symbol Segment Length
Rua Upper arm 0.186H Rla Forearm 0.146H Rh Hand 0.108H Rul Thigh 0.245H Dll Shank 0.246H Ws Shoulder width 0.204H Ww Waist width 0.100H Dub, Lub Torso length (L5-L1) 0.198H Rub Torso length (L1-T1) 0.090H
2.2 Dynamic modeling of virtual human
Necessary dynamic parameters for each body segment in-clude: gravity center, mass, moment of inertia about the grav-ity center, etc. According to the percentage distribution of total body weight for different segments (Chaffin et al, 1999), the weights of different segments can be calculated using Ta-ble 3.
It is feasible to calculate other necessary dynamic infor-mation with simplification of the segment shape. For limbs, the shape is simplified as a cylinder, head as a ball, and torso as a cube. The moment of inertia can be further determined based on the assumption of uniform density distribution. For
Table 3 Percentage distribution of total body weight according to
dif-ferent segmentation plans (Chaffin et al, 1999)
Grouped segments, individual segments % of total body weight % of grouped-segments weight Head and neck=8.4% Head=73.8% Neck=26.2%
Torso=50% Thorax=43.8%
Lumbar=29.4% Pelvis=26.8% Total arm=5.1% Upper Arm=54.9% Forearm=33.3% Hand=11.8% Total leg=15.7% Thigh=63.7% Thigh=63.7% Shank=27.4% Foot=8.9%
the virtual human system, once all the dynamic parameters are known, it is possible to calculate the torques and forces at each joint following Newton-Euler method (Khalil and Dombre, 2002).
2.3 Biomechanical modeling of virtual human
The biomechanical properties of the musculoskeletal system should also be modeled for virtual human simulation. From
Fig. 1 Geometrical modeling of virtual human
the physical aspect, the skeleton structure, muscle, and joint are the main biomechanical components in a human. In our study, only the joint moment strengths and joint movement ranges are used for the fatigue evaluation.
As mentioned before, with correct kinematic and dy-namic models, it is possible to calculate torques and forces in joints with an acceptable precision. Although biomechan-ical properties of muscles are reachable and different op-timization methods have been developed in the literature, the determination of the individual muscle force is still very complex and not as precise as that of joint torque (Xia and Frey Law, 2008). Since there are several muscles attached around a joint, it creates an mathematical underdetermined problem for force calculation in muscle level. In addition, each individual muscle has different muscle fiber compo-sitions, different levers of force, and furthermore different muscle coordination mechanisms, and the complexity of the problem will be increased dramatically in muscle level. There-fore, in our system, only the joint moment strength is taken to demonstrate the fatigue model.
The joint torque capacity is the overall performance of muscles attached around the joint, and it depends on the pos-ture and the rotation speed of joint (Anderson et al, 2007). When a heavy load is handled in a manual operation, the ac-tion speed is relatively small, and it is almost equivalent to static cases. The influence from speed can be neglected, so only posture is considered. In this situation, the joint strength can be determined according to strength models in Chaffin et al (1999). The joint strength is measured in torque and modeled as a function of joint flexion angles. An example of joint strength is given in Fig. 2. The shoulder flexion an-gle and the elbow flexion anan-gle are used to determine the profile of the male adult elbow joint strength. The 3D mesh surfaces represent the elbow joint strengths for 95% popula-tion. For the 50th percentile, the elbow joint strength varies from 45 to 75 N according to the joint positions.
0 100 200 0 50 100 15020 25 30 35 40 x 2.5 percentile y z 0 100 200 0 50 100 15035 40 45 50 55 60 x 16 percentile y z 0 100 200 0 50 100 15040 50 60 70 80 x 50 percentile y z 0 100 200 0 50 100 15060 70 80 90 100 x 84 percentile y z 0 100 200 0 50 100 15070 80 90 100 110 120 x 97.5 percentile y z
x axis - flexion angle [deg] of shoulder α
s
y axis - flexion angle[deg]of elbowα
e
z axis - elbow joint strength [Nm]
Fig. 2 Elbow static strength depending on the human elbow and
2.4 Graphical modeling of virtual human
The final step for modeling the virtual human is its graphi-cal representation. The skeleton is divided into 11 segments: body (1), head and neck (1), upper arms (2), lower arms (2), upper legs (2), lower legs (2), and feet (2). Each segment is modeled in 3ds file (3D Max, Autodesk Inc.) (Fig. 3(a)) and is connected via one or more revolute joints with another one to assemble the virtual skeleton (Fig. 3(b)). For each segment, an original point and two vectors perpendicular to each other are attached to it to represent the position and the orientation in the simulation, respectively. The position and orientation can be calculated by the kinematic model of the virtual human.
(a) 3DS model (b) virtual skeleton
Fig. 3 Virtual skeleton composed of 3DS models
3 Framework for evaluating manual handling operations
The center of the framework is the objective work evalua-tion system (OWES) in Fig. 4. The input module includes: human motion, interaction information, and virtual environ-ment. Human motion is either captured by motion capture system or simulated by virtual human simulation. The inter-action information is either obtained via haptic interfaces or modeled in simulation. Virtual environment is constructed to provide visual feedback to participants or workspace in-formation in simulation. Input inin-formation is processed in OWES. With different evaluation criteria, different aspects of human work can be assessed as in the previous human simulation tools.
A new conception human status is proposed for this framework to generalize the discussion. Human Status: it is a state, or a situation in which the human possesses dif-ferent capacities for an industrial operation. It can be further classified into mental status and physical status. Human sta-tus can be described as an aggregation of a set of human abilities, such as visibility, physical capacity (joint strength, muscle strength), and mental capacity. Virtual human sta-tus can be mathematically noted as HS= {V1, V2, . . . , Vn}.
OWES Objective Work Evaluation System Virtual Environment Virtual Human Virtual Interaction Fatigue Criteria Posture Criteria Efficiency Criteria Comfort Criteria Environment Human Motion Interaction Motion Capture Haptic Interfaces Virtual Reality Simulated Human Motion Human Simulation F a tig u e A n a ly s is C o m fo rt A n a ly s is P o s u tr e A n a ly s is
Posture Prediction Algorithm
Virutal Human Status
Update
Fig. 4 Framework for the work evaluation
Each Vi represents one specific aspect of human abilities, and this state vector can be further detailed by a vector Vi=
{vi1, vi2, . . . , vimi}. The change of the human status is defined
as∆HS= HS(t +δt)− HS(t) = {∆V1,∆V2, . . . ,∆Vn}. For
example, one aspect of the physical status can be noted as
HS= [S1, S2, . . . , Sn], where Sirepresents the physical joint
strength of the ithjoint of the virtual human.
In order to make the simulation as realistic as in real world, it is necessary to know how the human generates a movement. The bidirectional communication between hu-man and the real world in an operation decides the action to accomplish a physical task: worker’s mental and physical status can be influenced by the history of operation, while the worker chooses his or her suitable movement according to his or her current mental and physical statuses. Hence the framework is designed to evaluate the change of human sta-tus before and after an operation, and furthermore to predict the human motion according to the changed human status.
The human is often simplified for posture control as a sensory-motor system in which there are enormous external sensors covering the human body and internal sensors in the human body capturing different signals, and the central ner-vous system (CNS) transfer the signals into decision making system (Cerebrum and Vertebral disc); the decision mak-ing system generates output commands to generate forces in muscles and then drives the motion and posture responding to the external stimulus. Normally, most of the external in-put information is directly measurable, such as temperature, external load, moisture, etc. However, how to achieve all the information for such a great number of sensors all over the human body is a challenging task. In addition, the internal perception of human body, which plays also an important role in motor sensor coordination, is much more difficult to be quantified. The most difficult issue is to know how the brain handles all the input and output signals while perform-ing a manual operation. In previous simulation tools, the ex-ternal input information has been already provided and han-dled. Visual feedback, audio feedback, and haptic feedback are often employed as input channel for a virtual human
sim-ulation. One limitation of the existing methods is that the in-ternal sensation is not considered enough. Physical fatigue is going to be modeled and integrated into the framework to predict the perceived strength reduction and the reactions of the human body to the fatigue, which provides a close-loop for the human simulation (Fig. 5).
Fig. 5 Human status in human simulation tools
The special contribution in this framework is that the reduction of the physical strength can be evaluated in the framework based on a muscle fatigue model. And then the changed physical strength is taken as a feedback to the vir-tual human simulation to update the simulation result.
The framework performs mainly two functions: posture analysis and posture prediction (human simulation). The func-tion of posture predicfunc-tion is to simulate the human mofunc-tion based on the current virtual human status. Posture analysis focuses on assessing the difficulty of the manual operation. The difficulty of the work is assessed by the change of hu-man status before and after the operation∆HS=∆HSphysical. Physical fatigue is one of the physical aspects, and this as-pect is evaluated by the decrease of the strength in joints. The posture analysis function of the framework is our focus in this paper.
More precisely in this paper, the joint strengths models are used to determine the initial joint moment capacity, and then the fatigue in the joints can be further determined by the external load in the static operation and the fatigue model in Section 4, and then the change of the physical status can be assessed.
4 Fatigue modeling and Fatigue analysis 4.1 Fatigue modeling
A new dynamic fatigue model based on muscle motor unit recruitment principle was proposed in (Ma et al, 2009). This model was able to integrate task parameters (external load) and temporal parameters for predicting the fatigue of static manual handling operations in industry. Equation 1 is the
original form of the fatigue model to describe the reduction of the capacity. The descriptions of the parameters for Eq. 1 are listed in Table 4. The detailed explanation about this model can be found in Ma et al (2009).
dFcem(t)
dt = −k
Fcem(t)
MVC Fload(t) (1)
Table 4 Parameters in dynamic fatigue model
Item Unit Description
MVC N Maximum voluntary contraction, maximum capacity of muscle
Fcem(t) N Current exertable maximum force, current capacity of muscle
Fload(t) N External load of muscle, the force which the muscle needs to generate
k min−1 Constant value, fatigue ratio
%MVC Percentage of the voluntary maximum con-traction
fMVC %MVC/100,
Fload(t)
MVC
Maximum endurance time (MET) models can be used to predict the endurance time of a static operation. In static cases, Fload(t) is constant in the fatigue model, and then
MET is the duration in which Fcemfalls down to Fload. Thus,
MET can be determined in Eq. (2) and (3).
Fcem(t) = MVC e Rt 0−k Fload(u) MVC du= Fload(t) (2) t= MET = − lnFload(t) MVC kFload(t) MVC = −ln( fMVC) k fMVC (3)
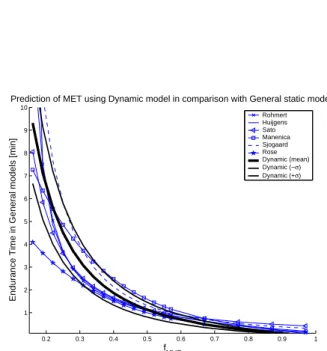
This model was validated in comparison with 24 MET models summarized in El ahrache et al (2006). The previous MET models were used to predict the maximum endurance time for static exertions and they were all described in func-tions with fMVCas the only variable. High Pearson’s corre-lations and interclass correcorre-lations (ICC) between the MET model in Eq. 3 and the other previous MET models validated the availability of our model for static cases. Meanwhile, the comparison between our model and a dynamic motor unit recruitment based model (Liu et al, 2002) suggested that our model was also suitable for modeling muscle fatigue in dy-namic cases.
In (Ma et al, 2009), the fatigue ratio k was assigned 1
in fatigue resistance in the population, and the variability re-sults from several factors, such as age, career, gender, mus-cle groups, etc. The parameter k can handle the effects on the fatigue resistance globally. Therefore, it is necessary to determine the fatigue resistances for different muscle groups to complete the muscle fatigue model.
4.2 Fatigue resistance based on MET models
Thanks to the high linear relationship between our MET model and the previous MET models, it is proposed that each static MET model f(x) can be described
mathemati-cally by a linear equation (Eq. 4). In Eq. 4, x is used to re-place fMVCand p(x) represents Eq. 3. m and n are constants describing the linear relationship between static model and our model, and they need be determined in regression. Here,
m= 1/k indicates the fatigue resistance of the static model,
and k is fatigue ratio or fatigability of different static model.
f(x) = m p(x) + n (4)
Due to the asymptotic tendencies of MET models, when
x→ 1 (%MVC → 100), f (x) → 0 and p(x) → 0 (MET → 0),
we assume n= 0. Since some MET models are not
suit-able for %MVC≤ 15%, the regression is carried out from
x= 0.16 to x = 0.99. With a step length 0.01, N = 84 MET
values are calculated to determine the parameter m of each MET model by minimizing the function in Eq. 5.
M(x) =
N
∑
i=1( f (xi) − m p(xi))2= a m2+ b m + c (5)
From Eq. 5, m can be calculated by Eq. 6.
m=−b 2a = N ∑ i=1 p(xi) f (xi) N ∑ i=1 p(xi)2 > 0 (6)
The regression result represents the fatigue resistance of the muscle group. In comparison with 6 general MET models, 6 elbow models, 5 shoulder models, and 6 hip/back models, different muscle fatigue resistances for correspond-ing muscle groups were calculated and listed below in Table 5. The mean value ¯m andσmcan be used to adjust our MET model to cover different MET models, and they can be fur-ther used to predict the fatigue resistance of a muscle group for a given population. The prediction with mean value and its deviation in general MET models is shown in Fig.6. It is observable that the bold solid curve and two slim solid curves cover most of the area formed by the previous empir-ical MET models.
It should be noted that the fatigue resistance for differ-ent muscle groups are only regressed based on the empirical data grouped in the literature, and the results (Table 6) for shoulder and hip/back muscle groups did not conform to the normal distribution. For the shoulder joint, the subjects in these models were not only from different careers but also from different gender mixture. Therefore, the fatigue resis-tance result can only provide a reference in this study.
Table 5 Fatigue resistance ¯m for different muscle groups
Segment m¯ σm General 0.8135 0.2320 Shoulder 0.7562 0.4347 Elbow 0.8609 0.4079 Hip 1.9701 1.1476 0.2 0.3 0.4 0.5 0.6 0.7 0.8 0.9 1 1 2 3 4 5 6 7 8 9 10
Prediction of MET using Dynamic model in comparison with General static models
f MVC
Endurance Time in General models [min]
Rohmert Huijgens Sato Manenica Sjogaard Rose Dynamic (mean) Dynamic (−σ) Dynamic (+σ)
Fig. 6 Prediction of MET in the dynamic MET model in comparison
with that in the general models
Table 6 Fatigue resistances of shoulder MET models
Model Subjects m
Sato et al (1984) 5 male 0.427 Rohmert et al (1986) 6 male and 1 female students 0.545 Mathiassen and Ahsberg
(1999)
20 male and 20 female mu-nicipal employees
0.698
4.3 Workflow for fatigue analysis
The general process of the posture analysis has been dis-cussed in Section 3, and here is the flowchart in Fig. 7 to depict all the details in processing all the input information.
Fig. 7 Workflow for the fatigue evaluation
First, human motion obtained either from human simu-lation or from motion capture system is further processed to displacement q, speed ˙q, and acceleration ¨q in general coor-dinates.
The external forces and torques on the human body are either measured directly by force measurement instruments or estimated in the simulation. The external loads are trans-formed toΓi and Fiin the coordinates attached to qi in the modified DH method.
Human motion and interaction (forces, torques) are mapped into the digital human model which is geometrically and dynamically modeled from anthropometry database and the biomechanical database. Inverse dynamics is used to calcu-late the torque and force at each general joint. If it goes fur-ther, the effort of each individual muscle can be determined using optimization method as well.
Once the loads of the joints are determined, the fatigue of each joint can be analyzed using the fatigue model. The reduction of the physical strength can be evaluated, and fi-nally the difficulty of the operation can be estimated by the change of physical strengths.
5 Analysis Results for EADS Application Cases -Drilling
5.1 Operation description
The application case is the assembly of two fuselage sec-tions with rivets from the assembly line of an airplane in European Aeronautic Defence & Space (EADS) Company. One part of the job consists of drilling holes all around the
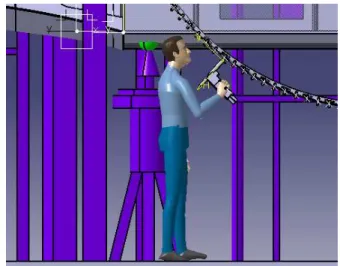
cross section. The tasks is to drill holes around the fuselage circumference. The number of the holes could be up to 2,000 on an orbital fuselage junction of an airplane. The drilling machine has a weight around 5 kg, and even up to 7 kg in the worst condition with consideration of the pipe weight. The drilling force applied to the drilling machine is around 49N. In general, it takes 30 seconds to finish a hole. The drilling operation is illustrated in Fig. 8. The fatigue hap-pens often in shoulder, elbow, and lower back because of the heavy load. Only the upper limb is taken into consider-ation in this demonstrconsider-ation case to decrease the complexity of the analysis.
Fig. 8 Drilling case in CATIA
5.2 Endurance time prediction
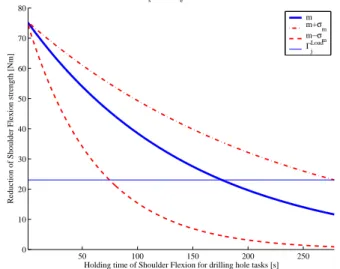
The drilling machine with a weight 5 kg is taken to calcu-late the maximum endurance time under a static posture with shoulder flexion as 30◦and elbow flexion 90◦for maintain-ing the operation in a continuous way. The weight of the drilling machine is divided by two in order to simplify the load sharing problem. The endurance result is shown in Ta-ble 7 for the population falling in the 95% strength distribu-tion. It is found that the limitation of the work is determined by the shoulder, since the endurance time for the shoulder joint is much shorter than that of the elbow joint.
The difference in endurance results has two origins. One is the external load relative to the joint strength. The second comes from the fatigue resistance difference among the pop-ulation. These differences are graphically presented from Fig. 9 to Fig. 12. Figure 9 and Figure 10 show the vari-able endurance caused by the joint strength distribution in the adult male population with the mean fatigue resistance. Larger strength results in longer endurance time for the same external load. Figure 11 and Figure 12 present the endurance
Table 7 Maximum endurance time of shoulder and elbow joints for drilling work MET [sec] S− 2σ S−σ S S+σ S+ 2σ Shoulder ¯ m−σm 19.34 45.05 75.226 108.81 145.16 ¯ m 45.489 105.96 176.94 255.94 341.44 ¯ m+σm 71.639 166.87 278.65 403.07 537.71 Elbow ¯ m−σm 230.61 424.27 640.47 873.52 1120.1 ¯ m 438.27 806.3 1217.2 1660.1 2128.6 ¯ m+σm 645.92 1188.3 1793.9 2446.6 3137.2
time for the population with the average joint strength but different fatigue resistances, and it shows that larger fatigue resistance leads to longer endurance time. Combining with the strength distribution and the fatigue resistance variance, the MET can be estimated for all the population.
50 100 150 200 250 300 0 20 40 60 80 100 120
Reduction of Shoulder Flexion strength [Nm]
Sj−2σj Sj−σj S j S j+σj Sj+2σj Γj Load 50 100 150 200 250 300 0 0.1 0.2 0.3 0.4 0.5 0.6 0.7 0.8 0.9 1
Holding time of Shoulder Flexion for drilling hole tasks [s]
Normalized Reduction of Shoulder Flexion strength
Geometric configuration in αs = 30 o, α
e = 90
o, mass of drilling machine 2.5 kg
Sj−2σj Sj−σj S j S j+σj Sj+2σj
Fig. 9 Endurance time prediction for shoulder with average fatigue
resistance
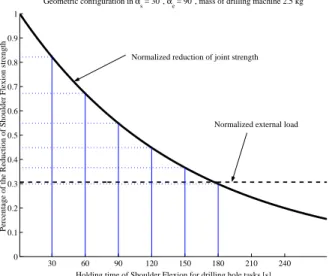
5.3 Fatigue evaluation
The fatigue is evaluated by the change of the joint strength in a fatigue operation. The working history can generate in-fluence on the fatigue. Therefore, the fatigue for drilling a hole is evaluated in a continuous working process up to 6 holes. Only the population with the average strength and the average fatigue resistance is analyzed in fatigue evalu-ation in order to present the effect of the work history. The reduced strength is normalized by dividing the maximum joint strength, and it is shown in Fig. 13. It takes 30 seconds to drill a hole, and the joint strength is calculated and nor-malized every 30 seconds until exhaustion for the shoulder joint. 500 1000 1500 2000 0 20 40 60 80 100 120
Reduction of Elbow Flexion strength [Nm]
500 1000 1500 2000 0 0.1 0.2 0.3 0.4 0.5 0.6 0.7 0.8 0.9 1
Holding time of Elbow Flexion for drilling hole tasks [s]
Normalized Reduction of Elbow Flexion strength
Geometric configuration in α
s = 30 o, α
e = 90
o, mass of drilling machine 2.5 kg
S j−2σj S j−σj S j S j+σj S j+2σj S j−2σj S j−σj S j S j+σj S j+2σj ΓjLoad
Fig. 10 Endurance time prediction for the elbow with average fatigue
resistance 50 100 150 200 250 0 10 20 30 40 50 60 70 80
Holding time of Shoulder Flexion for drilling hole tasks [s]
Reduction of Shoulder Flexion strength [Nm]
Geometric configuration in αs = 30o, α e = 90
o, mass of drilling machine 2.5 kg
m m+σm
m−σm ΓjLoad
Fig. 11 Endurance time for the population with average strength for
shoulder joint
In our current research, HS includes only the joint strength vector. The evaluation of the fatigue is measured by the change of the joint strength for drilling a hole. The result is shown in Table 8. Three measurements are given in this table: one is the normalized physical strength every 30 seconds, noted as HSi
HSmax
; one is the difference between the joint strength before and after finishing a hole, noted as HSi− HSi+1
HSmax ; the last one if the difference between the joint strength and the maximum joint strength, noted asHSmax− HSi
HSmax
. In Table 8, only the reduction of the shoulder joint strength is presented, since the relative load in elbow joint is much smaller.
From Fig. 13 and Table 8, the joint strength keeps the trend of descending in the continuous work. The ratio of the reduction gets smaller in the work progress due to the
Table 8 Normalized shoulder joint strength in the drilling operation Time [s] 0 30 60 90 120 150 180 ¯ m HSi HSmax 100% 82.2% 67.2% 54.9% 44.8% 36.6% 30.1% HSi− HSi+1 HSmax 0% 17.8% 15.0% 12.3% 10.1% 8.2% 6.5% HSmax− HSi HSmax 0% 17.8% 32.8% 45.1% 55.2% 63.4% 69.9% 200 400 600 800 1000 1200 1400 1600 0 10 20 30 40 50 60 70 80
Holding time of Elbow Flexion for drilling hole tasks [s]
Reduction of Elbow Flexion strength [Nm]
Geometric configuration in α
s = 30 o, α
e = 90
o, mass of drilling machine 2.5 kg
m m+σm
m−σm ΓjLoad
Fig. 12 Endurance time for the population with average strength for
elbow joint 30 60 90 120 150 180 210 240 0 0.1 0.2 0.3 0.4 0.5 0.6 0.7 0.8 0.9 1
Holding time of Shoulder Flexion for drilling hole tasks [s]
Percentage of the Reduction of Shoulder Flexion strength
Geometric configuration in α
s = 30 o, α
e = 90
o, mass of drilling machine 2.5 kg
Normalized reduction of joint strength
Normalized external load
Fig. 13 Fatigue evaluation after drilling a hole in a continuous drilling
process
physiological change in the muscle fiber composition. More time consumed to work leads more reduction in physical strengths. The reduction relative to the maximum strength is able to assess the difficulty of the operations.
5.4 Experiment validation
Simulated drilling operations were tested under laboratory conditions in Tsinghua University. A total of 40 male in-dustrial workers were asked to simulate the drilling work in a continuous operation for 180 seconds. Maximum output strengths were measured in the simulated operations at dif-ferent periods of the operation. Fatigue was indexed by the reduction of the joint strength along time relative to the ini-tial maximum joint strength. Three out of the 40 subjects could not sustain the external load for a duration of 180 seconds, and 34 subjects had a shoulder joint fatigue resis-tance (Mean=1.32, SD=0.62) greater than the average shoul-der joint fatigue resistance in Table 5, which means that the sample population has a higher fatigue resistance than the population grouped in the regression.
The physical strength has been measured in simulated job static strengths, and the reduction in the operation varies from 32.0% to 71.1% (Mean=53.7% and SD=9.1%). The re-duction falls in the fatigue prediction of the theoretical meth-ods in Table 9 (Mean=51.7%, SD=12.1%).
Table 9 Normalized torque strength reduction for the population with
higher fatigue resistance
HSmax− HS180 HSmax S− 2σ S−σ S S+σ S+ 2σ ¯ m - - 69.9% 62.5% 56.3% ¯ m+σm - 63.2% 53.2% 46.4% 40.8% ¯ m+ 2σm 64.9% 51.9% 43.0% 36.7% 31.9% 5.5 Discussion
Under the proposed framework, the conception of the virtual human status is introduced and realized by a virtual human modeling and simulation tool. The virtual human is kine-matic modeled based on the modeling method in robotics. Inverse dynamics is used to determine the joint loads. With the integration of a general fatigue model, the physical fa-tigue in a manual handling operation in EADS is simulated and analyzed. The decrease in human joint strengths can be
predicted in the theoretical approach, and it has been vali-dated with experimental data.
Human status is introduced in this framework in order to generalize all the discussion for the human simulation. We concentrate only on the physical aspect of the virtual human, in particular on joint strengths. Physical status can be ex-tended to other aspects, either measurable using instruments (e.g., heart rate, oxygen consumption, electromyograph of muscle, etc.) or predicable using mathematical models (e.g., vision, strength, etc.). Similarly, the mental status of human can also be established by similar terms (e.g., mental capac-ity, mental workload, mental fatigue, etc.). Under the con-ception of human status, different aspects of the human can be aggregated together to present the virtual human com-pletely. The changed human status caused by a physical job or a mental job can be measured or predicted to assess differ-ent aspects of the job. It should be noted that the definition of human status is still immature and it requires great effort to form, extend, and validate this conception.
The main difference between the fatigue analysis in our study and the previous methods for posture analysis is: in previous methods (Wood et al, 1997; Iridiastadi and Nuss-baum, 2006; Roman-Liu et al, 2005), intermittent proce-dures were used to develop the fatigue model with job spe-cific parameters; in contrast, all the related physical expo-sure factors are taken into consideration in a continuous ap-proach in our model. In this way, the analysis of the manual handling operation can be generalized without limitations of job specific parameters. Furthermore, the fatigue and recov-ery procedures can be decoupled to simplify the analysis in a continuous way. Although only a specific application case is presented in this paper, the feasibility of the general con-cept has been verified by the introduction of human status and the validation of the fatigue model.
It should be noted that the recovery of the physical strength has not been considered yet. Although there are several work-rest allowance models in the literature, substantial variabil-ity was found among the prediction results for industrial op-erations (El ahrache and Imbeau, 2009) and it is still ongoing to develop a general recovery model.
6 Conclusions
In this study, human status is introduced into the work eval-uation system, especially for the physical status. It provides a global definition under which different aspects of human abilities can be integrated and assessed simultaneously. The effect of the work on the human status, either positive or negative, can be measured by the change of the human sta-tus before and after the operation. We concentrate our study on physical aspects, especially on joint moment strengths. The physical fatigue analysis in a drilling case under the work evaluation framework demonstrates the work flow and
the functions of the virtual human simulation. The change of joint moment strength, a specific aspect of human phys-ical status, has been simulated based on a general fatigue model with fatigue resistances. The similar results between the analysis and the experimental data suggests that the frame-work may be useful for assessing the physical status in con-tinuous static operations.
The new conception human status and the theoretical method for assessing the physical status may provide a new approach to generalize the virtual human simulation and eval-uate the physical aspect in continuous static manual han-dling operations. This approach is useful to assess the phys-ical load to prevent industrial workers from MSD risks, and it can also be used to assess mental load with extension of mental status.
However, it should be noted that great effort has to be done to extend different aspects in human status to make it more precise. Even only for physical fatigue, it is still nec-essary to develop a recovery model to complete the fatigue prediction.
Acknowledgments
This research was supported by the EADS and the R´egion des Pays de la Loire (France) in the context of collaboration between the ´Ecole Centrale de Nantes (Nantes, France) and Tsinghua University (Beijing, PR China).
References
Anderson D, Madigan M, Nussbaum M (2007) Maximum voluntary joint torque as a function of joint angle and an-gular velocity: Model development and application to the lower limb. Journal of Biomechanics 40(14):3105–3113 Badler NI, Phillips GB, Webber BL (1993) Simulating
hu-mans: computer graphics animation and control. Oxford University Press, USA
Bubb H, Engstler F, Fritzsche F, Mergl C, Sabbah O, Schae-fer P, Zacher I (2006) The development of RAMSIS in past and future as an example for the cooperation between industry and university. International Journal of Human Factors Modelling and Simulation 1(1):140–157
Chaffin D (2002) On simulating human reach motions for ergonomics analyses. Human Factors and Ergonomics in Manufacturing 12(3):235–247
Chaffin D (2007) Human motion simulation for vehicle and workplace design. Human Factors and Ergonomics in Manufacturing 17(5):475
Chaffin DB, Andersson GBJ, Martin BJ (1999) Occupa-tional biomechanics, 3rd edn. Wiley-Interscience Chedmail P, Chablat D, Roy CL (2003) A distributed
robot in a virtual reality environment. IEEE Transactions on Industrial Electronics 50(4):692–698
Chen Y (2000) Changes in lifting dynamics after local-ized arm fatigue. International Journal of Industrial Er-gonomics 25(6):611–619
Damsgaard M, Rasmussen J, Christensen S, Surma E, de Zee M (2006) Analysis of musculoskeletal systems in the AnyBody Modeling System. Simulation Modelling Practice and Theory 14(8):1100–1111
Ding J, Wexler AS, Binder-Macleod SA (2000) A predictive model of fatigue in human skeletal muscles. Journal of Applied Physiology 89:1322–1332
El ahrache K, Imbeau D (2009) Comparison of rest al-lowance models for static muscular work. International Journal of Industrial Ergonomics 39(1):73–80
El ahrache K, Imbeau D, Farbos B (2006) Percentile val-ues for determining maximum endurance times for static muscular work. International Journal of Industrial Er-gonomics 36(2):99–108
Fuller J, Lomond K, Fung J, Cˆot´e J (2008) Posture-movement changes following repetitive motion-induced shoulder muscle fatigue. Journal of electromyography and kinesiology: official journal of the International So-ciety of Electrophysiological Kinesiology
Garg A, Hegmann K, Schwoerer B, Kapellusch J (2002) The effect of maximum voluntary contraction on endurance times for the shoulder girdle. International Journal of In-dustrial Ergonomics 30(2):103–113
Giat Y, Mizrahi J, Levy M (1993) A musculotendon model of the fatigue profiles of paralyzed quadriceps muscle un-der FES. IEEE Transactions on Biomechanical Engineer-ing 40(7):664–674
Hill A (1938) The heat of shortening and the dynamic con-stants of muscle. Proceedings of the Royal Society of London Series B, Biological Sciences 126(843):136–195 Hou H, Sun S, Pan Y (2007) Research on virtual human in ergonomic simulation. Computers & Industrial Engineer-ing 53(2):350–356
Iridiastadi H, Nussbaum M (2006) Muscle fatigue and en-durance during repetitive intermittent static efforts: devel-opment of prediction models. Ergonomics 49(4):344–360 Khalil W, Dombre E (2002) Modelling, identification and
control of robots. Hermes Science Publications
Komura T, Shinagawa Y, Kunii TL (2000) Creating and re-targetting motion by the musculoskeletal human. The Vi-sual Computer 16(5):254–270
Li G, Buckle P (1999) Current techniques for assessing physical exposure to work-related musculoskeletal risks, with emphasis on posture-based methods. Ergonomics 42(5):674–695
Liu J, Brown R, Yue G (2002) A dynamical model of mus-cle activation, fatigue, and recovery. Biophysical Journal 82(5):2344–2359
Ma L, Chablat D, Bennis F, Zhang W (2009) A new simple dynamic muscle fatigue model and its validation. Interna-tional Journal of Industrial Ergonomics 39(1):211–220 Mathiassen S, Ahsberg E (1999) Prediction of shoulder
flex-ion endurance from personal factor. Internatflex-ional Journal of Industrial Ergonomics 24(3):315–329
Rohmert W, Wangenheim M, Mainzer J, Zipp P, Lesser W (1986) A study stressing the need for a static postural force model for work analysis. Ergonomics 29(10):1235– 1249
Roman-Liu D, Tokarski T, Kowalewski R (2005) Decrease of force capabilities as an index of upper limb fatigue. Ergonomics 48(8):930–948
Sato H, Ohashi J, Iwanaga K, Yoshitake R, Shimada K (1984) Endurance time and fatigue in static contractions. Journal of human ergology 13(2):147–154
Tilley AR, Dreyfuss H (2002) The measure of man & woman. Human factors in design. Revised Edition. New York: John Wiley & Sons, Inc.
Vignes RM (2004) Modeling muscle fatigue in digital hu-mans. Master’s thesis, Graduate College of The Univer-sity of Iowa
VSR Research Group (2004) Technical report for project virtual soldier research. Tech. rep., Center for Computer-Aided Design, The University of IOWA
Wood D, Fisher D, Andres R (1997) Minimizing fatigue during repetitive jobs: optimal work-rest schedules. Hu-man Factors: The Journal of the HuHu-man Factors and Er-gonomics Society 39(1):83–101
Xia T, Frey Law L (2008) A theoretical approach for mod-eling peripheral muscle fatigue and recovery. Journal of Biomechanics 41(14):3046–3052
Yang J, Pitarch E, Kim J, Abdel-Malek K (2006) Posture prediction and force/torque analysis for human hands. In: Proc. of SAE Digital human modelling for design and en-gineering conference, p 2326
Yang J, Sinokrot T, Abdel-Malek K (2008) A general an-alytic approach for Santos upper extremity workspace. Computers & Industrial Engineering 54(2):242–258
![Fig. 2 Elbow static strength depending on the human elbow and shoul- shoul-der joint position, α s , α e [deg]](https://thumb-eu.123doks.com/thumbv2/123doknet/8126455.272745/5.892.473.770.519.1010/elbow-static-strength-depending-human-elbow-shoul-position.webp)