HAL Id: hal-00837024
https://hal-polytechnique.archives-ouvertes.fr/hal-00837024
Submitted on 19 May 2014
HAL is a multi-disciplinary open access
archive for the deposit and dissemination of
sci-entific research documents, whether they are
pub-lished or not. The documents may come from
teaching and research institutions in France or
abroad, or from public or private research centers.
L’archive ouverte pluridisciplinaire HAL, est
destinée au dépôt et à la diffusion de documents
scientifiques de niveau recherche, publiés ou non,
émanant des établissements d’enseignement et de
recherche français ou étrangers, des laboratoires
publics ou privés.
Visible-infrared two-dimensional Fourier-transform
spectroscopy
Nadia Belabas, Manuel Joffre
To cite this version:
Nadia Belabas, Manuel Joffre.
Visible-infrared two-dimensional Fourier-transform spectroscopy.
Optics Letters, Optical Society of America - OSA Publishing, 2002, 27 (22), pp.2043.
�10.1364/OL.27.002043�. �hal-00837024�
November 15, 2002 / Vol. 27, No. 22 / OPTICS LETTERS 2043
Visible–infrared two-dimensional Fourier-transform
spectroscopy
Nadia Belabas and Manuel Joffre
Laboratoire d’Optique et Biosciences, Institut National de la Santé et de la Recherche Médicale U451 – Centre National de la Recherche Scientifique Unité Mixte de Recherche 7645 – Ecole Polytechnique – École Nationale Supérieure des Techniques Avancées,
91128 Palaiseau Cedex, France
Received June 18, 2002
We report on a new class of optical multidimensional Fourier-transform spectroscopy associated with a vis-ible excitation – infrared emission configuration, in which the emitted field results from second-order optical nonlinearities. This configuration is demonstrated on a phase-matched sample of known nonlinear response by coherent measurement of the mid-infrared field emitted after a femtosecond visible double-pulse excita-tion. © 2002 Optical Society of America
OCIS codes: 320.7110, 300.6300, 300.6420.
Optical spectroscopy techniques serve to provide knowledge of matter through the detection of radiated electric fields stemming from the oscillating electric dipole density, P , induced in a sample by the total incident field, E. In the perturbative regime, the response function of the material under study is entirely described by the set of its successive electrical susceptibilities, x共n兲, which are n 1 1-rank tensors.
Conversely, the position, magnitude, and shape of
the features of a complex map of x共n兲 hold all the
information about existing couplings and inhomo-geneities within the sample. They can in turn be related to the structural properties of crystals1 and
to couplings between bond stretches.2 – 4 The latter
can provide information about the three-dimensional
structure of molecules and small peptides.5,6 The
dynamics of molecular environments can also be
retrieved.7 Outcomes of any optical measurement
in the perturbative regime can of course be derived from these complex tensors. Complete measurement of the centerpiece x共n兲 is achieved only with
multidi-mensional spectroscopy (nDSY). In practice, nDSY consists of measuring the field Eemission共n兲 radiated by the nth-order nonlinearity of a material as a function of
p 共1# p # n 2 1兲 independent parameters to retrieve
the nth-order nonlinear response J共n兲 of the sample
共p 苷 n 2 1兲 or one of its projections 共p , n 2 1兲. As the measured observable is the field Eemission共n兲 and not
the ensemble-averaged electrical polarization, P共n兲,
here we define the effective nth-order response J共n兲as Eemission共n兲 共v1兲 苷 Z J共n兲共v2, . . . ,vn11兲E共v2兲 . . . E共vn11兲d µ v12 X i.1 vi ∂ dv2. . .dvn, (1) where J共n兲 incorporates not only macroscopic x共n兲 but
also a propagation term [see Eq. (3), below] and, in the case n . 2, terms including x共j 兲, where j , n is
associated with cascading effects. In summary, an nDSY measurement removes the integral in Eq. (1) by spreading the intricate and integrated emission
Eemission共n兲 along p additional axes; for known E and
p 苷 n 2 1 this spreading allows retrieval of the map
of J共n兲in n frequency dimensions.
The p parameters can be the wavelength of tun-able continuous lasers,4but most experimental
demon-strations are done through manipulation in the time domain with multiple-pulse Fourier-transform nonlin-ear spectroscopy1 – 3,5,7(nDFTSY), i.e., the optical analog
of multiple quantum nuclear magnetic resonance.8 In
nDFTSY, the parameters are time delays ti, 2 # i #
p1 1, in a sequence of femtosecond pulses Ei 关E 苷
Pp12
i苷2 Ei共t2 ti兲, tp12苷 0兴. In the case of p 苷 n 2 1 studied experimentally below, the cross term of inter-est in Eq. (1) is Ecrossterm共n兲 共v1兲 苷 Z J共n兲共v2, . . . ,vn11兲E2共v2兲exp共iv2t2兲 3 E3共v3兲exp共iv3t3兲 . . .d µ v12 X i.1 vi ∂ dv2. . .dvn. (2) In nDFTSY, the spectral map of J共n兲is retrieved with
Fourier transforms of Eq. (2) relative to the ti Fourier conjugate of the vi.
The number of pulses, their wavelengths, their rela-tive phases, and the beam geometry of the pulses within the exciting sequence are chosen according to the physics under study in the sample [i.e., according
to the process involved in J共n兲]: The second-order
nonlinearity of noncentrosymmetric samples is probed
with only two pulses,1 in contrast with
centrosym-metric and in particular liquid samples2,3,5,7 共n 苷 3,
5兲, which are active only at the x共3兲 level. Electronic
couplings are addressed in the visible1,7; vibrational
couplings, in the infrared3,5or in the visible via Raman
scattering.2 Noncollinear geometry or a suitable set
of phases of the exciting pulses can be used to isolate cross term (2). In all cases the phase between the exciting pulses must be stabilized as explained below.
Coherent detection of Eemission共n兲 共v1兲 is necessary as
both the amplitude and the phase of this f ield are
re-quired for computing the Fourier transforms. One can
then use either Fourier-transform spectral
interferom-etry9 (multichannel detection) or time-domain
inter-ferometry with a local oscillator or reference f ield
E1共t2 t1兲(single-channel detector). In both cases one
2044 OPTICS LETTERS / Vol. 27, No. 22 / November 15, 2002 must be aware that Fourier transforms of unequally
spaced data (because of either unjustified interpo-lation10,11 or uneven time steps) result in distorted,
aliased, and blurred maps. The stabilization and
control of the time delays may be more demanding than the requirements for processing data from Fourier-transform spectral interferometry, but a time-domain interferometry setup is more versatile, as only one detector has to be replaced if one wishes
to measure a new part of J共n兲, i.e., a new spectral
domain. Furthermore, time-domain interferometry is a widely used technique in the mid infrared, where multichannel detectors are not easily available.
In this Letter we present a two-dimensional 共 p 苷 1兲Fourier-transform visible excitation– infrared emit-ted field measurement. In our experiment a visible pulse sequence excites through second-order nonlinear processes 共n 苷 2兲 a low-frequency polarization that in turn radiates a mid-infrared f ield according to Eq. (1). The emitted field is measured with a broadband mid-infrared (center at 10 mm) reference f ield generated by optical rectification.12 In contrast with previously
reported all-infrared or all-visible experiments,1 – 7
elec-tronic and vibrational couplings can be simultaneously addressed in our visible – infrared configuration.
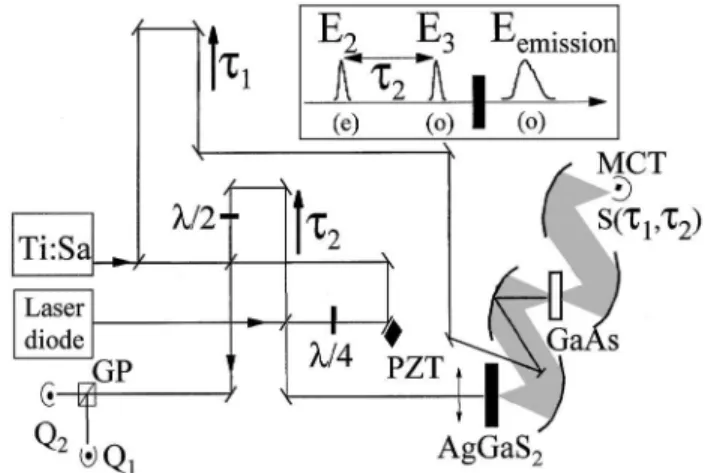
In practice (see the experimental layout in Fig. 1), the infrared emitter is excited by a sequence of two 16-fs 0.2-nJ 800-nm pulses delivered by a Ti:sapphire
oscillator. The time delay t2 between the two
vis-ible (800-nm) pulses is the Fourier conjugate of a visible spectral axis 共v2 or v3兲. The emitted field is
measured in amplitude and phase by time-domain interferometry, i.e., through a linear correlation
mea-surement with a reference infrared field, E1. Note
the rather unconventional geometry used in the experiment, the measured f ield being transmitted through the GaAs sample used for generation of the reference field through optical rectification. This approach, already discussed in detail previously,12,13
allows dispersion compensation between the signal and the reference f ields, since both undergo the same dispersion through propagation in the GaAs sample after the reference field has been generated in the first micrometer of the sample (one absorption length). We also checked that the free-carrier absorption in GaAs was kept at a negligible level so as not to change the spectrum of the signal f ield.
The time delay, t1, between the signal field and E1
transforms into mid-infrared spectral variable v1. A
two-dimensional Fourier transform of the cross term in the experimental data, with respect to both t1and
t2, thus yields Eⴱ1共v1兲J共2兲共v2,v21 v1兲Eⴱ2共v2兲E3共v21
v1兲, from which the desired two-dimensional map of
J共2兲 can be deduced. It is noteworthy that the
spec-tral phase of the reference and exciting fields is of no concern in this work, since we report only on the mag-nitude of the two-dimensional response jJ共2兲j, which
can be directly deduced from the magnitude of the two-dimensional Fourier transform. For the same reason, the zero time delay between the reference and the sig-nal field can be set arbitrarily.
However, as stated above, the validity of the re-trieved J共2兲map yielded by a double Fourier transform
of interferometric signal S共t1,t2兲depends strongly on
the accuracy of the temporal axes t1 and t2. t1 is
swept with a 0.1-mm step motor with no additional sta-bilization, as stability was a priori not an issue in the mid-infrared wavelength domain. t2is actively
stabi-lized by means of a 3-mm (10-fs) stroke piezoelectric
transducer. The time–domain interferences Q1 of a
ldiode苷 670 nm laser diode propagating along the in-terferometer are used as a feedback signal, allowing precision of ⬃30 nm or 0.1 fs on t2. For resolution of
dv2苷 1.75 THz 共58.3 cm21兲on v2, t2is scanned along
570.8 fs by means of a 0.1-mm step motor. To scan t2
while keeping track of the interference order (fringe
number) of Q1, we use a second time-domain
inter-ference signal, Q2, with a phase differing from Q1 by
p兾2. Q2 is obtained by placement of a quarter-wave
plate in one arm of the interferometer and detection of both polarizations at the output of a Glan
polar-izer.14 Permanent tracking of Q
1 and Q2 with a
mi-crocontroller makes possible accurate knowledge of t2
at any time. Even though the smallest time step along this visible t2interferometer is ldiode兾c, since the
cen-tral wavelength and the bandwidth of the Ti:sapphire are well known, this system allows an optimal rate of sampling.
As a test of the technique and of the experi-mental setup, we measured the nonlinear response J共2兲共v
2,v3兲of AgGaS2, a birefringent crystal that can
be phase matched for mid-infrared generation through difference-frequency mixing. The crystal is cut at f 苷 45±
and u 苷 47± for type II phase matching. In
this case the nonlinear response is J共2兲共v2,v3兲 苷 exp关iko共v1兲L兴 v2 1 4c2k o共v1兲 3 x共2兲共2v 1;v3,2v2兲 ∑ exp共iDkL兲 2 1 Dk ∏ , (3)
where ke共0兲共vj兲is the amplitude of the wave vector at
the frequency vj along the extraordinary (ordinary)
Fig. 1. Experimental layout: Black rectangle, 500-mm-thick AgGaS2 sample 共f 苷 45±, u 苷 47±兲; white rectangle,
100-mm-thick 具110典 GaAs sample; PZT, piezoelectric transducer; GP, Glan polarizer; MCT, mercury cadmium telluride infrared detector; Qi, ti, see text. Inset, po-larizations of the exciting visible pulse sequence and the emitted mid-infrared field.
November 15, 2002 / Vol. 27, No. 22 / OPTICS LETTERS 2045
Fig. 2. (a) jJ共2兲共v
2,v1兲E1共v1兲E2共v2兲E3共v21 v1兲j
frequen-cy dependency as determined by a
two-dimen-sional Fourier transform of the experimental data 共t1from
2426.9 to 426.9 fs in dt1苷 6.67 fs increments; t2 from
2285.4 to 285.4 in dt2 苷 4ldiode兾c 艐 8.9 fs increments).
(b) Theoretical results for jJ共2兲共v
2,v1兲E1共v1兲E2共v2兲E3共v21
v1兲j, assuming that E2 and E3 are 35-THz Gaussian
cen-tered around 375 THz. (c) Comparison between (solid line) the phase-matching slope calculated from the re-fractive indices of AgGaS2 and (crosses) the experimental
maxima of map (a). These maxima are determined through a parabolic f it of cuts of the two-dimensional map for each value of v2, which results in a resolution far
better than dv1.
axis and Dk 苷 ke共v3兲 2 ko共v2兲 2 ko共v1兲. For this
proof-of-principle experiment, as the crystal has no resonance in the spectral domain under study, J共2兲 is
dominated by the bracketed term of phase matching, which serves as a model two-dimensional nonlinear response.
The two visible exciting pulses are polarized each along one of the crystal axis (see the inset of Fig. 1) so that the mid-infrared emission results from only the cross term we are seeking and not from each individual pulse. Note that the use of different polarizations on
the two beams breaks the symmetry between v2and
v3: Phase matching can be achieved here only when
v3. v2. The magnitude of J共2兲共v2,v3兲is plotted in
Fig. 2(a) as a function of v1苷 v32 v2and of v2. As
expected, the obtained result is dominated by phase matching and exhibits several oscillations of the sinc function.
The jJ共2兲共v
2,v3兲jmap can be simulated with no
ad-justable parameter by use of Eq. (3) [see Fig. 2(b)]. The good agreement between theory and experiment [Fig. 2(c)] demonstrates the validity of the technique.
Although the precision of the 10-mm t1
interferome-ter should be more than ten times less critical than the precision of the 800-nm t2 interferometer,
inaccu-racies in t1have measurable effects and result in the
aliased ghosts along v2 that can be seen in Fig. 2(a).
Passive stabilization and control of t1is thus the next
step toward analysis of more-complicated samples for retrieval of full real and imaginary information of J共n兲.
To summarize, multiple-pulse nonlinear
spec-troscopy disentangles overlapping contributions to
a complex emission by spreading them along one or more additional axes, thus characterizing the emitting sample. The retrieved multidimensional map (or its projection) of the nonlinear response gives precious insight into couplings between energy levels. In our demonstration of two-dimensional Fourier-transform visible– infrared measurement of a phase-matched
AgGaS2 sample, we took special care to ensure
ac-curate and optimal sampling of our temporal data. This technique could be useful for understanding a molecular system such as a protein complex in which electronic (visible) excitation of an optically active cofactor sets vibrational dipoles in a coherent oscilla-tion.15 It might also prove especially enlightening in
the study of quantum wells in which the one dimension of visible frequencies is related to the interband tran-sitions (hence to the wave vector), whereas emission that is due to intersubband transitions is along the other axis in the infrared spectral domain.
We acknowledge the decisive assistance of X. Soli-nas in the fabrication of the fringe-counting device and thank B. Bousquet, L. Canioni, and J.-P. Likfor-man for the original phase-locking system. We are grateful to G. Guelachvili for suggesting the dual-quadrature fringe-counting technique used in the experiment. We also thank James Fraser for his criti-cal reading of the manuscript. N. Belabas’s e-mail address is [email protected].
References
1. L. Lepetit and M. Joffre, Opt. Lett. 21, 564 (1996). 2. A. Tokmakoff, M. J. Lang, D. S. Larsen, G. R. Fleming,
V. Chernyak, and S. Mukemel, Phys. Rev. Lett. 79, 2702 (1997).
3. O. Golonzka, M. Khalil, N. Dermidöven, and A. Tok-makoff, Phys. Rev. Lett. 86, 2154 (2001).
4. W. Zhao and J. C. Wright, Phys. Rev. Lett. 84, 1411 (2000).
5. M. C. Asplund, M. T. Zanni, and R. M. Hochstrasser, Proc. Natl. Acad. Sci. USA 97, 8219 (2000).
6. P. Hamm, M. Lim, W. F. DeGrado, and R. M. Hochstrasser, Proc. Natl. Acad. Sci. USA 96, 2036 (1999).
7. J. D. Hybl, A. A. Ferro, and D. M. Jonas, J. Chem. Phys.
115,6606 (2001).
8. R. R. Ernst, G. Bodenhausen, and A. Wokaun,
Prin-ciples of Nuclear Magnetic Resonance in One and Two Dimensions (Oxford U. Press, Oxford, 1997).
9. L. Lepetit, G. Cheriaux, and M. Joffre, J. Opt. Soc. Am. B 12, 2467 (1995).
10. A. W. Albrecht Ferro, J. D. Hybl, S. M. Gallagher Faeder, and D. M. Jonas, J. Chem. Phys. 111, 10934 (1999).
11. C. Dorrer, N. Belabas, J.-P. Likforman, and M. Joffre, J. Opt. Soc. Am. B 17, 1795 (2000).
12. A. Bonvalet, J. Nagle, V. Berger, A. Migus, J.-L. Mar-tin, and M. Joffre, Phys. Rev. Lett. 76, 4392 (1996). 13. N. Belabas, J.-P. Likforman, L. Canioni, B. Bousquet,
and M. Joffre, Opt. Lett. 26, 743 (2001).
14. K. Naganuma, K. Mogi, and H. Yanada, IEEE J. Quan-tum Electron. 25, 1225 (1989).
15. M.-L. Groot, M. H. Vos, I. Schlichting, F. van Mourik, M. Joffre, J.-C. Lanbry, and J.-L. Martin, Proc. Natl. Acad. Sci. USA 99, 1323 (2002).