Official URL
https://doi.org/10.1145/3313831.3376749
Any correspondence concerning this service should be sent
to the repository administrator:
[email protected]
This is an author’s version published in:
http://oatao.univ-toulouse.fr/26331
Open Archive Toulouse Archive Ouverte
OATAO is an open access repository that collects the work of Toulouse
researchers and makes it freely available over the web where possible
To cite this version: Brulé, Emeline and Tomlinson, Brianna
and Metatla, Oussama and Jouffrais, Christophe and Serrano,
Marcos Review of Experimental Evaluations Methods of
Technology for Visually Impaired People.
(2020) In: ACM
International Conference on Human Factors in Computing Systems
(ACM CHI 2020), 24 April 2020 - 30 April 2020 (Honolulu,
Hawai, United States).
Review of Quantitative Empirical Evaluations of Technology
for People with Visual Impairments
Emeline Brulé
Brianna J. Tomlinson
Oussama Metatla
University of Sussex
Georgia Institute of technology
University of Bristol
Falmer, UK
Atlanta, Georgia, US
Bristol, UK
[email protected]
[email protected]
[email protected]
Christophe Jouffrais
Marcos Serrano
CNRS IRIT, Uni. of Toulouse
IRIT, Uni. of Toulouse
Toulouse, France
Toulouse, France
[email protected]
[email protected]
ABSTRACT
Addressing the needs of visually impaired people is of contin-ued interest in Human Computer Interaction (HCI) research. Yet, one of the major challenges facing researchers in this field continues to be how to design adequate quantitative empirical evaluation for these users in HCI. In this paper, we analyse a corpus of 178 papers on technologies designed for people with visual impairments, published since 1988, and including at least one quantitative empirical evaluation (243 evaluations in total). To inform future research in this area, we provide an overview, historic trends and a unified terminology to de-sign and report quantitative empirical evaluations. We identify open issues and propose a set of guidelines to address them. Our analysis aims to facilitate and stimulate future research on this topic.
Author Keywords
Assistive Technology, Visual Impairments, Literature Review, Evaluation Methods, Experiments, Education
INTRODUCTION
Research in Human-Computer Interaction (HCI) on assistive technologies for people with visual impairments (PVI)1is an 1Participant s can be referred to using person-first or disability-first language. The re are many debates regarding which one is best prac-tice [30, 70, 21]. We use people with visual impairments which was preferred by a majority of authors and PVI as an abbreviation.
DOI:https://doi.org/10.1145/3313831.3376749
ever growing domain with the general goal of improving ac-cessibility as a means for addressing broader societal issues of equality, diversity and inclusion. Research on technologies for PVI spans a variety of application areas, such as education, entertainment and mobility [12], and investigates the potential of novel interaction techniques, including tactile display (hap-tics and vibratory feedback) [74], auditory display (verbal and non-verbal feedback) [8, 51, 75], tangible interaction [26, 18], and sensory substitution [47, 31]. However, designing and con-ducting adequate quantitative empirical remains a challenge, an issue also noted in the field of education sciences [42]. For instance, a literature review by Kelly and Smith [42] found that less than 10% of educational technologies for visually impaired children underwent some form of quantitative em-pirical evaluation. A 2018 workshop on inclusive educational technologies for PVI [52] identified the lack of overview and guidelines on evaluation practices as a barrier for developing novel technologies. To address this challenge, it is important for the HCI community to understand existing practices. Yet, to date, no survey addresses the evaluation of technologies and interaction techniques for PVI in HCI.
Quantitative empirical evaluation methodologies are popular, if not considered a gold standard, in the field of HCI [10, 46]. However, these are usually difficult to implement when working on technologies for PVI. Common challenges in-clude heterogeneous participant profiles, limited availability of participants, and deciding how and when to include sighted participants in evaluations [9]. Hence, we address the follow-ing research question: What is, at present, best practice in
quantitative empirical evaluations of technologies for people with visual impairments in HCI?Providing answers to this
question will not only guide researchers in this area to devise and carry out appropriate quantitative evaluations, but will also allow for a more informed and uniform approach to reviewing them in scientific publications.
To answer this question, we developed three secondary re-search questions: RQ1: Are there common standards for
con-ducting quantitative empirical evaluations of technologies for PVI; if so, what are they?; RQ2: Overall, are participants in
these evaluations representative of the target population?; and RQ3: What are the difficulties encountered by researchers in this type of evaluation?
We focused on papers reporting practices of quantitative eval-uations in top-tier venues (i.e., CHI, ASSETS, TOCHI, and TACCESS). Our final corpus includes 178 papers published since 1988, each involving one or more quantitative empirical evaluations (243 experiments in total). We tagged these papers before analysing: (1) the design of these evaluations and how they are used; (2) the representativeness of the participants in-volved in the evaluations in this corpus; and (3) the difficulties reported by authors.
Overall, we found a large variety of accepted practices for eval-uation, which could lessen integration of findings over time and interdisciplinary application. We highlight concerns re-garding the quality and details in reporting evaluations and the representativeness of the participant sample. We propose a set of recommendations for addressing these concerns, including using shared standards for describing participants with visual impairment and borrowing other quantitative approaches to evaluation from connected fields such as rehabilitation and special education research.
BACKGROUND
Surveying evaluation approaches supports the establishment of best practices in research, helps maintain consistency in the review processes, and builds a strong and coherent body of scholarship [46]. However, to date, there are no surveys focused on quantitative empirical evaluations of technologies and interaction techniques for PVI, despite the large domi-nance of this type of evaluations in HCI venues such as the field’s flagship conference, ACM SIGCHI Conference on Hu-man Factors in Computing Systems (CHI) [10]. This is espe-cially crucial as previous work has long reported challenges specific to evaluation with this user group (e.g., [72, 27, 23]).
Quantitative empirical evaluations in HCI
By quantitative empirical evaluation, we refer to Barkhuus and Rode [10]’s classification of evaluation methods at CHI: quantitative refers to the type of measures taken (e.g., number of errors or time to accomplish tasks) and empirical means the evaluation involves users directly (instead of experts, as in the case in analytical evaluation such as heuristic evaluation). Quantitative empirical evaluations are largely considered a gold standard in HCI [10].
A quantitative empirical evaluation is the study, generally task-based, of a given device, technique, or system. It aims at objectively measuring its usability and usage by users, or exploring the extent to which a technology is beneficial com-pared to previous similar propositions (independent variables) [46, 59, 50]. These measures (dependent variables) are proxy for performance (e.g., speed) or subjective experience (e.g., preference). Within research, they can be formative (i.e., in-form an improved or final iteration of a system design); or summative (i.e., used as a proof of validity and adequacy of a proposed system), and either can become the basis for creating an improved design [65]. Completion of statistical tests can
confirm the trustworthiness of the results for a larger popula-tion. These evaluations often include qualitative questions. Scholars have raised three main concerns about this type of evaluation: (1) there needs to be more transparency in the reporting and validity of experiments in light of practices such as ‘p-hacking’ (the lack of consideration of effect sizes and confidence interval or similar practices) [24]; (2) they are not necessarily representative of the larger user population [10, 67]; and (3) they do not provide a holistic picture of peoples’ understanding of a system in context [34, 71, 44]. This might, for instance, lead to discarding forward-thinking technology containing usability issues that could be resolved later [34], or to missing what is important to marginalised users because they focus on restrictive measures of subjective experience [71, 44]. The above concerns suggest that a review of quantitative evaluation in HCI should be concerned with (1) assessing current practices and standards for reporting evaluations, to highlight areas for improvement; (2) assessing the extent to which participants are representative of the target population; and (3) examining the challenges and limitations mentioned, to reflect on potential ways forward. It is in light of this characterization that we formulated the three previously-stated secondary research questions that we used to focus our survey of quantitative evaluation methods: RQ1: Are there common
standards for conducting quantitative empirical evaluations of technologies for PVI; if so, what are they?; RQ2: Overall, are participants in these evaluations representative of the target population?; and RQ3: What are the difficulties encountered by researchers in this type of evaluation?
Evaluating with and for People with Vision Impairment
There are rising concerns in the accessibility community that few technologies are thoroughly evaluated, let alone in useful contexts or with the relevant user group, such as children (e.g., [42, 31, 19, 29]). Recent initiatives to address this issue were aimed at building community resources on this topic [19] or developing alternative quantitative evaluation approaches that are easier for researchers to conduct [42]. This is a two-way problem: if not properly evaluated and iterated on, technologies risk being rejected when commercialized [31]. If few prototypes are publicly available, it is difficult to assess their impact on practices in the field.
A first difficulty for evaluating technologies with PVI are the low numbers of participants, particularly children. According to the World Health Organisation (WHO) [57], prevalence of visual impairments is estimated between 0.2 and 3% in Western Europe and North American countries, with 90% of visually impaired people worldwide living in low-to-middle income countries [4]. Blindness is a small (7%) subset of visual impairments, and the vast majority of cases of visual impairments (65 to 82%) occur after the age of 50. More-over, PVI may be solicited often by researchers, limiting their availability. Consequently, many experiments use blindfolded sighted participants instead. Bardot et al. [9] list three experi-mental evaluation approaches involving participants who are sighted and visually impaired: (1) mixed group for all experi-ments, which has to account for differences in performance; (2) formative experiments with a group of sighted blindfolded
participants to reduce the number of alternatives to test, and a summative experiment with PVI; and (3) a single evaluation with a small group of PVI. The authors note that this third option is generally perceived as inadequate for evaluating per-formance due to the small sample size, making it necessary to include sighted participants (i.e., option (1) or (2)). The adequacy of this practice is debated, both on validity [67] and political grounds, with concerns that disability simulation neg-atively affects the perception and representation of disabled people [11].
A second difficulty is the lack of shared evaluation frameworks or adapted evaluation tools [61, 19, 27]. Previous research suggests interaction laws [27], usability questionnaires [61], and procedures (e.g., length [9]) need to be adapted to PVI. It also suggests that we need more homogenised experimental designs for evaluating typical technologies (e.g., for common contexts, like indoor navigation [29, 40]).
A final difficulty comes from the sample of participants: het-erogeneity in terms of visual abilities, age of onset, associated impairments, access to education, type of assistive technology used [21] and previous experience with visual concepts[72]. This heterogeneity makes it difficult to have an adequate con-trol group [52, 42, 18]. To address this issue, some scholars call for alternative approaches to experimental design, such as single-subject experiments [42]. Even though the above challenges have been acknowledged in the community, to our knowledge, there are no systematic surveys that provide a de-tailed overview of reported difficulties, accepted best practices in quantitative empirical evaluations, nor guidelines for the way they are, or should be used in practice.
What can we learn from a literature review?
There are two approaches to completing literature review pa-pers: systematic and narrative [22]. Systematic literature reviews aim at achieving unbiased, complete and reproducible overviews of a given research field [43]. They attempt to eliminate biases in the selection of papers included by meticu-lously describing the search and selection process, and they provide a quantitative summary of the papers found. However, the extent to which any literature review can be unbiased and complete is unclear due, for instance, to technical limitations of database searches [15]. Narrative literature review focus on developing a critical theoretical understanding of a field at a given time (e.g., [14]). We took a systematic approach, on which we reflect critically.
LITERATURE REVIEW APPROACH
The purpose of this systematic literature review is to identify best practices for quantitative empirical evaluations with PVI (RQ). We structured our process following recommended prac-tices for systematic reviews: search, study selection, data ex-traction, data analysis, and interpretation [43]. We then aimed to understand these best practices by (1) studying the main characteristics of these experiments and their participants; (2) identifying potential gaps in their design or reporting; and (3) discussing ways forward.
Search strategy and query
We first conducted a Scopus search across different publishers (IEEE, ACM, etc). This is described in supplementary ma-terial. However, this corpus missed many publications that did not explicitly discuss evaluation in the abstract. Moreover, it was very heterogeneous in terms of writing styles, length and structure. We thus decided to focus on ACM SIGCHI Conference on Human Factors in Computing Systems (CHI) and the ACM SIGACCESS Conference on Computers and Accessibility (ASSETS), as well as their associated journals: ACM Transactions on Computer-Human Interaction (TOCHI) and ACM Transactions on Accessible Computing (TACCESS). These are largely considered premier venues for HCI publica-tions [1], and focusing on a limited number of well-recognised publications in which this type of evaluation is popular [10] and is a strategy previously used by similar literature reviews (e.g., [46, 58, 36]). Our aim is not to derive best practices for all types of evaluation from this corpus: many other well-recognised venues may favour different evaluation approaches and epistemologies [71]. However, given empirical quantita-tive evaluations are a well-recognised approach to evaluation across the field of HCI [10], standards for their conduct and publication would benefit all publication venues.
We searched the proceedings of the publications listed above, using a request consisting only of the keywords for “visual impairments” on Scopus. The search yielded 821 results. In contrast with the preliminary study, we did not include technology keywords since they are implicit to HCI. Nor did we include the evaluation keywords as we filtered out papers manually. The main search string is below; the full string restricting the search to the publications listed above can be found in supplementary material:
TITLE-ABS-KEY(blind OR "deaf blind" OR deafblind OR deaf-blind OR "eye disorder*" OR "partially sighted" OR "vision disorder*" OR "visual disabilit*" OR blindness OR "visual impairment*" OR "visually impaired" OR "partial vision")
Study Selection
We performed two rounds of study selection: (1) the first round included papers based on their abstracts, and (2) the second round included papers based on whether they reported a quantitative empirical evaluation.
First exclusion process:One researcher (five years of experi-ence in this area) read the abstracts of the 821 papers to select studies likely to include a quantitative empirical evaluation. She included 298 papers and excluded 523 papers. In cases where the type of evaluation is not specified within the abstract, the papers were included.
Papers were excluded for the following reasons. The first set were out of scope (n=198), and either included systems or technology not intended for PVI, or papers reporting using only non-quantitative types of evaluation (e.g., qualitative, technical evaluation of algorithm accuracy). Papers that were not full papers were also excluded (n=324): we did not include posters, workshop papers, late-breaking work, or short papers. This is because the reporting of experiments have too much discrepancy (often involving a lack of detail compared to full
papers). Finally, duplicate papers were excluded (n=1). See Supplementary material for the corpus at this stage.
Second exclusion process:The second exclusion was shared among the authors (between 5 and 20 years of experience of working on technologies for PVI): each was assigned between 40 and 80 papers to review and code. During this process, authors excluded 120 papers. Papers were excluded because they were out of scope (n=63); they only reported qualitative evaluation(s) (see 3.4 for a discussion of mixed quantitative and qualitative evaluations); they were short papers (n=46); they did not meet requirements for reported information (n=10) (e.g., papers in which there was too much missing data about the evaluation); or they were duplicate papers (n=1). At the end of this second exclusion process, there were 178 papers remaining in the corpus.
Data coding and cleaning
The corpus was reviewed by the five authors. We first coded data describing the participants and evaluations from five pa-pers. This enabled verifying expectations were aligned and that the data extracted was suitable for addressing the research questions. We could not find a model for the type of data to extract for this analysis. Instead, we developed the following reporting form through discussion and iteration:
• Mode of interaction (e.g., visual enhancement, tactile, tan-gible, gestures);
• Application area (e.g., navigation and walking, techniques to access GUIs, education);
• Number of quantitative empirical evaluations and of studies: to identify whether evaluations are used in concert with other evaluation methods or in isolation, as well as the number of evaluations per paper;
• Per evaluation: the description of its purpose, number and reported characteristics of participants, length and context, measures (dependent variables), aim of the evaluation (mea-suring: primarily performance; performance with subjec-tive experience; or primarily subjecsubjec-tive experience), the statistical tests used, presence of qualitative questions, dif-ficulties mentioned by the authors and whether the coder estimates being able to reproduce the evaluation. These data enabled understanding of whether participants were representative of the larger visually impaired community, uncovered shared standards (such as the statistical tests used), and identified encountered difficulties;
• Whether and how sighted participants were involved. We carried out a verification process, during which an au-thor read and extracted data from one paper for each year of publication in the corpus. She found no issue with the data extracted, but homogenized the way missing data was reported. For instance, coders had used “n/a,” “0” or “not reported” al-ternatively to indicate absence of data. We also produced two documents for data processing and analysis: one with one paper per line and every quantitative empirical evaluations it includes, and one with one evaluation per line.
Challenges in the selection and coding process
The structured description was initially more extensive, includ-ing the type of p-values used (when used), number of tasks,
precise description of visual impairments measurements, in-dependent variables, etc. However, we found that even recent papers did not provide all these details, which we discuss be-low. Moreover, the coding process revealed that the difference quantitative and qualitative evaluations can be thin. One re-current debate regarding the inclusion of papers in the corpus was how to handle papers using an experimental setup for evaluation, reporting some quantitative measures but focus-ing primarily on qualitative results. We decided to include them, since there are no guidelines describing the minimum number of quantitative measures a paper should include, and using a narrow definition of quantitative experiments would have excluded many older studies. They also share evaluation constructs: experience and performance, whereas qualitative evaluations may look at different aspects. For instance, we included [32] which measured time and task success, but oth-erwise evaluated usability qualitatively; but we did not include Linespace because it presented only subjective usability feed-back, reported thematically [73]. Two of the five authors also included qualitative evaluations reporting Cohen’s kappa for inter-rater reliability and included a coding sheet, because the results were quantifiable. We decided not to include them, since the evaluation constructs were different. A last discrep-ancy between coders was the inclusion of pilot studies if they are mentioned but not described. We included them, as this is precisely a practice that we would benefit from understanding. In summary, this approach favors homogeneity of evaluation constructs.
Analysis and Interpretation
The analysis was conducted using Excel and SPSS. We first cal-culated descriptive statistics to summarize each of the tagged aspects of evaluations for the entire corpus. We analysed values over the whole corpus before looking at trends by pub-lication year to assess whether our findings were still represen-tative of practices. When high heterogeneity was found (high standard deviation), we examined outlying papers to provide an explanation. We also propose a typology of papers and of how sighted participants are included in these evaluations based on the data. To interpret these results, we leveraged the works from the Background section to make recommendations for future work. The aim is to contextualise this work within current concerns about evaluation in HCI.
OVERVIEW OF THE CORPUS
Before reporting on evaluations, we describe the corpus in terms of number of papers per venue and year of publication, areas of application, and interaction modalities involved.
Paper origin
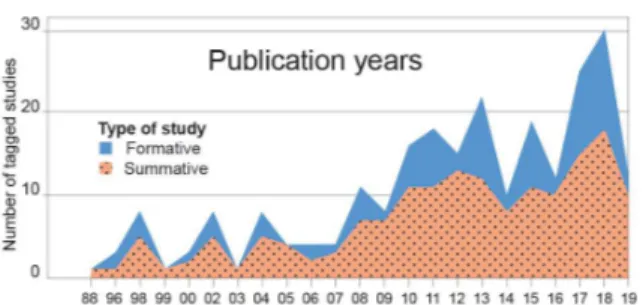
Among the 178 tagged papers, 50 had been published at CHI, 98 at ASSETS, 6 at TOCHI, and 24 at TACCESS. The publica-tion year ranges from 1988 to 2019, with an increasing number of papers per year. This parallels the overall increase in the number of papers published in these venues, but also includes the higher rate of excluded papers in the 1990s, as quantitative empirical evaluations were less of a standard (Figure 1).
Figure 1. Number of evaluations in our corpus per year according to their type (formative or summative).
Area of application
In the initial coding sample, we included activities that pa-pers stated they aimed to enable or ease (such as navigation or education, following Hersh’s classification [38]). We ex-panded these categories when needed (e.g., gaming) and added technical categories for papers about systems and techniques that could be used in a variety of activities (e.g., GUIs in non-mobile contexts, non-mobile devices, or XR environments). Some papers belong to several categories, which is why percent-ages do not add to 100%.Reported percentages are rounded up to the nearest tenth decimal place.
The primary investigated application area is web browsing (n=43, 24.2%). Second was education and mobility (n=26, 14.6% each). The next two were technical categories: in-teraction with mobile screens (n=21, 11.8%) and access to traditional GUIs (n=16, 9%). This confirms a recent system-atic literature review on the type of technologies currently being designed for PVI [12]. Rarer application areas include: data-visualisation and graphs (n=8, 4.5%); gaming, reading and writing, and daily life tasks (n=6, 3.4% each); access to shape and images, and object-finding; research on XR en-vironments (n=5, 2.8% each); photography and sports (n=4, 2.3% each); rehabilitation and supporting collaboration (n=3, 1.7% each); coding or learning to code, access to videos, and smart home control (n=2, 1.1% each); and drawing images, producing accessible content, and in-person communication (n=1, 0.6% each).
Interaction modalities
Similar to the coding of the system, we initially considered 8 types of interaction modalities: speech (n=102, 57.3% of papers), non-speech audio (n=57, 32%), tactile (n=41, 23%), changes to the type of data or its structure (e.g. generating captions automatically, n=25, 14%), vibratory haptics (n=18, 10.1%), tangible interaction (n=17, 9.6%), force feedback hap-tics (n=14, 7.9%), and others. Papers in the “others” category were grouped initially; we later added the following categories: visual enhancement (highlight, zoom, etc., n=10, 5.6% of pa-pers), keyboard input (n=5, 2.8%), visual (some evaluation aiming at understanding the suitability of visual interfaces for people with remaining visual abilities) and gestures (n=2, 1.1% each). Audio-based interaction clearly remains the primary approach for accessibility to this group, poten-tially due to its availability on most digital devices.
ARE THERE STANDARDS FOR CONDUCTING QUANTITA-TIVE EMPIRICAL EVALUATIONS?
In this section, we provide an overview of the paper struc-tures and of the evaluation designs to answer RQ1: Are there
common standards for conducting quantitative empirical eval-uations of technologies for PVI; if so, what are they?
Number of experiments and studies per paper
Within the 178 tagged papers, 125 (70%) papers reported only one quantitative empirical evaluation, 41 (23%) papers reported two, and 12 (7%) reported three (i.e., we analysed 243 evaluations in total). There is a large variety in the evalu-ations being conducted and their use. We look more closely at the type of papers in which they are used. Papers can present a novel technology and its evaluation, which Wob-brock:2016:RCH:2930854.2907069 [84] describe as an
Arti-factcontribution to HCI. Or they focus on evaluation, making
an Empirical Research contribution.
Within papers presenting an Artifact contribution:
• 80 papers (44.9%) presented only one summative quantita-tive evaluation, while 6 papers presented several summaquantita-tive evaluations. This was generally because they distinguished between two groups (sighted and visually impaired, e.g., [60]) or settings (lab and field, e.g., [62]);
• 30 papers (16.9%) presented at least one formative and one summative quantitative evaluation. This appears to be more prevalent with time (sparse before 2008, at least one per year after 2008). These formative experiments often focused on choosing between several interaction techniques (e.g., [25]) or on ranking ways to present information (e.g., crowdsourced comparison in [28]);
• 5 papers (2.8%) reported a summative quantitative evalua-tion with a pilot study (e.g., [3]) but were not described in much detail past informing the final design.
• 21 papers (11.8%) presented qualitative formative studies or evaluation and summative experiment(s) (e.g., [80]). This is also a fairly recent type of paper (only two were published before 2008).
Taken together, the use of multiple studies and evaluations could show a trend towards a more iterative, user-centered, design processes. This could also suggest an adaptation to cri-tiques about conducting evaluations with sighted participants, criticism of this practice are fairly recent. Finally, it could also suggest a rise in interdisciplinary and hybrid approaches: • 11 papers (6.2%) presented only formative quantitative
eval-uations. In some cases they provided a second design it-eration within the same paper (e.g., [78]) or in a separate evaluation published later (e.g., [79]). This small number could be due to the community focus for including evalu-ation as part of the design process, instead of publishing entirely design-focused papers;
• 4 papers (2.2%) presented a qualitative and a quantitative summative evaluation (e.g., [77]). They were all published after 2015. In addition, 118 experiments (48.5%) were tagged as including qualitative questions. This could sug-gest a rise in hybrid approaches to evaluation;
• 6 papers (3.4%) presented analytical formative studies and evaluations (e.g., benchmark or technical evaluation not involving human participants).
Finally, an empirical quantitative evaluation can be the focus of a paper, and inform us as much about technologies as they do about users (n=15). For instance, [76] used such an evaluation to make a methodological contribution, and [54] examined the usability of phones with a theoretical aim.
Study length and context
Study length was not consistently reported. We were able to report it in 102, or 42% of, evaluations. When a time range was reported, we calculated the average. Four evaluations (1.6% of all evaluations) were conducted over periods superior to four days and up to two weeks long. For lab-based evaluations, the average length of en experiment is 89 minutes (median=66, min=10, max=360, stdev=70). For context, we found advice in the literature that evaluations should be shorter to avoid fatigue (e.g., [9] recommends to keep them under 60 min). There is a high heterogeneity in the length of lab-based evaluations, and a very small percentage of long-term evaluation. Context is not often explicitly reported and discussed, unless the experiment took place outside of a lab study. During data extraction, we assumed that when it was not reported, the experiment was conducted in an academic office or lab. In 45 cases (18.5% of evaluations), the experiments were conducted in a different type of space: online or remotely (n=14, 5.8% of all evaluations), everyday life settings (n=13, 5.3%), and in relevant public settings such as airports (n=8, 3.3%), schools (n=6, 2.5%), community spaces (e.g., the NY Lighthouse; n=3, 1.2%), and libraries (n=1, 0.4%). We can conclude quantitative empirical evaluations are primarily conducted in non-realistic settings.
Validated questionnaires
We reported whether evaluations used standardized question-naires to investigate usability: 23 evaluations did so (9.5%). These validated questionnaires are primarily for measuring subjective experience. This includes the System Usability Scale (SUS, n=9, 3.7% of all evaluations, [7]) and the User Experience questionnaire (UEQ, n=2, 0.8%, [66]). Used a single time (or in 0.4% of evaluations each) were the Design Oriented Evaluation of Perceived Usability (DEEP, [85]), the Software Usability for Blind Children Questionnaire (SUBC, [61]), the Single Use Question (SUQ, [63]), and the Positive and Negative Affect Schedule (PANAS, [81]). Domain spe-cific questionnaires were used, including the Robotic Social Attributes Scale (RoSAS, n=1, 0.4%, [20]) and the Igroup Presence Questionnaire (n=1, 0.4%, [83]). Some papers re-ported adapting Nielsen’s heuristics [53] or Shneiderman’s golden rules [68] as the basis for subjective experience ques-tions and Likert scales. Finally, eight studies (3.3%) used the NASA-TLX test for cognitive workload [37]. Overall, there does not seem to be a standard shared set of tools and measures.
Measures
We coded for three types of measures: primarily task per-formance (n=145, 59.7%), task perper-formance and subjective
experience (n=69, 28.4%), and primarily subjective experi-ence (n=29, 11.9%). Although the majority of papers fo-cus on performance, a significant number of usability ex-periments focus on subjective experience, through measure-ments such as preference and perceived difficulty.
Statistical tests
We found that 143 evaluations (59.7%) used a statistical test to validate their results (twelve, or 4.9%, used descriptive statistics). The most common tests are from the ANOVA (n=64, 26.3%) or t-tests (n=33, 13.6%) families, followed by Wilcoxon (n=26, 10.7%). Many of the experiments without statistical tests are pilot studies, and others focus on subjective experience with quantitative measures. If we look at papers with only summative experiments, the number of papers using a statistical test raises to 67%. Hence, although it is a practice used by a majority of the papers, many others only report only numerical values. One reason provided is that the sample size of participants is too small (e.g., [13]).
Quality metrics
In addition to the exclusion of papers with inconsistent report-ing or very little detail, we tagged (0 or 1) whether experiments were missing information that would make duplicating the ex-periment difficult. This code was used at the discretion of the coders. The coders looked for incomplete description of tasks, experiment design, and measures. Coders expressed this lack of detail for 39 evaluations (16%). This does not appear to have decreased significantly through time (it represents 15% of evaluations between 2015 and 2019). This is concerning, es-pecially as many more papers could prove difficult to replicate in practice.
Answering RQ1
Overall, these findings suggest that the most common type of paper is one that presents a new system followed by a summa-tive quantitasumma-tive empirical evaluation (lab-based, measuring primarily performance, using a statistical test). It could be described as a standard. However, papers with formative stud-ies and evaluations are becoming ever more common, with a large variety in the type of methods used. This could suggest an evolution towards more user-centered and iterative work (which might not be specific to assistive technologies for PVI), as well as better recognition of qualitative perspectives. We note, however, that very few papers were evaluated quantita-tively in real settings and that there are concerns regarding reproducibility, which could weaken validity [44].
REPRESENTATIVENESS OF PARTICIPANTS
In this section, we analyse the characteristics of the partici-pants involved to answer RQ2: Overall, are participartici-pants in
these evaluations representative of the target population?We
also propose a typology of how sighted participants are in-volved in evaluations.
Number of participants per evaluation
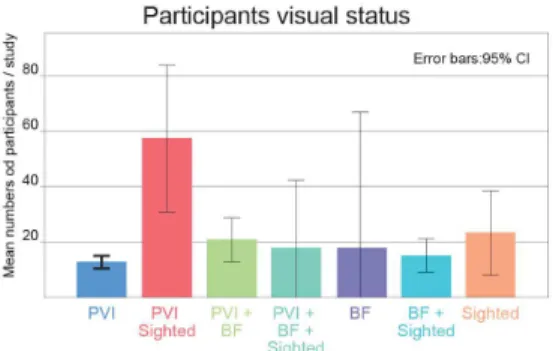
The average number of participants per evaluation was 22.3 (median=12, min=1, max=453, stdev=41.7). The number of participants varied with the type of evaluation. In forma-tive evaluations, the average number of participants was 32.8
Figure 2. Mean number of participants according to the participants’ visual status.
(median=12.4, stdev=64.1), as opposed to summative studies, where the number is 17.1 (median=11.8, stdev=23.1). The number of participants decreases according to the position of the experiment in the paper (as usually formative exper-iments are presented before summative ones): 24.5 for the first experiment (median=12, stdev=46.9), 17.3 participants for the second experiment (median=10, stdev=23.5), and 10.9 participants the third experiment (median=7, stdev=22).
Visual status of participants
Over the 243 experiments of our corpus, 208 (85.5%) included people with VI, 35 (14.4%) included blindfolded people, and 63 (25.9%) included sighted people (not blindfolded). Surpris-ingly, 3 papers did not report whether participants had visual impairment or not. Among the 208 studies with PVI, only 144 of them (59.2% of the corpus) did exclusively involve PVI. For experiments that only involved PVI, the average number of participants was 12.66 (median=9.67, stdev=11.8), while for studies that did not involve PVI, the average number was 14.9 (median=13, stdev=44.5). Those that used only blinfolded participants had 23.1 (median=14, stedv=24.6) participants on average; when participants were a combination of blindfolded and non-blindfolded sighted people (which only occurred for two studies) evaluations had 16 (median=16, stedv=5.6) par-ticipants on average. This is illustrated in Figure 2.
When looking at the distribution of the visual status of par-ticipants according to the type of study (see Figure 3), we observed that formative experiments more often involved blindfolded and sighted participants (n=44, 56% of for-mative studies), while sumfor-mative experiments more fre-quently involved exclusively PVI (n=112, 69% of summa-tive studies).
Concerning the type of visual impairment, 104 evaluations involved participants with non-specified visual impairments or severe visual impairments, 41 involve people who are legally blind, and 156 completely blind. Note that due to the absence of shared standards for reporting(here, we used the WHO typology [57]), some subjects may have been misclassified. Among the 243 experiments, only 53 (21.8%) reported (at dif-ferent levels of precision) the age of onset, 12 (4.9%) reported the causes of blindness, and only 6 (2.4%) reported other
Figure 3. Number of experiments according to the participants visual status and type of experiment (formative or summative).
types of impairment such as hearing impairment, intellectual disability, or limited mobility.
Age and gender
The age of participants was not consistently reported, but the majority of studies provided a median estimation. When data about every participant was available, we determined the median ourselves. When only a range was provided, we used the average.
The median age of participants was 37 years old (min=9, max=80). This median age was clearly higher for partici-pants with vision impairment (38.3 years old) compared to sighted participants (29.6 years old).
Regarding gender: 65 experiments did not report this demo-graphic. In papers that did report on it, men were more fre-quently involved in research than women (12 vs. 9.3 partic-ipants/evaluation). Across the entire corpus, the gender of three participants was reported as “other”2, which we have
to presume means non-binary and two did not disclose their gender.
Additional information
Beyond basic demographics, we identified four additional cat-egories of information provided by authors (in 140 evaluations or 57.6%): technology usage (smartphone, computer, screen reader, etc.); expertise (braille, mathematics, musical, etc.); health-related information (visual and hearing acuity, health problems, etc.); and education (background). This suggests researchers are overall aware of the heterogeneity of par-ticipants’ profiles, although there is no standard model for what to report[21].
Use of sighted participants
As noted above, sighted participants are often involved in eval-uations (30% of the experiments in our corpus). We systemati-cally tagged how sighted users participated in experiments: • Comparison.When the performance of the two groups are
evaluated, and then compared. Sometimes this is reported as one experiment, sometimes as two. This was the case
2Current writing guidelines on writing gender advise against using this word. See: morgan-klaus.com/sigchi-gender-guidelines
of 34 evaluations in our corpus. Comparisons can be jus-tified by fundamental research questions, such as in [49] “the comparison between the results of the two groups can
help identifying similarities and differences in the cognitive process”.
• Replacement.In some evaluations, PVI are intended as the end-users, but are replaced by sighted participants. This is the case in 19 evaluations. Generally, sighted participants are used in formative or pilot studies (n=16), to choose the system that will be evaluated by PVI later. The analysis of the corpus confirms that replacement needs to be done care-fully, as performance of both group of users vary depending on the task and technology (e.g., [2]).
• Baseline.Eight evaluations reported using sighted partici-pants as a baseline for performance for a given system. For instance, a study of the accessibility of Augmented Reality glasses while walking required measuring impact of walk-ing on sighted participants to identify the specific difficulty experienced by PVI [86].
• Improve statistical significance.Two evaluations indicated that recruiting sighted users enabled them to verify statisti-cal significance, especially in cases where they could also be a target user (e.g., [49]). In contrast, some recent studies (see below) state they did not use a statistical test because the number of participants was too small. It is hence unclear whether this practice will continue or will be replaced by other means of validating evaluations.
• Two target user groups.Four evaluations explained their use of sighted participants by their goal to develop non-visual systems accessible by both sighted and PVI (e.g., [77]). • Collaboration: Four evaluations cite collaboration as the
main reason for involving sighted participants (one cites both collaboration and considering two target-user groups). • Understand impact on environment. In one case, sighted participants were involved as researchers wanted to evaluate the impact on the behavior of sighted pedestrians in public spaces. [41].
In summary, many evaluations involve sighted people; there are many legitimate cases in which to do so. Regarding the involvement of sighted participants as a replacement for PVI in formative evaluations, which is a more controversial approach, it might be possible to use qualitative studies to accomplish this instead, as the analysis of the corpus papers above suggests they are well accepted.
Answering RQ2
To contextualise these findings in terms of representativeness, we need to compare them to the population with VI in gen-eral. We note that blind and legally blind users are a minority within PVI: 7% according to the World Health Organisation (WHO) [57]. However, they are involved in the majority of experiments. Moreover, the WHO estimates that 65% of PVI and 82% of blind people are over the age of 50, hence likely to experience other impairments (2.4% in our corpus, the me-dian age of PVI participants was 38.5 years-old). Overall, the design and therefore the evaluation of assistive technologies do not reflect the global population of PVI. We speculate the under-representation of blind participants can be explained by the fact that they may have more considerable accessibility
issues than people with other visual impairments. Moreover, participants with additional impairments may instead be in-volved in studies about people with multiple disabilities. An-other area of concern is that few experiments report the age of onset or cause of visual impairments, although this impacts cognition and technology use [64].
DIFFICULTIES REPORTED
During the tagging, we noted whether authors reported any particular difficulty concerning the study. With this, we aim to answer RQ3: What are the difficulties encountered by
re-searchers in this type of evaluation?. We classified these
com-ments, reported in 31 papers (17.3%), into seven categories. They are reported here from the most frequently occurring to the least, with the inclusion of representative examples from the corpus:
• Small available pool of PVI.Authors commented on re-cruitment difficulties (30%): “Obtaining a large number of blind participants was difficult due to their relatively low representation in the general population” [6]. This was used to motivate the recruitment of sighted people for formative studies: “To avoid over-use of the relatively small pool of non-sighted people available for evaluations such as this, all but one of the participants [...] were sighted” [17]. Others reported their methods for recruiting participants, mostly through email lists and local organizations. This difficulty is even more common when it comes to recruiting children: “As access to blind children is very limited we first used
blind and visually impaired young adults” [82].
• Sample size.As a direct consequence from the recruitment problem, 12% reported that the sample size for the study was small, explaining the choice of reporting only qualita-tive data: “the limited number of participants in our initial study makes it difficult for us to perform a statistical analy-sis of the quantitative data” [55].
• Expertise of the participants. Beyond the recruitment of PVI in general, finding participants with a specific expertise is very difficult (12%):“the number of people qualified to test the workstation and its components are small” [72]; “In Pakistan, finding blind computer users highly proficient with LaTeX was not an easy task” [48].
• Consistency between participants.Again as a consequence of the small pool of available PVI, 10% reported that the resulting group of participants is too heterogeneous: “It would also be impossible to match participants; their back-grounds were simply too diverse: level of sight. aetiology of disability. level and form of education and so on.” [72]. • Inclusion of sighted people.Authors also discussed (9%) the inclusion of sighted participants in the study as a limitation (“One limitation of this study is that the sighted participants’ performance may not be representative of blind users” [39]). • Exclusion of participants.In some papers, authors reported (6%) that they had to exclude participants from the study results due to several reasons: “We excluded from this anal-ysis one participant with low vision, since she could see, with some effort, the route on the screen” [35] or “we had to exclude 4 of them; the first one did not have an under-standing of what geometric figures are, [...] the second one had an unusually small hand [...] the third one kept falling
asleep [...] and with the fourth participant, we experienced hardware failure” [69].
• Other comments.Authors reported other difficulties, such as scheduling problems (e.g., “requiring participants to travel to the study location” [16]), technical issues, the length of the experiment being too long for a certain modality, the difficulty to create an inclusive experimental environment, the generalization of the results, or the definition of the study measures.
Answering RQ3
Researchers do express difficulty to find and involve PVI in their studies. By extension, it is difficult to design and conduct experiments similar to how they would be done with sighted participants. Taken together with the results of RQ1 and RQ2, this suggests that the standards for quantitative empirical eval-uations are hard to apply in this area of HCI, which could explain researchers turning to other approaches as discussed earlier.
DISCUSSION
Answering our research question
We addressed the research question What is, at present, best
practice in quantitative empirical evaluations of technologies for people with visual impairment in HCI?through an analysis
of published evaluations. We adopted a broad definition of quantitative empirical evaluations (instead of one restricted to controlled lab studies) to be able to identify the full range of approaches and what we can learn from them going forward. We found a wide range of approaches. There is one type of paper more common than others, a description of a design with one summative quantitative experiment, followed by papers with either a pilot or a formative quantitative empirical eval-uation with one summative experiment. However, (1) there are concerns about the quality of reporting of evaluations; (2) most design focus on a subset of PVI; and (3) researchers face difficulties in running evaluations (especially with PVI) while reaching the statistical significance expected in these venues. Practices appear to adapt to this issue in various ways, such as turning to qualitative evaluations or replacing visually impaired participants with blindfolded sighted ones.
At present, involving sighted participants instead of visually impaired participants is accepted practice, despite the many critiques leveraged against it. We thus need to discuss and build standards for empirical quantitative evaluations that both take into account the difficulties researchers are running into and this critique. For this, we propose to learn from other fields that have addressed the same issues.
Limitations and future work
We identify two areas regarding limitations and future work: evaluations in other fields, and evaluating beyond empirical quantitative evaluations.
Learning from Other Fields
We have limited our inquiry to publications about technologies in the field of HCI. This potentially limits our understanding of possible approaches to evaluation. During this research, we found similar literature review in learning sciences [42] but
not others. As pointed out in our answer to RQ2, many eval-uations in our corpus do not follow standards for evaluating technologies with PVI used in related research fields. This could restrict interdisciplinary exchanges. Moreover, other disciplines concerned with assistive technologies can provide inspiration for the evaluations conducted in HCI. For instance, Kelly and Smith [42] acknowledge the difficulty of conduct-ing traditional experiments with a control group in special education, recommending instead the use of single-subject design. This is a standard practice in the field of orientation and mobility as well [5, 56, 45]. Both areas of application are prominent in our corpus. Technologies could be evaluated with a low number of representative participants, with new ex-periments over time adding to the credibility of the evaluation. The question however is which HCI publications would allow this.
Other assessment approaches
We focus here on quantitative empirical evaluations. They pose a number of concerns, from their validity to their ap-propriateness for technology that do not aim at compensating an impairment but rather to foster experience or community. Several articles in the corpus raise concerns about the va-lidity of quantitative evaluations for user preference, due to users attempting to please the designer [66, 76], which seems more pronounced for participants with visual impairments [76]. Further leveraging qualitative studies could be a way to understand more nuanced experiences with technologies [71]. We should also account for the novelty effect [44]. Some papers in our corpus conduct evaluations in the field and/or over relatively long periods (up to two weeks), but this is dif-ficult to do with large groups of participants. Single-subject experimental designs could also be a way to address this issue going forward.
Analytical evaluation includes heuristic evaluation, expert comparisons with other products, or expert-led analysis to outline a design space and design implications. These forms of expert-led evaluations have become increasingly rare in the 2000s at venues such as CHI [10], although they are still used as formative studies (6 papers in our corpus). Heuristic evaluations [53] are based on expert users identifying issues and suggesting improvements, reporting the number of errors or rating functions. This could be interesting in the case of evaluations with PVI, as they can be considered as experts of non-visual uses of technologies. These results would have to be considered carefully and optimally, so several evaluation approaches should be used [33]. These other approaches to evaluation confirm the wide range of evaluation practices in this community. It suggests potential ways of complementing quantitative empirical evaluation, especially in the formative stages, to lessen the involvement of sighted participants [67]. However, the variety of evaluation approaches could also be seen negatively, as preventing the accumulation of knowl-edge due to generalization difficulty. We would argue that the community benefits from shared standards in the area of quan-titative evaluation, particularly as these methods are key for securing funding for new interventions [42]. These standards should evolve as they are challenged by new approaches to
evaluation and the historical methods are not always appropri-ate.
RECOMMENDATIONS
The exploration of the three initial research questions led us to a set of recommendations on how to conduct, report, and review experimental evaluations of technology for PVI.
Recommendations for conducting evaluations
In this section we discuss how the involvement of participants with visual impairments and approaches potentially enabling their wider participation.
• While it may be acceptable to include sighted participants for testing interaction techniques at the level of “actions,” it is not for testing a device designed to do a more cognitive task. Indeed, visual impairments have consequences on education, knowledge and mental representations, which, in turn, have an impact on the execution of cognitive tasks. • This also suggests that if involving a few PVI in the early cycles of a user-centered design is considered beneficial, validating the final design with that same population is considered crucial.
• Visual impairments other than (isolated) blindness seem under-represented across many of the studies. Involving other users could offer a different perspective on the us-ability of technologies, and may provide insights to the technology’s benefit to a diverse population.
• The variety of evaluation methods in the corpus should encourage researchers to use the full range of evaluation approaches, echoing Barkhuus and Rode [10]. We argue this is not opposed to a shared standard for quantitative evaluation, but that instead, it contributes to its evolution and improvement through time.
• Evaluations conducted in the field, on participants’ own spaces and schedules, and within a context of high involve-ment in the community such as participatory design could be easier to conduct.
• Single subject design for quantitative evaluations could be an interesting approach to address the current difficulties encountered by researchers.
Recommendations for reporting evaluation
Within the corpus there were inconsistencies in reporting. Here are a few key points all authors can address to help situate study results and understand their generalizability:
• We encourage authors to report participant characteristics individually through a description table, using the user char-acteristics listed above, as long as this does not threaten their privacy and security.
• We also encourage authors to use standardized metrics when giving an overview of the group, including median age, gen-der, education level, and experience with relevant technolo-gies or subjects.
• It would be beneficial to systematically use the WHO clas-sification for visual impairments so experiments can be compared. This considers that technologies evaluated quali-tatively have the aim to help access to fairly narrow tasks, for which this medical classification is relevant. In other
cases, functional definitions (e.g., ability to read at a certain distance most of the time) might be better suited.
• We provide a typology of the reasons for including sighted users as participants. These could be used as references to describe and motivate their inclusion.
• For general reporting, an even greater transparency on the issues of designing and analysing results would be beneficial to this research community as it enables continuous review of standards.
Recommendations for reviewing evaluation
In addition to changes researchers can make to their own research and reporting practices, they can also consider the following points when reviewing work for others:
• We highlight the difficulties reported by researchers during their evaluations. Being aware and considerate of these diffi-culties could help promote more inclusive practices, instead of adaptations to quality metrics used for other technologies (e.g., adding sighted participants to reach validity). • Rejecting a paper based on low sample size may hinder
research in the field; the community should support authors and new researchers in reporting results appropriate for the sample size, i.e., using in-depth qualitative analysis if quantitative is not possible.
• Reviewers should pay special attention to how authors re-port their evaluations and particularly to comprehensiveness of the description of participants.
• Reviewers can refer to the previous recommendations for re-porting evaluations when suggesting changes for the camera-ready version of a paper.
CONCLUSION
Motivated by a lack of systematic surveys on evaluation methodologies for technologies for PVI, we set out to review a corpus of 178 papers on assistive HCI published over the past three decades. We analysed types and forms of quanti-tative empirical evaluations used, sample representation, and reported difficulties in conducting evaluations in this space. Our findings confirm there is an implicit standard (a novel technique with a summative quantitative evaluation), which co-exists with a wide range of other types of article. We noted concerns about the reporting of evaluations and the represen-tation of PVI in these evaluations. We also report on the difficulties experienced by researchers and discussed alterna-tive and complementary approaches to quantitaalterna-tive empirical evaluations as they are currently run. We frame our findings in the form of recommendations for conducting, reporting, and reviewing empirical evaluations of technologies for PVI, that we hope will help improve evaluation practices in this domain.
ACKNOWLEDGEMENTS
The authors would like to thank the workshop and SIG partic-ipants who contributed to map these issues ( inclusiveeduca-tion.tech). This work has received funding from the Univer-sity of Sussex Research and Development Fund, from the French National Research Agency (AccessiMap ANR-14-CE17-0018) and the EPSRC (CRITICAL Fellowship Project, EP/N00616X/2).
REFERENCES
[1] 2019. Human Computer Interaction - Google Scholar Metrics. (2019).
https://scholar.google.com/citations?view_op=top_ venues&hl=en&vq=eng_humancomputerinteraction
[2] Iyad Abu Doush, Enrico Pontelli, Dominic Simon, Tran Cao Son, and Ou Ma. 2009. Making Microsoft ExcelâDˇ c:´ multimodal presentation of charts. In
Proceedings of the 11th international ACM SIGACCESS conference on Computers and accessibility. ACM,
147–154.
[3] Jérémy Albouys-Perrois, Jérémy Laviole, Carine Briant, and Anke M Brock. 2018. Towards a multisensory augmented reality map for blind and low vision people: A participatory design approach. In Proceedings of the
2018 CHI Conference on Human Factors in Computing Systems. ACM, 629.
[4] Farhan Khashim Alswailmi. 2018. Global prevalence and causes of visual impairment with special reference to the general population of Saudi Arabia. Pakistan
journal of medical sciences34, 3 (2018), 751.
[5] Catherine L Backman and Susan R Harris. 1999. Case Studies, Single-Subject Research, and N of 1
Randomized Trials: Comparisons and Contrasts1.
American Journal of Physical Medicine & Rehabilitation78, 2 (1999), 170–176.
[6] Suzanne Balik, Sean Mealin, Matthias Stallmann, Robert Rodman, Michelle Glatz, and Veronica Sigler. 2014. Including blind people in computing through access to graphs. ASSETS14 - Proceedings of the 16th
International ACM SIGACCESS Conference on Computers and Accessibility(10 2014), 91–98. DOI:
http://dx.doi.org/10.1145/2661334.2661364
[7] Aaron Bangor, Philip T Kortum, and James T Miller. 2008. An empirical evaluation of the system usability scale. Intl. Journal of Human–Computer Interaction 24, 6 (2008), 574–594.
[8] Sandra Bardot, Marcos Serrano, and Christophe Jouffrais. 2016. From Tactile to Virtual: Using a Smartwatch to Improve Spatial Map Exploration for Visually Impaired Users. In Proceedings of the 18th
International Conference on Human-Computer Interaction with Mobile Devices and Services
(MobileHCI ’16). ACM, New York, NY, USA, 100–111.
DOI:http://dx.doi.org/10.1145/2935334.2935342
[9] Sandra Bardot, Marcos Serrano, Simon Perrault, Shengdong Zhao, and Christophe Jouffrais. 2019. Investigating Feedback for Two-Handed Exploration of Digital Maps Without Vision. In IFIP Conference on
Human-Computer Interaction. Springer, 305–324.
[10] Louise Barkhuus and Jennifer A. Rode. 2007. From Mice to Men - 24 Years of Evaluation in CHI. In
Proceedings of the SIGCHI Conference on Human Factors in Computing Systems (CHI ’07). ACM, New
York, NY, USA, Article 1. DOI:
http://dx.doi.org/10.1145/1240624.2180963
[11] Cynthia L. Bennett and Daniela K. Rosner. 2019. The Promise of Empathy: Design, Disability, and Knowing the "Other". In Proceedings of the 2019 CHI Conference
on Human Factors in Computing Systems (CHI ’19).
ACM, New York, NY, USA, Article 298, 13 pages. DOI:
http://dx.doi.org/10.1145/3290605.3300528
[12] Alexy Bhowmick and Shyamanta M Hazarika. 2017. An insight into assistive technology for the visually impaired and blind people: state-of-the-art and future trends. Journal on Multimodal User Interfaces 11, 2 (2017), 149–172.
[13] Syed Masum Billah, Yu-Jung Ko, Vikas Ashok, Xiaojun Bi, and IV Ramakrishnan. 2019. Accessible Gesture Typing for Non-Visual Text Entry on Smartphones. In
Proceedings of the 2019 CHI Conference on Human Factors in Computing Systems (CHI ’19). ACM, New
York, NY, USA, Article 376, 12 pages. DOI:
http://dx.doi.org/10.1145/3290605.3300606
[14] Kirsten Boehner, Janet Vertesi, Phoebe Sengers, and Paul Dourish. 2007. How HCI interprets the probes. In
Proceedings of the SIGCHI conference on Human factors in computing systems. ACM, 1077–1086.
[15] Sebastian K Boell and Dubravka Cecez-Kecmanovic. 2010. Literature reviews and the hermeneutic circle.
Australian Academic & Research Libraries41, 2 (2010),
129–144.
[16] Danielle Bragg, Cynthia Bennett, Katharina Reinecke, and Richard Ladner. 2018. A Large Inclusive Study of Human Listening Rates. In Proceedings of the 2018 CHI
Conference on Human Factors in Computing Systems (CHI ’18). ACM, New York, NY, USA, Article 444, 12
pages. DOI:http://dx.doi.org/10.1145/3173574.3174018
[17] Andy Brown, Steve Pettifer, and Robert Stevens. 2003. Evaluation of a Non-visual Molecule Browser.
SIGACCESS Access. Comput.77-78 (Sept. 2003), 40–47.
DOI:http://dx.doi.org/10.1145/1029014.1028639
[18] Emeline Brulé and Christophe Jouffrais. 2016.
Representing children living with visual impairments in the design process: A case study with personae. In
Designing Around People. Springer, 23–32.
[19] Emeline Brulé, Oussama Metatla, Katta Spiel, Ahmed Kharrufa, and Charlotte Robinson. 2019. Evaluating Technologies with and for Disabled Children. In
Extended Abstracts of the 2019 CHI Conference on Human Factors in Computing Systems (CHI EA ’19).
ACM, New York, NY, USA, Article SIG08, 6 pages. DOI:http://dx.doi.org/10.1145/3290607.3311757
[20] Colleen M Carpinella, Alisa B Wyman, Michael A Perez, and Steven J Stroessner. 2017. The robotic social attributes scale (rosas): Development and validation. In
Proceedings of the 2017 ACM/IEEE International Conference on human-robot interaction. ACM,
[21] Anna Cavender, Shari Trewin, and Vicki Hanson. 2014. Accessible writing guide.
https://www.sigaccess.org/welcome-to-sigaccess/resources/accessible-writing-guide/
(2014).
[22] John A Collins and Bart CJM Fauser. 2005. Balancing the strengths of systematic and narrative reviews. (2005). [23] Ticianne GR Darin, Rossana Andrade, Lotfi B Merabet,
and Jaime Hernán Sánchez. 2017. Investigating the Mode in Multimodal Video Games: Usability Issues for Learners who are Blind. In Proceedings of the 2017 CHI
Conference Extended Abstracts on Human Factors in Computing Systems. ACM, 2487–2495.
[24] Pierre Dragicevic. 2016. Fair statistical communication in HCI. In Modern Statistical Methods for HCI. Springer, 291–330.
[25] Julie Ducasse, Marc Macé, Bernard Oriola, and Christophe Jouffrais. 2018. BotMap: Non-Visual Panning and Zooming with an Actuated Tabletop Tangible Interface. ACM Transactions on
Computer-Human Interaction (TOCHI)25, 4 (2018), 24.
[26] Julie Ducasse, Marc J-M Macé, Marcos Serrano, and Christophe Jouffrais. 2016. Tangible Reels:
Construction and Exploration of Tangible Maps by Visually Impaired Users. In Proceedings of the 2016
CHI Conference on Human Factors in Computing Systems (CHI ’16). ACM, New York, NY, USA,
2186–2197. DOI:
http://dx.doi.org/10.1145/2858036.2858058
[27] Naomi Friedlander, Kevin Schlueter, and Marilyn Mantei. 1998. Bullseye! when Fitts’ law doesn’t fit. In
Proceedings of the SIGCHI conference on Human factors in computing systems. ACM
Press/Addison-Wesley Publishing Co., 257–264. [28] Prathik Gadde and Davide Bolchini. 2014. From screen
reading to aural glancing: towards instant access to key page sections. In Proceedings of the 16th international
ACM SIGACCESS conference on Computers & accessibility. ACM, 67–74.
[29] Thomas Gallagher, Elyse Wise, Hoe Chee Yam, Binghao Li, Euan Ramsey-Stewart, Andrew G
Dempster, and Chris Rizos. 2014. Indoor navigation for people who are blind or vision impaired: where are we and where are we going? Journal of Location Based
Services8, 1 (2014), 54–73.
[30] Morton Ann Gernsbacher. 2017. Editorial Perspective: The use of person-first language in scholarly writing may accentuate stigma. Journal of Child Psychology
and Psychiatry58, 7 (2017), 859–861. DOI:
http://dx.doi.org/10.1111/jcpp.12706
[31] Monica Gori, Giulia Cappagli, Alessia Tonelli, Gabriel Baud-Bovy, and Sara Finocchietti. 2016. Devices for visually impaired people: High technological devices with low user acceptance and no adaptability for
children. Neuroscience & Biobehavioral Reviews 69 (2016), 79–88.
[32] Timo Götzelmann. 2018. Autonomous Selection and Printing of 3D Models for People Who Are Blind. ACM
Transactions on Accessible Computing (TACCESS)11, 3
(2018), 14.
[33] Wayne D Gray and Marilyn C Salzman. 1998. Damaged merchandise? A review of experiments that compare usability evaluation methods. Human-computer
interaction13, 3 (1998), 203–261.
[34] Saul Greenberg and Bill Buxton. 2008. Usability evaluation considered harmful (some of the time). In
Proceedings of the SIGCHI conference on Human factors in computing systems. ACM, 111–120.
[35] João Guerreiro, Dragan Ahmetovic, Kris M. Kitani, and Chieko Asakawa. 2017. Virtual Navigation for Blind People: Building Sequential Representations of the Real-World. In Proceedings of the 19th International
ACM SIGACCESS Conference on Computers and Accessibility (ASSETS ’17). ACM, New York, NY, USA,
280–289. DOI:
http://dx.doi.org/10.1145/3132525.3132545
[36] Kim Halskov and Nicolai Brodersen Hansen. 2015. The diversity of participatory design research practice at PDC 2002–2012. International Journal of
Human-Computer Studies74 (2015), 81–92.
[37] Sandra G Hart. 2006. NASA-task load index (NASA-TLX); 20 years later. In Proceedings of the
human factors and ergonomics society annual meeting,
Vol. 50. Sage publications Sage CA: Los Angeles, CA, 904–908.
[38] Marion Hersh and Michael A Johnson. 2010. Assistive
technology for visually impaired and blind people.
Springer Science & Business Media.
[39] Jonggi Hong, Alisha Pradhan, Jon E. Froehlich, and Leah Findlater. 2017. Evaluating Wrist-Based Haptic Feedback for Non-Visual Target Finding and Path Tracing on a 2D Surface. In Proceedings of the 19th
International ACM SIGACCESS Conference on Computers and Accessibility (ASSETS ’17). ACM, New
York, NY, USA, 210–219. DOI:
http://dx.doi.org/10.1145/3132525.3132538
[40] Hernisa Kacorri, Eshed Ohn-Bar, Kris M Kitani, and Chieko Asakawa. 2018. Environmental factors in indoor navigation based on real-world trajectories of blind users. In Proceedings of the 2018 CHI Conference on
Human Factors in Computing Systems. ACM, 56.
[41] Seita Kayukawa, Keita Higuchi, João Guerreiro, Shigeo Morishima, Yoichi Sato, Kris Kitani, and Chieko Asakawa. 2019. BBeep: A Sonic Collision Avoidance System for Blind Travellers and Nearby Pedestrians. In
Proceedings of the 2019 CHI Conference on Human Factors in Computing Systems. ACM, 52.