WORKING
PAPERS
SES
N. 522
II. 2021
Faculté des sciences économiques et sociales et du management
Adverse Effects of
Monitoring: Evidence
from a field experiment
Holger Herz
and
Adverse Effects of Monitoring: Evidence from a field
experiment
∗
Holger Herz
§Christian Zihlmann
¶05.02.2021
Abstract
We conduct a field experiment with remote workers to assess potential adverse effects of monitoring. We find that monitoring reduces the average performance of workers, in particular among the intrinsically motivated workforce. Moreover, monitoring cultivates the average worker: There are fewer high performers and the variance in performance is significantly reduced. Importantly, we show that per-formance reductions primarily occur among challenging tasks. These perper-formance reductions significantly increase unit costs in our setting. This effect is particularly severe when challenging tasks have high marginal value, as in high-performance work systems or when tasks are complementary inputs into the production function. Keywords: Monitoring, Hidden Costs of Control, Remote work, Field experiment JEL Classification Codes: C93, D21, J24, M5
∗Before data collection, this RCT was registered on the AEA RCT registry (ID: AEARCTR-0003475) and approved by the ethics committee of the Internal Review Board of the Department of Psychology of the University of Fribourg (Ref-No.: 393). We are grateful for valuable comments to Björn Bartling, Berno Büchel, Alain Cohn, Martin Huber, Michael Kosfeld, Marina Schröder, Christian Zehnder, participants of the 7th Swiss Young Researchers Workshop in Behavioural Economics and Experimental Research in Kandersteg (Switzerland), the 14th Nordic Conference on Behavioral and Experimental Economics in Kiel (Germany), the Florida State University Economics Seminar and the PhD seminar of the Department of Economics at the University of Fribourg. Holger Herz acknowledges financial support from ERC Starting Grant 803332.
§University of Fribourg, Switzerland, [email protected] ¶University of Fribourg, Switzerland, [email protected]
1
Introduction
Monitoring is a commonly used practice to counter employee misbehavior (Alchian &
Demsetz, 1972; Jensen & Meckling, 1976). Indeed, firms increasingly monitor workers’
activities and the shift towards working from home during the COVID-19 pandemic
cre-ated a huge rise in the demand for monitoring technology.1 Evaluations of the effectiveness
of such measures in the field, however, remain scarce,2 despite the fact that some authors
have argued that monitoring may crowd out intrinsic motivation and thus counteract a
potential disciplining effect (Frey, 1993; Falk & Kosfeld, 2006).3 Gaining a better
un-derstanding of how precisely monitoring alters worker behavior is thus fundamentally important, in particular in the increasingly common remote work setting.
We advance our understanding of this question by conducting a pre-registered natural field experiment with 693 remote workers on Amazon Mechanical Turk (AMT), in which we exogenously vary the existence of a monitoring device during a one-time job. Our experimental setup allows us to causally assess reactions to monitoring (i) across workers with different degrees of intrinsic motivation as well as (ii) across tasks of differing diffi-culty. The former allows us to evaluate whether potential performance reductions are a consequence of motivational crowding out. The latter allows us to analyze heterogeneity in the incidence of potential performance reductions with respect to task difficulty. Un-derstanding such heterogeneity is important because task difficulty is often related to the marginal value of a task to the employer, for example because tasks may be complements in a firm’s production function. Our setup thus allows us to shed light on whether monitor-ing differentially affects firm performance conditional on whether tasks are complements or substitutes in a firm’s production function.
The experiment consists of two stages, a pre-treatment and an experimental stage. In both stages, workers receive a flat wage and are tasked with classifying 20 pictures. Before starting to work on a picture, workers need to declare whether or not the picture is readable. If reported as readable, workers are expected to work on the picture and classify it according to the guidelines. If reported as unreadable, workers proceed immediately to
1Kropp(2021) reports that “During the pandemic, more than 1 out of 4 companies has purchased new technology, for the first time, to passively track and monitor their employees.” Similar reports are found in Cutter, Chen, and Krouse(2020) andHernandez(2020).
2See Nagin, Rebitzer, Sanders, and Taylor (2002), Boly (2011) and Belot and Schröder (2016) for some initial evidence.
3Reports in newspapers in response to the recent uptick in surveillance technology also suggest that increased workplace surveillance may increase stress and dissatisfaction of employees (see, for example,
the next picture. Importantly, pictures vary in difficulty. While some are easy and can be quickly classified, others are more difficult and require substantial effort.
In the pre-treatment stage, workers receive a flat wage and are not monitored, both of which is known to workers. Hence, workers have no extrinsic incentive to exert effort.
Following Bénabou and Tirole (2003)’s definition of intrinsic motivation as "the
individ-ual’s desire to perform the task for its own sake", we use time on task from this stage to identify workers’ intrinsic motivation to work on the job.
In the experimental stage, workers are randomly assigned to either the Monitored group or the Baseline. Conditions in the Baseline group are identical to the pre-treatment stage. In the Monitored group, we implement an imperfect monitoring mechanism by introducing a maximal allowance threshold for declaring pictures as unreadable. If workers declare more than 8 pictures as unreadable, they do not receive any payment.
The monitoring device restricts workers’ shirking possibilities by limiting the option to declare readable pictures as unreadable. Yet, it leaves other avenues of shirking open. In particular, workers could declare pictures as readable, but then enter incomplete or
random information.4 Such a monitoring scheme is representative of many monitoring
devices used in the field, where monitoring can only be targeted on observable dimensions
of the job.5 Consequently, opportunistic workers can relatively easily circumvent the
monitoring device, limiting its potential positive effects on performance in our setting. Intrinsically motivated workers, however, may react to the monitoring device by reducing their performance.
Our first key result confirms this hypothesis and shows that monitoring reduces over-all performance due to the crowding out of intrinsic motivation. We find that workers in the Monitored group reduce performance by 0.7 correctly solved pictures relative to the Baseline (p < .01), representing a 5.5% performance reduction. When splitting our sample at median intrinsic motivation, we find that output among workers with high in-trinsic motivation is reduced by 1.1 pictures or 8.7% in the Monitored group relative to the Baseline (p < .01). In contrast, workers with low intrinsic motivation do not exhibit significant performance differences among the two experimental groups. Interestingly,
4Note that this is a realistic feature in these type of tasks. Employers crowdsource such data entry tasks precisely because the requested information cannot be directly verified by the employer. Hence, monitoring correct answers is not straightforward, whereas clicks on the unreadable button are easy to measure.
5Examples include monitoring the time logged into the employer network, but not productive working time, or monitoring the number of calls made/received in a call center, but not the actual effort when on a call with a customer.
monitored workers are significantly less likely to declare pictures as unreadable. Thus, monitoring reduces shirking in the incentivized dimension. At the same time, the number of erroneous transcriptions significantly increases. This implies that performance reduc-tions are not observed in the monitored, but in the non-monitored dimension, which is
consistent with Belot and Schröder (2016). An important implication of this finding is
that it can be difficult for firms to notice the detrimental impact of the monitoring device, as performance metrics in the observable dimension indicate effectiveness.
We further find that monitoring reduces the number of high performers. Whereas 40% of workers solve 14 pictures or more in the Baseline, only 30% of workers do so when monitored (p < .01). At the same time, low performers are less common among monitored workers, but this effect is not significant. Jointly, these two effects imply that the variance of performance is significantly lower in the Monitored group compared to the Baseline (p < .05). Put differently, monitoring cultivates the average worker.
Our second key result is that the performance reduction occurs at tasks that are difficult and time-demanding. Ordering the pictures from the experimental stage by suc-cessful completion rates and classifying them into three categories, we find that monitored workers are 3.5 percentage points or 17% less successful at solving pictures in the most difficult tertile (p < .05). For the easiest tertile, we find that monitored workers increase their performance, but insignificantly so. Again, it is the intrinsically motivated workforce who contributes to lower success rates in the most difficult tertile when monitored, which is consistent with our previous finding: The completion rate is 5.2 percentage points or 21.4% percent lower for intrinsically motivated workers who are monitored relative to the Baseline — a substantial and significant difference (p < .05).
Monitored workers perform worse among the more time-demanding pictures, too. We find this result when categorizing pictures by laboriousness, measured by time spent on a picture. In the most time-demanding tertile of pictures, performance in the Monitored group is 3.2 percentage points or 8.8% lower compared to the Baseline (p < .10). Once more, this effect is driven by the intrinsically motivated workers: For workers with high intrinsic motivation, the completion rate among the most laborious tertile of pictures is reduced by 7.6 percentage points or 18.8% (p < .01).
This result has important implications: In work environments in which different tasks are highly complementary inputs into the firm’s production function (an example of a production function with perfect complementarity would be Kremer’s O-Ring theory
The productivity loss to a firm is then not determined by the average reduction in pro-ductivity, but by the productivity loss in those tasks in which successful performance is scarcest, and that hence have a particularly high marginal value to the firm. Consequently, the costs of monitoring can be vastly underestimated when focusing on the average per-formance effect, given that perper-formance reductions primarily arise in challenging tasks. Yet, this is what the empirical literature has done so far.
Our setting allows us to go beyond the average performance effect by running sim-ulations to determine the effect of monitoring on costs in our setting under different assumptions on the production function. In crowd-sourced data entry tasks, employers often infer a correct transcription for a picture by matching the provided solutions ob-tained from the crowd. If a pre-determined number of workers agree upon a solution, this solution is presumed to be correct. We simulate such a mechanism using our empirically observed data set and require 5 workers to agree on a solution. We find that monitoring increases the average number of workers required to obtain 5 matching solutions on all pictures by 12%. At the same time, monitoring decreases the average number of matching solutions that are actually correct by 4%. These two effects together imply that, under the assumption that pictures are perfect substitutes, monitoring increases the unit cost of a correctly solved picture by 17%.
While this is already substantial, the increase in unit costs is even higher if pictures are complementary inputs into the firm’s production. To show this, we assume that at least X of the 20 pictures have to be solved correctly such that the transcription of the set of 20 pictures has any value for the firm. For example, if X = 17, 85% of the pictures would have to be solved correctly, which resembles a high degree of complementarity in the production function. We find that 49% of the cases provide such a high degree of correct solutions when sampling from the Baseline. In contrast, this applies only to 24% of the cases when sampling from the Monitored group, which constitutes a 50% reduction. This implies that monitoring increases the unit cost of a valuable transcription by 125%. More generally, we find substantial unit cost increases when the required fraction of correctly
solved tasks is between 75% and 95%.6 Firms relying on a highly motivated workforce to
perform challenging tasks that are essential for the firm’s productivity should therefore exercise extra caution before implementing imperfect monitoring schemes.
These findings shed light on the heterogeneity in incentive schemes across different
6We do not find differences when we require 100% of the tasks to be solved correctly because neither in the Baseline nor in the Monitored group do we ever observe that the matching solutions are correct for all 20 pictures.
work environments (Ichniowski, Shaw, & Prennushi, 1997). In many jobs, workers have private information about the importance of different tasks for firm productivity, and firms
cannot install monitoring technology that accounts for this private information (Ichniowski
& Shaw, 2003; Bartling, Fehr, & Schmidt, 2012). Workers could game and exploit the
incentive scheme, for example by diverting effort from more difficult tasks to easier or
faster-to-solve tasks that are of lower marginal value to the firm (Ederer, Holden, &
Meyer, 2018). In such environments, one often observes high-performance work systems
that grant authority to workers to prioritize tasks and solve problems themselves, without the necessity to follow strict processes. Our evidence shows that in such environments, there is good reason to grant authority to workers and refrain from monitoring.
The crowding out of intrinsic motivation manifests itself in performance reductions among the most challenging tasks. If challenging tasks are those with the highest marginal value to the firm and task difficulty is not directly observable or contractible by the employer, the costs of implementing imperfect monitoring devices can be enormous. If, however, inputs provided by workers are substitutes, the costs of the crowding out are more modest and can be compensated with more ease by a potential disciplining effect of the monitoring technology.
Our results also contribute to the emerging literature on working from home (Bloom,
Liang, Roberts, & Ying, 2014). In 2015, only 44% of workers in the European Union
conducted all their work at the employer’s premises (Eurofound and the International
Labour Office, 2017). During the COVID-19 outbreak from May to October 2020, half
of all paid hours in the U.S. were provided from home. This trend towards work from
home is likely to persist (Barrero, Bloom, & Davis, 2020).7 The consequences of such a
shift to remote work remain largely unexplored.8 Understanding the impact of
monitor-ing when work moves to a remote environment is thus important, in particular because these environments constitute more impersonal relationships in which the observability of worker inputs is reduced and hence explicit monitoring devices become more relevant. Our data suggests that firms should be careful in implementing monitoring schemes in re-mote work settings if productivity-relevant dimensions of workers’ input or output cannot be properly monitored.
7In addition, the advent of the gig economy leads to a growing share of freelance work (De Stefano,
2016), which is also often conducted remotely.
8In a large-scale field experiment, Bloom et al. (2014) find that the implementation of work-from-home leads to a 13% performance increase, along with increased worker satisfaction. In a similar fashion,
Angelici and Profeta(2020) find that work flexibility (in time and space) increases workers performance and well-being.
The few studies on the effects of monitoring that have been conducted in the field have been mostly limited to unidimensional tasks, in which only the net effect of a potential positive disciplining effect and a potential negative crowding out effect can be observed. The net effect ultimately depends on the effectiveness of the specific monitoring device
that is studied. Nagin et al. (2002) find that lowering the level of monitoring leads
most workers to decrease performance. Similarly, Boly (2011) finds that implementing
monitoring increases performance. Belot and Schröder (2016) investigate the effects of
monitoring in a multidimensional setting in which only one dimension is monitored. They find that monitoring positively affects performance in the monitored dimension, but leads to negative spillover effects into the non-monitored dimension.
We go beyond these articles and provide two key novel insights: First, we show het-erogeneous reactions with respect to agents’ intrinsic motivation in the field, a finding that has not been documented before. Second, we are the first to show that performance reductions primarily occur in difficult and time-consuming tasks, which has eminently important organizational implications.
Finally, we provide external validity for the literature on adverse effects of control in
the laboratory, starting with Falk and Kosfeld(2006). Follow-up experiments found that
crowding out of intrinsic motivation is stronger when there is a more personal
relation-ship between principal and agent (Dickinson & Villeval, 2008; Schmelz & Ziegelmeyer,
2020), when procedural fairness concerns are ignored (Kessler & Leider,2016) and after a
successful team-building exercise (Riener & Wiederhold,2016). The finding that a more
personal relationship between principal and agent (Dickinson & Villeval, 2008) increases
the motivational crowding out implies that our results probably constitute a lower bound in terms of the effect size, as the relationship between workers and employers in our setting is highly impersonal.
The remainder of the paper proceeds as follows. Section 2 presents the experimental
design and derives our hypotheses. Empirical tests and results are provided in Section 3.
2
The Experiment
2.1
The real effort task
The natural field experiment is conducted on Amazon Mechanical Turk ("AMT"), an online crowdsourcing labor market where employers can recruit workers to perform short tasks for payment. Workers are not aware that they are participating in an experiment. They engage in a visual search task: extracting and categorizing information from a picture. Concretely, we present workers with pictures from game-play situations of a lacrosse match and ask them to extract five pieces of information from each picture. Visual search tasks are common and natural on AMT and generate a productive output. Hence, workers sign up and engage in a task that fits their natural work environment.
Figure 1shows the entry mask workers faced.
Figure 1: The real effort task
Before starting to work on an picture, the workers need to decide whether the picture is readable or not. As instructed, a picture is objectively defined as readable if it is not blurry and if all requested information is visible ("Clear image, all info visible"-button). Otherwise, the picture was not readable and the workers would not need to transcribe it
("Unclear image, not all info visible"-button).9 Only if the picture was declared readable,
the worker had to enter the five pieces of information shown in the entry field in figure
1. Our job therefore offers two dimensions in which workers could wrongly transcribe a
9Indeed, in some cases, declaring pictures as unreadable is the truthful response because the picture is blurry or some of the requested information is not identifiable, and workers knew that this may be the case. For this reason, such a button is a common feature in picture categorization tasks on AMT.
picture, by declaring readable pictures as unreadable, or by entering incorrect information in the entry mask.
An important feature of our design is that pictures vary in difficulty. While some pictures require little time to identify all relevant information and hence to transcribe them correctly, other pictures are cumbersome and require a substantial time investment
to transcribe correctly (Figure B.1 in the Appendix provides examples of pictures of
different difficulty).
2.2
Set-up and treatments
The experiment consists of two stages, a pre-treatment stage and an experimental stage.
2.2.1 The Pre-Treatment Stage
In the pre-treatment stage, all workers receive a flat payment of USD 1 for categorizing 20 pictures. Monitoring or any other form of monetary or reputational incentives is absent. Workers are fully aware that there are no incentives because they are truthfully informed that "All work is accepted: your job will be approved automatically within 1 day", which is
an often used practice on AMT ( see AppendixB for the full instructions). Consequently,
workers could, for example, declare all 20 pictures as unreadable, not transcribing a single picture, and still receive the full reward.
The pre-treatment stage has a two-fold purpose in our experiment: First, it serves as a lock-in task with the goal to reduce dropouts once the treatment is induced. This
is an established method on AMT to avoid selective attrition (Horton, Rand, &
Zeck-hauser, 2011). Second, it allows us to observe behavior of all participants in the same
non-incentivized environment. This is an important feature because it allows us to anal-yse heterogeneity across workers in the response to the implementation of monitoring, conditional on their intrinsic motivation to perform the job.
2.2.2 The Experimental Stage
Once workers complete the pre-treatment stage, they are offered the opportunity to do another set of 20 pictures. If workers accept the offer, they are randomized into one of two groups: The control group (henceforth: "Baseline") receives the same contract as before, that is workers receive a flat payment of USD 1 for categorizing 20 pictures, and their output is auto-approved, such that there are no financial or reputational incentives.
In contrast, the treatment group (henceforth: "Monitored") is assigned to an imperfect monitoring mechanism: Workers are told that they are allowed to declare a maximum of 8 out of 20 pictures as unclear and that this will be checked automatically by the computer. If workers do not exceed the maximum allowance threshold of 8 pictures, a flat reward of USD 1 is automatically paid. If the requirement is not met, workers are not eligible to
receive the payment.10
Because the monitoring technology is imperfect, shirkers can circumvent it by enter-ing erroneous or random information in the entry mask instead of declarenter-ing pictures as unreadable. This design feature is meant to emulate environments in which not all rele-vant input dimensions are observable to the employer, and can thus not be targeted by monitoring.
2.3
Measures, Procedures and Hypotheses
2.3.1 Measures
To produce a correct transcription of a picture, workers first need to identify readable pictures as “readable”. Once done so, they also need to enter the correct information into the entry mask. Hence, there are two fundamental ways in which a worker can fail to produce valuable output in our setting: (i) declaring a picture as unreadable even though it is readable, thus skipping it, or (ii) identifying a picture as readable, but entering wrong information. To capture the first dimension, we define the variable SKIP as the number of pictures that are readable but skipped. To capture the second dimension, we define the variable ERRORS as the number of pictures that are attempted to transcribe, but the transcription is incorrect. To capture overall work output, we define the variable OUTPUT as the total number of correctly solved pictures (note that there are 20 pictures
in total and therefore: OUTPUT=20−SKIP−ERRORS).11Differentiating between SKIP
and ERRORS is insightful in our case because the monitoring device implemented in the Monitored group only affects the SKIP dimension. Shirking in the ERRORS dimension
remains non-penalized. TableB.1in the Appendix gives a short overview over the nature
of the three variables.
10The full instructions are available in AppendixB.
11In every set, two out of the 20 pictures are blurry and unreadable. Labeling the two unreadable pic-tures as unreadable is the truthful answer. Consequently, declaring an unreadable picture as unreadable is not contributing to SKIP but to OUTPUT.
2.3.2 Procedures
The experiment was programmed with the software oTree (Chen, Schonger, & Wickens,
2016). We conducted two randomized control trials, the first on December 10th 2018
and the second from March 9th to 11th 2020. Both trials were pre-registered before data
collection, see Herz and Zihlmann (2018). We conducted a second trial because we faced
some missing data issues due to a software malfunction in the first trial, and because
only a subset of our empirical analyses was pre-registered before the first trial.12 In our
analysis, we highlight those hypotheses for which adjustments in the pre-analysis plan were made between trial 1 and trial 2.
The total sample consists of 693 workers.13 All workers were from the U.S. We did not
impose any other restriction. The median duration was about 6 minutes for each stage. Workers received USD 1 for each stage, yielding an hourly pay of approximately USD 10.
2.3.3 Hypotheses
Our first hypothesis concerns the potential negative effect of monitoring on performance in our setting. The monitoring technology used in the Monitored treatment restricts workers’ shirking possibilities by limiting the option to declare pictures as unreadable, but it leaves the option open to erroneously and effortlessly transcribe the pictures. Hence, opportunistic agents can easily circumvent the measure and we do not expect a large disciplining effect. On the other hand, if monitoring crowds out intrinsic motivation, the treatment should reduce performance.
Hypothesis 1. Existence of hidden costs of control.14 Workers reduce performance
when monitored.
Hypothesis 1 thus assesses the external validity of the laboratory finding that
monitor-12We focus the analysis on the pooled sample. All results remain qualitatively similar when analyzing the two trials separately. We report the separate analyses in Appendix C.
13The sample for the first trial consists of 203 workers and for the second trial it amounts to 490. 221 workers completed the first trial. We excluded 18 workers from the data set because they started the experimental stage more than once, thus being potentially familiar with both treatment conditions. There was no attrition after treatment induction. Every single worker who started the experimental stage also completed it. In the second trial, 512 workers completed the experimental stage. We excluded 22 workers from the data set either due to starting the experimental stage twice or because of failed attention checks that we included in the experimental procedure. We observed some attrition in the second trial. 43 workers started the experimental stage without completing it. Of those, 20 were assigned to the Baseline and 23 to the Monitored group. We thus deem attrition to be low and not significantly differently distributed across treatments.
14Hypothesis 1 was pre-registered in both the analysis plans of study 1 and study 2 (Herz & Zihlmann,
ing entails hidden costs (Falk & Kosfeld, 2006). Our setup also allows us to gain further
insights regarding the incidence of potential performance reductions. Belot and Schröder
(2016) find that negative effects of monitoring primarily occur in non-monitored
dimen-sions, as shirking in the monitored dimension is more costly. We therefore hypothesize that a potential negative behavioral effect of monitoring should primarily occur in the non-monitored dimension (transcription errors) rather than in the monitored dimension (skipped pictures).
Our second hypothesis is concerned with heterogeneity across workers in their
behav-ioral reaction to the monitoring device. Frey (1993) posits that there are two types of
agents, an opportunistic agent who always maximizes own income (or minimizes costs of effort), and a intrinsically motivated agent who provides effort even in the absence of
monitoring or other types of incentives (see alsoFrey and Jegen(2001)). Intrinsically
mo-tivated workers may show negative behavioral reactions to monitoring and reduce their effort when monitored. We therefore expect that the reduction in performance when monitored is primarily caused by intrinsically motivated workers.
Hypothesis 2. Crowding out of intrinsic motivation.15 The performance reduction
is primarily driven by intrinsically motivated workers who reduce their performance in reaction to monitoring.
An important empirical challenge in assessing this hypothesis is to ex-ante identify those workers that are intrinsically motivated. In social psychology, intrinsic motivation
is often defined as engaging with an activity for no monetary incentive.16 In economics,
Bénabou and Tirole(2003, p.490) define intrinsic motivation as "the individual’s desire to
perform the task for its own sake". Consequently, intrinsic motivation is seen as exerting a high labor input in absence of any monetary incentives. We operationalize these notions and measure the time devoted to our job in the pre-treatment stage when no extrinsic incentives are present. Workers who devote more time to the job without incentives are
classified as more intrinsically motivated.17 More precisely, we measure the time devoted
15Hypothesis 2 was pre-registered in both the analysis plans of study 1 and study 2 (Herz & Zihlmann,
2018). The pre-analysis plans differ in the specification of the measurement of intrinsic motivation. In the pre-analysis plan for study 1, we pre-registered “playing lacrosse” as a proxy for intrinsic motivation for this job. However, few participants indicated that they play lacrosse and in-between the two pre-registrations an effective measurement for time spent on the task was developed for oTree. Hence, we adjusted our assessment and pre-registered for study 2 the time spent on the task in the pre-treatment stage as the proxy variable for intrinsic motivation.
16As an example, Deci (1971, p.105) provided the following definition: “one is said to be intrinsically motivated to perform an activity when one receives no apparent reward except the activity itself”.
to the task using otree_tools (Chapkovski & Zihlmann,2019), which corrects for events in which workers switch away from the window in which the experiment is active and
hence do not engage with the experimental job.18
Our third hypothesis assesses heterogeneous reactions to monitoring across types of tasks. Workers are tasked with transcribing 20 different pictures that vary considerably in their difficulty and in the amount of time required to solve them correctly. However, the monitoring technology does not take picture difficulty into account. As a consequence, we hypothesize that a reduction of intrinsic motivation reduces time spent precisely at those tasks at which costs are highest, and hence cost savings are highest if the worker shirks. Consequently, we expect monitoring to lead to a particularly pronounced performance reduction among challenging tasks.
Hypothesis 3. Crowding out among complex tasks.19 The performance reduction
is particularly pronounced among the more difficult pictures.
3
Results
In this section, we first present analyses of the effects of the monitoring intervention on
our outcome variables. In Subsection 3.3, we then present a quantification of the costs of
monitoring for different forms of production.
3.1
Motivational Crowding Out
To control for individual, stage and time fixed effects, we focus on the difference in our outcome variables between the experimental and the pre-treatment stage. In line with our pre-specified hypothesis, our first result establishes the existence of adverse effects of monitoring.
Result 1. Monitoring leads to a significant decrease in average work performance,
measured by the count of correctly solved pictures.
time on AMT: Upon finishing, a worker can always switch to the next job and earn additional rewards. Thus, spending more time on our job is costly and reduces workers’ hourly pay. Also, work input or time on task represents procedural data and is thus arguably more independent of skills and abilities than work output measures, such as performance. However, note that time devoted to the task is correlated with performance (p = .02), as one would expect.
18Focus time has been shown to be a better predictor of work output than standard time (Chapkovski
& Zihlmann,2019).
19This hypothesis was only pre-registered for the second trial, after exploratory findings in the first trial.
Figure 2: Average treatment effect on workers’ performance *** ______ ** ______ *** ______ -2 -1 0 1 2 3 N u mb e r o f p ict u re s (A ve ra g e d iff e re n ce fro m th e p re -t re a tme n t to t h e e xp e ri me n ta l st a g e )
Correctly solved pictures
(OUTPUT) Skipped pictures(SKIP) Pictures with errors(ERRORS)
Baseline Monitored
Note: The graph reports on the vertical axis the number of pictures as an average difference from the pre-treatment to the experimental stage. Errors bars represent the standard error of the mean. The horizontal axis plots work output, represent-ing workers’ performance, and its two dimensions. OUTPUT: Number of correctly solved pictures. SKIP: Number of readable pictures that were declared as unread-able. ERRORS: Number of transcribed pictures that contain an error. N = 693, whereof Baseline n = 350, Monitored n = 343.
Figure2provides support for Result1. It shows that workers in the Baseline on average correctly solve 0.8 fewer pictures in the experimental stage than in the pre-treatment stage (variable OUTPUT). This decrease is likely due to differences in the selection of pictures between the two stages, with the experimental stage being slightly more difficult. However and notably, workers in the Monitored group decrease the number of correctly solved pictures by 1.5. This reduction is roughly twice as large as in the Baseline group and implies a significant difference of 0.7 additional unsolved pictures per worker relative
to the Baseline (p < .01).20 This is equivalent to a decrease of output of 5.5%. Thus, we
find adverse effects of monitoring.
We test the robustness of our results by regressing experimental stage measurements on the treatment dummy while conditioning on the pre-treatment stage measurements.
Column (1) of Table 1 confirms Result 1. Monitoring reduces performance by 0.56
cor-rectly solved pictures (p < .01).
Table 1: Regression Analysis: Average treatment effect on workers’ performance
(1) (2) (3)
OUTPUT SKIP ERRORS
Monitored -0.56 -0.38 0.92 (0.18) (0.13) (0.19) OUTPUT (pre-treatment) 0.74 (0.03) SKIP (pre-treatment) 0.74 (0.05) ERRORS (pre-treatment) 0.66 (0.04) Constant 2.49 0.14 2.89 (0.42) (0.13) (0.23) r2 0.59 0.56 0.42 N 693 693 693
Note: OLS regressions, robust standard errors (in parentheses). Out-come variables are experimental stage measurements. OUTPUT: Num-ber of correctly solved pictures. SKIP: NumNum-ber of readable pictures that were declared as unreadable. ERRORS: Number of transcribed pictures that contain an error. Pre-treatment variables of OUTPUT, SKIP and ERRORS control for the level of workers’ performance before the treat-ment was induced.
Furthermore, Figure 2 also shows treatment differences in the number of skips and
errors. Monitored workers reduce the number of skipped readable pictures by 0.8 between
20In this section, if not otherwise explicitly mentioned, we report p values from Welch’s unpaired and two-sided t-test when comparing two groups. When reporting p values from regressions, these are obtained from the OLS estimator (robust standard errors).
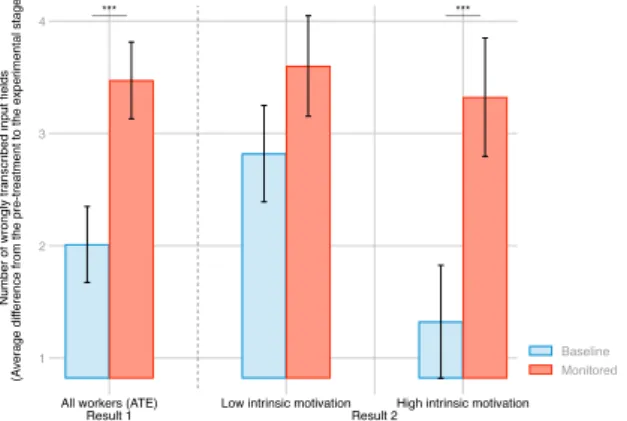
the pre-treatment stage and the experimental stage while non-monitored workers do so by 0.5 pictures only (p < .05). Simultaneously, we observe that the number of transcribed pictures that contain errors is significantly higher among monitored workers: Monitored workers submit on average 2.3 more pictures with transcription errors in the experimen-tal stage, while Baseline workers submit only 1.3 more pictures with errors - a highly significant difference of one additional erroneously coded picture (p < .01), equivalent to
an increase in ERRORS of 16.8%. Columns (2) and (3) in Table 1 confirm these
find-ings. Compared to the Baseline, the Monitored group reduces the number of SKIPS on average by 0.38 pictures (p < .01) and increase the number of ERRORS on average by
0.92 (p < .01). Consistent with Belot and Schröder (2016), we therefore find that
perfor-mance reductions occur in the non-monitored dimension, whereas measured perforperfor-mance in the monitored dimension improves. An important implication of this finding is that it can be difficult for firms to notice the detrimental impact of the monitoring device, as performance metrics in the observable dimension indicate effectiveness.
Hypothesis 2 explores whether Result 1 is the consequence of a uniformly negative
reaction to the monitoring device or whether there is important heterogeneity in workers’
behavioral response. Our findings are summarized in Result 2.
Result 2. The negative performance impact of monitoring is significantly more
pro-nounced among intrinsically motivated workers.
Support for Result 2 can be seen in Figure 3. As explained in Section 2, we use
pre-treatment labor input, captured by time on task, as our measure of intrinsic motivation. We then classify workers into two types, those with high intrinsic motivation and those
with low intrinsic motivation, based on a median split. Figure 3 plots the average
dif-ferences in our outcome variables between the pre-treatment stage and the experimental stage for both treatment groups and by both types of workers.
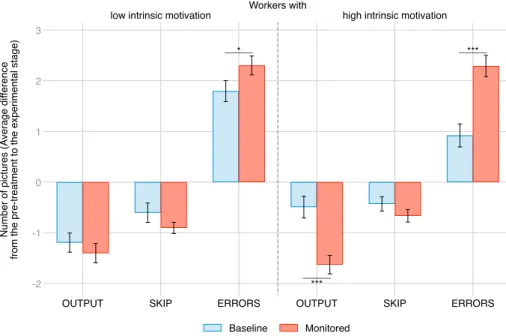
The leftmost bars in the right panel display the number of correctly solved pictures
and provides evidence supporting Result 2: Whereas intrinsically motivated workers in
the Baseline reduce their output by approximately 0.5 pictures, intrinsically motivated workers in the Monitored group reduce output by 1.6 pictures, a highly significant differ-ence of more than one picture. This is equivalent to a decrease of output by approx. 9% (p < .01). For workers with low intrinsic motivation, depicted in the left panel, we do not find significant differences in output between the two treatment groups. Moreover, the negative effect of monitoring on intrinsically motivated workers is significantly stronger
Figure 3: Performance by type of worker
low intrinsic motivation high intrinsic motivation
* _____ *** _____ *** _____ Workers with -2 -1 0 1 2 3 N u mb e r o f p ict u re s (A ve ra g e d iff e re n ce fro m th e p re -t re a tme n t to t h e e xp e ri me n ta l st a g e )
OUTPUT SKIP ERRORS OUTPUT SKIP ERRORS
Baseline Monitored
Note: The graph reports on the vertical axis the number of pictures as an average difference from the pre-treatment to the experimental stage. Errors bars represent the standard error of the mean. The horizontal axis plots work output, represent-ing workers’ performance, and its two dimensions. OUTPUT: Number of correctly solved pictures. SKIP: Number of readable pictures that were declared as unread-able. ERRORS: Number of transcribed pictures that contain an error. Workers are classified into low and high intrinsic motivation based on a median split of pre-treatment work input (measured through time on task). Group sizes: Low intrinsic motivation N=346, whereof Baseline n=161, Monitored n=185. High intrinsic mo-tivation N=347, whereof Baseline n=189, Monitored n=158.
than the negative effect of monitoring on workers with low intrinsic motivation (p < .05). Table 2: Regression Analysis: Intrinsic motivation interacted with the treatment
(1) (2) (3)
OUTPUT SKIP ERRORS
Monitored 0.85 -0.72 -0.14
(0.49) (0.38) (0.51)
Intrinsic motivation 0.18 -0.05 -0.12
(0.05) (0.04) (0.05)
Monitored × Intrinsic motivation -0.20 0.05 0.15
(0.07) (0.04) (0.07) OUTPUT (pre-treatment) 0.74 (0.03) SKIP (pre-treatment) 0.73 (0.05) ERRORS (pre-treatment) 0.67 (0.04) Constant 1.33 0.52 3.68 (0.45) (0.31) (0.43) r2 0.60 0.57 0.43 N 693 693 693
Note: OLS regressions, robust standard errors (in parentheses). Outcome vari-ables are experimental stage measurements. OUTPUT: Number of correctly solved pictures. SKIP: Number of readable pictures that were declared as unreadable. ERRORS: Number of transcribed pictures that contain an error. Intrinsic motivation is captured by work input in the pre-treatment stage, mea-sured through time on task (in minutes). Pre-treatment variables of OUTPUT, SKIP and ERRORS control for the level of workers’ performance before the treatment was induced.
To assess the robustness of these results, we again turn to regression analysis and regress our outcome variables of interest on individual intrinsic motivation, measured continuously as the time spent on the task in the pre-treatment stage. The results are
shown in Table 2. Column (1) reports regressions on the number of correctly solved
pictures. The coefficient of the interaction term between the Monitored group dummy and intrinsic motivation is negative and statistically highly significant (p < .01). This provides further evidence that the performance reduction is primarily a consequence of the crowding out of intrinsic motivation: The higher the intrinsic motivation of a worker, the stronger the negative reaction to monitoring in our data.
Our data allows us to assess whether the performance reduction of the intrinsically motivated workforce happens in the monitored or the non-monitored work dimension.
Figure 3 shows the number of SKIPS as well as ERRORS by treatment and by intrinsic
Monitored group skips less readable pictures in the experimental stage, although the differences do not reach conventional significance levels. When considering ERRORS, however, we see that intrinsically motivated workers in the Monitored group increase the number of submitted transcriptions that contain errors by 2.3, whereas those in the Baseline do so by 0.9 only. The difference of 1.4 additional erroneous transcriptions is
highly significant (p < .01) and corresponds to a 25% increase in ERRORS.21
Columns (2) and (3) in Table 2confirm these findings using regression analysis.
Col-umn (2) shows regression coefficients on the number of skipped pictures. The interaction term between the Monitored group and intrinsic motivation is small in magnitude and the standard errors are large in relation to the coefficient. Column (3) shows the re-gression coefficients on the number of ERRORS. Here, the interaction effect between the Monitored group dummy and intrinsic motivation is negative and statistically significant
(p < .05).22
Taken together, we find that monitoring significantly decreases performance. This performance decrease is primarily driven by the intrinsically motivated workforce, and it occurs in the non-monitored task dimension. The motivation crowding out has implica-tions for the distribution of performance in our workforce, which we turn to next.
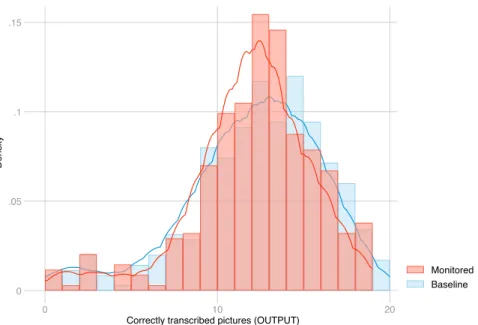
Figure 4 depicts the distribution of correctly solved pictures for the Baseline and
the Monitored treatment in the experimental stage. The kernel density estimates for the Monitored group has more density around the mean of the distribution and flatter tails. Monitoring therefore leads to both a lower frequency of low performing workers and a lower frequency of high performing workers. The distribution is significantly more centered around the mean, and Levene’s test for the equality of variances reveals that, indeed, heterogeneity in worker performance is reduced by monitoring (p < .05). In short, monitoring cultivates the average worker.
21This finding is robust to applying various alternative measurements for work quality, for example error rates instead of the absolute number of errors, errors by single input field instead binary by picture, and errors by single input field per picture (see Appendix Figure A.1). Intrinsically motivated workers in the Monitored group do not only transcribe more pictures erroneously, but also make more errors per picture.
22We further find that monitored workers also reduce work input: The Baseline spent on average 19.8 seconds more in the experimental stage than in the pre-treatment stage, while the Monitored group spent 9.3 seconds less, yielding a treatment effect of 29.1 seconds, equivalent to a decrease of work input of 6.7%. This reduction in work input among the monitored workers is significant (p < .05).
Figure 4: Histogram and kernel density estimates of workers’ performance 0 .05 .1 .15 D e n si ty 0 10 20
Correctly transcribed pictures (OUTPUT)
Monitored Baseline
Note: The graph reports by treatment group a histogram of the variable OUTPUT (number of correctly transcribed pictures). The data are experimental stage mea-surements. The bin width is set to 1 because the data is discrete. Epanechnikov kernel density estimates are overlaid, the default (optimal) width was used.
3.2
Crowding Out Among Complex Tasks
We now turn to our third hypothesis, namely that the crowding out of intrinsic motivation particularly affects performance in more challenging tasks. To assess this hypothesis, we take advantage of the fact that workers are tasked with transcribing pictures of varying difficulty. As detailed in the pre-registration, we exclude the two blurry and unreadable
pictures for the analysis23, order the remaining 18 pictures according to their difficulty and
classify them into three categories. The ordering is objectively based on the performance
of the Baseline group. Our findings are summarized in Result 3.
Result 3. The motivational crowding out leads to a particularly strong performance
reduction among hard-to-solve pictures.
Support for Result 3 is shown in Figure 5a, which plots the mean percentage of
cor-rectly solved pictures by picture difficulty and treatment group. The left panel shows that the monitoring device hardly affects correct transcriptions of easy-to-solve pictures: There are no significant differences in correct transcriptions for the easy and medium cat-egory. However, monitored workers perform significantly worse among hard pictures. The
23As expected, the two unreadable pictures are correctly classified as unreadable by the vast majority of the workforce (97.5% and 96.5%). Excluding these two pictures allows us to create three categories or tertiles, while it does not alter the qualitative results.
Figure 5: Performance by task heterogeneity
(a) Performance by task difficulty
.2 .4 .6 .8 1 A ve ra g e p e rce n ta g e o f co rre ct ly so lve d p ict u re s (e xp e ri me n ta l st a g e ) 1 easy hard3
Task difficulty (in tertiles)
All workers .2 .4 .6 .8 1 A ve ra g e p e rce n ta g e o f co rre ct ly so lve d p ict u re s (e xp e ri me n ta l st a g e ) 1 easy hard3
Task difficulty (in tertiles)
Low intrinsic motivation
.2 .4 .6 .8 1 A ve ra g e p e rce n ta g e o f co rre ct ly so lve d p ict u re s (e xp e ri me n ta l st a g e ) 1 easy hard3
Task difficulty (in tertiles)
High intrinsic motivation
Baseline Monitored
(b) Performance by task laboriousness
.3 .4 .5 .6 .7 .8 A ve ra g e p e rce n ta g e o f co rre ct ly so lve d p ict u re s (e xp e ri me n ta l st a g e ) 1 least laborious 3 most laborious Task laboriousness (in tertiles)
All workers .3 .4 .5 .6 .7 .8 A ve ra g e p e rce n ta g e o f co rre ct ly so lve d p ict u re s (e xp e ri me n ta l st a g e ) 1 least laborious 3 most laborious Task laboriousness (in tertiles)
Low intrinsic motivation
.3 .4 .5 .6 .7 .8 A ve ra g e p e rce n ta g e o f co rre ct ly so lve d p ict u re s (e xp e ri me n ta l st a g e ) 1 least laborious 3 most laborious Task laboriousness (in tertiles)
High intrinsic motivation
Baseline Monitored
Note: By treatment group, the graphs report the average of workers’ performance by task difficulty in the upper panel and task laboriousness in the lower panel, along with the associ-ated standard errors. Performance is measured through cor-rectly solved pictures, representing work OUTPUT. Pictures are classified into difficulty tertiles based on performance of the Baseline group and into task laboriousness tertiles based on time elapsed of the Baseline group. All data are experimental stage measurements.
completion rate in the Baseline averages to 20.4%, while monitored workers achieve only a rate of 16.9%, a significant 3.5 percentage point difference (p < .05) that constitutes a
17.0% decrease in performance.24
When splitting the sample by workers’ intrinsic motivation (see the two panels to the
right in Figure 5a), we find that workers with low intrinsic motivation actually produce
more correctly solved pictures in the easy and medium picture category when monitored (significant with p < .05 and p < .10). In contrast, workers with high intrinsic motivation significantly reduce performance in the medium and hard category (with p < .05 in both categories). The magnitude of the effect amounts to 6.8 percentage points (or 9.9 percent) in the medium category and to 5.2 percentage points (or 21.4 percent) in the hard category.
Figure 5b plots a similar graph but by task laboriousness instead of task difficulty:
Pictures are ordered into laboriousness tertiles based on the average time spent on a picture in the Baseline group. Interestingly, a very similar pattern emerges. In the left panel, we observe that the Monitored group performs worse especially among the pictures that require more labor (p < .10). The panel in the middle depicts that workers with low intrinsic motivation perform better among the least time-demanding pictures (significant in category 1 and 2 with p < .05). On the other hand, workers with high intrinsic motivation reduce performance among the most time-demanding pictures (significant in category 3 with p < .01). The magnitude of the effect amounts to 4.1 percentage points (or 10.0 percent) in category 3 which contains the most laborious pictures.
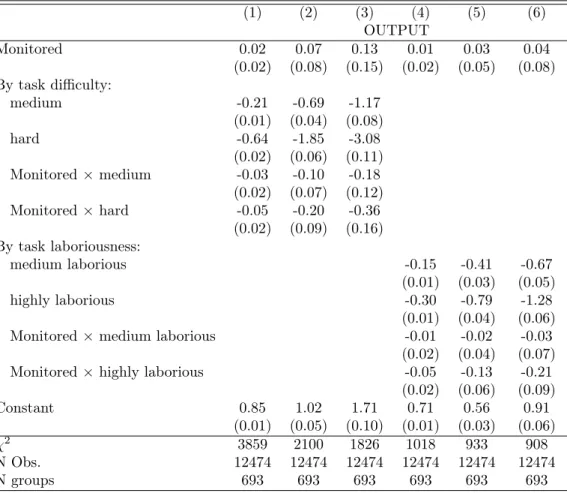
To asses the robustness of our results, we run the pre-registered regression models
shown in Table 3. Column (1) reports the regression coefficients obtained from a linear
probability model: In the Baseline group, workers achieve a completion rate of 84.7% in the easy picture category (Constant), while the Monitored group performs not significantly different. The same is true for medium difficult pictures. Among hard pictures however Baseline workers’ on average solve 20.4% of pictures correctly, while monitored workers perform substantially worse with a 5.1 percentage point reduction. The interaction term between the treatment dummy Monitored and the hard picture category is significant at the 5% level. Column (2) and (3) employ a probit and logit estimator and confirm the result with the same significance level.
24In this subsection, the p values reported in the text are derived from linear regressions with the treatment dummy as a regressor and with robust standard errors, clustered at individual worker level. By doing this, we account for the panel structure of the data set. The results are not sensitive to the linear probability model assumptions and all p values reported hold with the same indicated significance level if a Probit estimator is employed instead.
Table 3: Regression Analysis: Work output by task heterogeneity (1) (2) (3) (4) (5) (6) OUTPUT Monitored 0.02 0.07 0.13 0.01 0.03 0.04 (0.02) (0.08) (0.15) (0.02) (0.05) (0.08) By task difficulty: medium -0.21 -0.69 -1.17 (0.01) (0.04) (0.08) hard -0.64 -1.85 -3.08 (0.02) (0.06) (0.11) Monitored × medium -0.03 -0.10 -0.18 (0.02) (0.07) (0.12) Monitored × hard -0.05 -0.20 -0.36 (0.02) (0.09) (0.16) By task laboriousness: medium laborious -0.15 -0.41 -0.67 (0.01) (0.03) (0.05) highly laborious -0.30 -0.79 -1.28 (0.01) (0.04) (0.06)
Monitored × medium laborious -0.01 -0.02 -0.03
(0.02) (0.04) (0.07)
Monitored × highly laborious -0.05 -0.13 -0.21
(0.02) (0.06) (0.09) Constant 0.85 1.02 1.71 0.71 0.56 0.91 (0.01) (0.05) (0.10) (0.01) (0.03) (0.06) χ2 3859 2100 1826 1018 933 908 N Obs. 12474 12474 12474 12474 12474 12474 N groups 693 693 693 693 693 693
Note: Model (1) and (4) are linear probability models, model (2) and (5) employ a probit estimator and model (3) and (6) a logit estimator. In model (1) to (3), the pictures are classified into three picture categories based on task difficulty, i.e. the performance of the Baseline group with regard to work OUTPUT. In model (4) to (6), the pictures are classified into three categories based on task laboriousness, i.e. the labor input of the Baseline group measured by the time elapsed to transcribe a picture. For both categorizations, the two blurry and unreadable pictures are excluded. All variables elicited in the post-treatment stage. The reference group is easy for model (1) to (3) and least laborious for model (4) to (6). All regressions use the population-averaged model. Robust standard errors (in parentheses), clustered at individual level.
Column (4) reports the regression results for task laboriousness. There are no signifi-cant treatment differences for the least and medium laborious pictures. Yet, we observe the interaction term between the treatment indicator Monitored and the highly laborious pictures to be negative, and significantly so (p < .05). Probit and logit estimations in column (5) and (6) confirm the result obtained from the linear probability model with the same significance level.
To summarize, we provide evidence that monitoring reduces performance particularly among the hard and laborious tasks.
3.3
Quantifying the Costs of Monitoring
What are the costs of the performance reduction for the employer? To answer this ques-tion, we consider a standard and prevalent practice for transcription tasks on AMT, a
concept referred to as “plurality”:25 Because the correct solution is unknown to the
em-ployer at the time of the job posting (which is the very reason for the job posting), workers are dynamically recruited until a certain pre-defined number of workers provide the same response. This matching response is then considered to be the solution. If it is indeed the correct solution, the output generates value for the employer.
We simulate such a plurality mechanism using our data set. We generate observations by randomly drawing workers out of our observed distribution, conditional on the Baseline and the Monitored group, until there are at least 5 workers with matching transcriptions for the 20 pictures in our task. We repeat this exercise 1000 times, 500 times per treatment group. Each repetition generates a single observation with two key outcomes: (1) The number of workers needed to get 5 matching responses for the 20 pictures and (2) The
number of matching responses that are actually correct.26
Table 4 displays descriptive statistics from these simulations. First, we see that on
average 20.3 workers are needed to obtain matching responses for all the 20 pictures when sampling from the Baseline. When sampling form the Monitored group, on average
22.8 workers are needed to achieve this goal, a 12% increase (p < .01).27 Monitoring
25
https://blog.mturk.com/tools-to-evaluate-submitted-work-8af9093858ed
26Remember that the employer in principle does not observe the correct solution but infers it from the matching responses. Because we know the correct solution, we can compare whether the matching responses are indeed correct. This need not be the case as sometimes workers tend to make similar mistakes. As we will see, this is particularly true for hard pictures.
27To assess potential treatment differences in our outcome variables of interest, we use Welch’s t test that accounts for unequal variances. The simulation exercise draws random samples out of our observed population (the experimental data set). This allows us to estimate population parameters and base inference on such under the central assumption that the original sample accurately represents the actual
Table 4: Quantifying the costs of monitoring
(1) (2) (3) (4)
Difference
Baseline Monitored in % p value
Average number of
workers required 20.3 22.8 12% < .01
Average share of
correct solutions .817 .784 -4% < .01
Share of observations with at least X/20 correct solutions:
12/20 (60%) 1 1 - -13/20 (65%) .996 1 0% .16 14/20 (70%) .982 .972 -1% .29 15/20 (75%) .934 .848 -9% < .01 16/20 (80%) .774 .586 -24% < .01 17/20 (85%) .488 .244 -50% < .01 18/20 (90%) .170 .028 -84% < .01 19/20 (95%) .004 .002 -50% .56 20/20 (100%) 0 0 - -N 500 500
Note: In the top row, the table displays the average number of workers required to obtain five matching responses for all 20 pictures. The second row assesses the correctness of these matching responses if pictures are substitutes, mea-sured by the average share of matched pictures that are correct. Therefore, separately by every picture, the algorithm compares the matching response with the correct solution. The table also reports the share of observations with at least X/20 correct solutions to represent a production function in which pictures are complements. For example, if pictures are perfect complements (20/20 or 100% of pictures to be correctly solved), every single picture must be correct for the product to have any value. The relevant measure is the av-erage share of matching responses that are correct for all 20 pictures. Hence, the algorithm compares the matching response with the correct solution and assigns a value of 1 if the matching responses are correct for all 20 pictures; and 0 otherwise. The number of simulations by objective is N = 1000. We report the p values of Welch’s t test to assess if the quality loss is statistically significantly different among the two groups.
thus causes a substantial and significant increase in the number of workers required for obtaining matching responses for the 20 pictures. This finding is a direct consequence of the lower share of correctly provided responses among the difficult pictures at the
individual worker level, as shown in Figure 5a, as this translates into a lower rate of
matching responses for these hard pictures in the plurality algorithm.28
Table 4 displays in the second row the share of provided solutions that are actually
correct. When sampling from the Baseline, we find that 82% of all provided solutions are correct. When sampling from the Monitored Treatment group, only 78% of the provided
solutions are correct, a significant difference of 4 percent.29
Table4also shows the fraction of observations that provides a certain minimum share
of correct solutions. Plurality always leads to a minimum of 12 correctly solved pictures out of the 20. At the same time, it is never the case that all 20 pictures are solved correctly. Interestingly, a significantly higher share of observations that are drawn from the Baseline provide correct solutions for 75% - 90% of the pictures. Most strikingly, while 17% of the observations in the Baseline provide correct solutions to at least 90% of the pictures, only 2.8% of the observations from the Monitored group do so, an 84% reduction.
Based on these observations, we can assess the costs of monitoring for different types of production functions. First, we assume that pictures are perfect substitutes, such that each correctly solved picture is of equal marginal value to the employer. The unit costs of a product (a correctly transcribed picture) is then determined by the number of workers needed to get 5 matching responses as well as the number of correctly solved pictures. The 12% increase in required workers together with the 4% decrease in correctly solved pictures implies that the employer’s unit costs increase by 17%, a substantial cost increase due to monitoring.
population. Our algorithm draws workers randomly without replacement. Hence, within a simulation iteration, the same worker cannot be selected more than once for reaching 5 matching responses. Given the goal of the simulation exercise, we deem it more appropriate to sample without replacement since this ensures that an individual worker is considered only once. As a robustness test, we run the very same simulation exercise on 1000 bootstrap samples: These are samples in which observations are drawn with replacement, resulting in fully independent observations within each sample. The obtained results are very similar for both the point estimates as well as the indicated p values. Results are available upon request.
28We find that the share of correct responses for a picture at the individual level and the number of workers required to obtain 5 matching responses under plurality are negatively correlated (Spearman’s ρ = −.98, p < .01).
29Interestingly, plurality improves the overall performance substantially compared to the performance of workers at the individual level. At the individual level and aggregated over the two groups, workers provide on average the correct solution for 60% of the pictures. The plurality mechanism achieves on average a rate of 80%, a 20 percentage point increase from the individual-level worker data.
The cost increase can be even more pronounced when pictures are assumed to be complementary inputs into a larger product. Assume the firm only receives a positive value if a sufficient fraction of the inputs is without mistakes. In its strongest form, all inputs need to be without a mistake, which resembles an O-Ring production function
(Kremer,1993). Our data allows us to quantify the increase in unit costs due to monitoring
for different degrees of complementary. Table 4shows that it is never the case that all 20
pictures are correctly solved, and only very rarely are 19 out of 20 pictures correctly solved. If inputs are perfect complements or extremely highly complementary, our production process therefore fails in producing valuable output.
However, we find the impact of monitoring on the unit costs to be very substantial for high degrees of complementarity. For example, if the product is only valuable if 75% (15/20 pictures) of the inputs are provided, the 12% increase in required workers along with the 9% decrease in the share of observations that get 15 out of 20 pictures correct imply a 24% increase in unit costs under monitoring. This unit cost increase becomes larger with the degree of complementarity: If 80% of inputs are required for the product to have any value, unit costs increase by 48%. For 85%, unit costs increase by 125%, and for 90%, unit costs increase by a massive 582%.
These very large unit cost increases under the assumption of complementarity in the production process are a direct consequence of the negative performance effect of
mon-itoring on hard tasks30, which we have shown in Section 3.2. In work environments in
which a high quality in all or almost all tasks is necessary for the product to have any value, performance among those hard tasks becomes especially valuable. Put differently, the marginal value of hard tasks rises because they are provided with scarcity.
Our simulation demonstrates that the costs of monitoring can be vastly underestimated by only focusing on the average performance effect - which is what the existing empirical literature has done so far. We show that firms that rely on highly motivated workers to perform difficult tasks that are essential for the firm’s productivity might be particularly hurt from implementing imperfect monitoring schemes. Even if monitoring disciplines a large part of the workforce that performs lower-skilled tasks, monitoring may crowd out the intrinsic motivation of highly motivated workers, who in turn will reduce their productivity in the essential, difficult to perform tasks. If workers provide complementary inputs, this effect can massively exacerbate the unit costs of production.
30The successful transcription rates at the picture level for individual workers and for the plurality mechanism are positively and highly significantly correlated (Spearman’s ρ = .87, p < .01)
4
Concluding Remarks
This article provides novel evidence on the adverse effects of monitoring from a nat-ural field experiment. We document that monitoring crowds out intrinsic motivation and reduces the performance of the intrinsically motivated workforce. We also find that monitoring backfires in so far undocumented ways: Performance reductions are most pro-nounced among difficult tasks. Our findings imply that imperfect monitoring devices can be very harmful (1) for firms with a predominantly intrinsically motivated workforce, and (2) firms who receive particularly high marginal value from performance on challenging tasks, a common characteristic of high-performance work systems or firms with comple-mentarities in production. However, we also find significant unit cost increases even if tasks are perfect substitutes. Nonetheless, in such work environments these costs of moni-toring can more easily be compensated by a potential disciplining effect of the monimoni-toring device.
Our findings align with the observation that control mechanisms are rarely used in
high-performance work-systems (Ichniowski & Shaw, 1999). In high-performance
work-systems, employers rely on worker’s private information to identify those tasks that are particularly valuable to the firm. Because the crucial information is private, the employer cannot implement monitoring mechanisms that account for it. Our findings suggest that implementing imperfect monitoring devices can be particularly detrimental in such in-stances because otherwise, under the plausible assumption that marginal value and dif-ficulty of the task are positively correlated, performance reductions particularly occur at precisely those highly valuable tasks.
We believe that the behavioral heterogeneity in our data has important implications for the design of organizations. Ultimately, how can an organization design incentives schemes that discipline the opportunistic workers without crowding out performance of the intrinsically motivated ones? In this respect, it is important to note that our findings relate to the situation in which monitoring is freshly and uniformly implemented within the existent workforce of a firm. Such an implementation can be interpreted as a signal of distrust from the employer towards the whole workforce. The results do not necessarily generalize to situations in which workers start working in a firm that either uses monitoring technology or does not, or to situations in which only a part of the workforce is confronted with a monitoring device. Such settings would be interesting to study in further research. More generally, the existence of different monitoring regimes across and within firms
raises interesting additional questions in terms of behavioral reactions of workers but also
in terms of worker selection. Kosfeld and Von Siemens(2011) show that separating
equi-libria can exist for opportunistic and conditionally cooperative workers. Do separating equilibria also exist for intrinsically and extrinsically motivated workers? The literature documents self-selection with regard to other behavioral factors, such as overconfidence
(Larkin & Leider, 2012), or a preference for being one’s own boss (Hamilton, 2000;Hurst
& Pugsley, 2011; Bartling, Fehr, & Herz, 2014). It is an interesting empirical and
theo-retical question whether some workers would, for example, be willing to forgo monetary compensation in exchange for less monitoring and more freedom.
References
Alchian, A. A., & Demsetz, H. (1972). Production, information costs, and economic organization. The American Economic Review , 62 (5), 777–795. Retrieved from
http://www.jstor.org/stable/1815199
Angelici, M., & Profeta, P. (2020). Smart-working: Work flexibility without constraints.
CESifo Working Paper No. 8165 . Retrieved from https://ssrn.com/abstract=
3556304
Barrero, J. M., Bloom, N., & Davis, S. J. (2020, December). Why working from
home will stick (Working Paper NO. 2020-174). University of Chicago.
Re-trieved from https://bfi.uchicago.edu/wp-content/uploads/2020/12/BFI_WP
_2020174.pdf
Bartling, B., Fehr, E., & Herz, H. (2014). The intrinsic value of decision rights.
Economet-rica, 82 (6), 2005–2039. Retrieved from http://dx.doi.org/10.3982/ECTA11573
doi: 10.3982/ECTA11573
Bartling, B., Fehr, E., & Schmidt, K. M. (2012, April). Screening, competition, and job design: Economic origins of good jobs. American Economic Review , 102 (2), 834-64.
Retrieved from https://www.aeaweb.org/articles?id=10.1257/aer.102.2.834
doi: 10.1257/aer.102.2.834
Belot, M., & Schröder, M. (2016). The spillover effects of monitoring: A field experiment.
Management Science, 62 (1), 37-45. Retrieved from https://doi.org/10.1287/
mnsc.2014.2089 doi: 10.1287/mnsc.2014.2089
Blackman, R. (2020, May). How to monitor your employees — while respecting their
privacy. Harvard Business Review . Retrieved from https://hbr.org/2020/05/
how-to-monitor-your-employees-while-respecting-their-privacy
Bloom, N., Liang, J., Roberts, J., & Ying, Z. J. (2014, 11). Does Working from Home Work? Evidence from a Chinese Experiment *. The Quarterly Journal of
Eco-nomics, 130 (1), 165-218. Retrieved from https://doi.org/10.1093/qje/qju032
doi: 10.1093/qje/qju032
Boly, A. (2011, May 01). On the incentive effects of monitoring: evidence from the lab
and the field. Experimental Economics, 14 (2), 241–253. Retrieved from https://
doi.org/10.1007/s10683-010-9265-1 doi: 10.1007/s10683-010-9265-1
Bénabou, R., & Tirole, J. (2003, 07). Intrinsic and Extrinsic Motivation. The Review