Science Arts & Métiers (SAM)
is an open access repository that collects the work of Arts et Métiers Institute of Technology researchers and makes it freely available over the web where possible.
This is an author-deposited version published in: https://sam.ensam.eu Handle ID: .http://hdl.handle.net/10985/9873
To cite this version :
Philippe LORONG, Arnaud LARUE, Alexis PERE-DUARTE - Dynamic Study of Thin Wall Part Turning - In: 13th CIRP International Conference on Modeling of Machining Operations, Advances Materials Research, Portugal, 2011-05-12 - Advanced Materials Research - 2011
Any correspondence concerning this service should be sent to the repository Administrator : [email protected]
Dynamic Study of Thin Wall Part Turning
P. Lorong 1*, A. Larue 2, A. Perez Duarte 3
1 Arts et Metiers ParisTech, Lab. PIMM, 151 bd de l'Hôpital, F75013 Paris 2 Mecachrome,27 rue de la Milletière, BP 57347, 37073 Tours
3 SNECMA, SAFRAN, rue H.A. Desbruères, BP81, 91003 Evry
Abstract
The numerical simulation of machining process is a key factor in the control of parts ma-chining process. Its development aims at improving the process reliability and reduces the time spent during the process planning stage. In this context, we use a specific time domain simulation allowing modeling the dynamics of a thin wall part turning operation. After having introduced the basics of the proposed approach we present a specific cut-ting test that has been designed to specifically measure and control the dynamics of the part and the cutting conditions of a finishing toolpath. The influences of the cutting speed and damping coefficient on the chatter occurrence are discussed. In order to better con-trol the simulation uses, an analysis of the simulation parameters influences on the simulated results is proposed.
1 INTRODUCTION
As the material costs increases, the proportion of flexible parts increases in the industry. The machining of flexible parts imposes many prob-lems to the programming services. The numeri-cal simulation is in this case a very interesting alternative to apprehend the design of flexures and can bring a very helpful service to the pro-grammers in the process planning daily devel-opment. One of the main goals of the simulation is the prediction of dynamical instabilities resul-ting from the regenerative phenomenon [1]: ma-terial found by the tool at a time
€
t
depends on the removal of the matter at time€
t − Δt
where€
Δt
is the delay from the removal of the suc-ceeding cutting tooth at the same location. An extensive review dealing with the studies con-ducted on this phenomenon, called regenerative chatter, is given in [2] by Altintas and Weck. Dif-ferent approaches exist. Some of them use ana-lytical stability criterion [3][4], a full or semi-discretization time domain strategies to ap-proximate the monodromy operator in order to evaluate the stability [5][6] or at last "full" time domain approaches [7][8][9]. These last ap-proaches are more expensive (numerically) than the first ones but they allow to handle more complex models (possibly non-linear) and give as results the whole history of the cutting forces and vibrations during the toolpath.They also give the geometry of the machined surface. This is very useful to estimate form and waviness errors.
The proposed paper presents an experimental and numerical study that has been done to ap-prehend the difficulties of the turning of a thin wall part with a time domain approach. A speci-ficity of the used time domain approach is the taking into account of the deformation of the geometric model of the machined surface. The basics of the proposed time domain simulation are presented in the first part of this paper. In the following, to be concise, we restricted our presentation to the proposed turning example. Naturally, the proposed method is able to han-dle all milling and turning flexible cases.
2 HEADLINES OF THE APPROACH
The proposed time domain approach uses the well known Newmark implicit integration sche-me to solve, at each tische-me step , the equilibrium equation (1) coming from the finite element model concerning the workpiece:
€
M ˙ ˙ q (ti) + C ˙ q (ti) + K q(ti) = Qcut
(
q(ti),Γcut(ti))
(1)where is the mass matrix, is the damping
matrix, is the stiffness matrix, represents the column of degrees of freedom,
applied on the workpiece and is the set of cutting sections (possibly on per each tooth) at
.
For each time step an iterative procedure (New-ton-Raphson) is introduced to solve (1) due to
the non-linearity character of .
In-deed, the cutting forces depend on the instan-taneous cutting section which results from the material removal history. Moreover the expres-sion of the cutting forces related to the chip sec-tion may be non-linear. A Kintzle cutting law has been used in this work [10]. The cutting forces are then calculated in a local basis defined along the cutting edge of each tooth and are defined as follows:
where (2)
is the cutting forces component along the direction , b is the local width of cut, h is the local depth of cut, is a reference length, n indicates the outward normal direction of the rake face, t is a direction tangential to the cut-ting edge, r a direction orthogonal with both previous directions, and are parameters depending on the tool/workpiece material com-bination.
is deduced form the intersection between the volume swept by the rake faces during a time step and the actual volume of the work-piece. The actual volume of the workpiece is modeled by a dexel-based volume (multi-level Z-Map model [11], Figure 1) while the volume swept by the rake faces is built using triangular tessellation of these rake faces. This proposal makes the assumption that wherever the tool passes, the corresponding workpiece material disappears. The tool is therefore considered as an erasing tool. In the actual configuration the dexel-based model of the volume is assigned to follow the actual displacement and deformation of the workpiece.
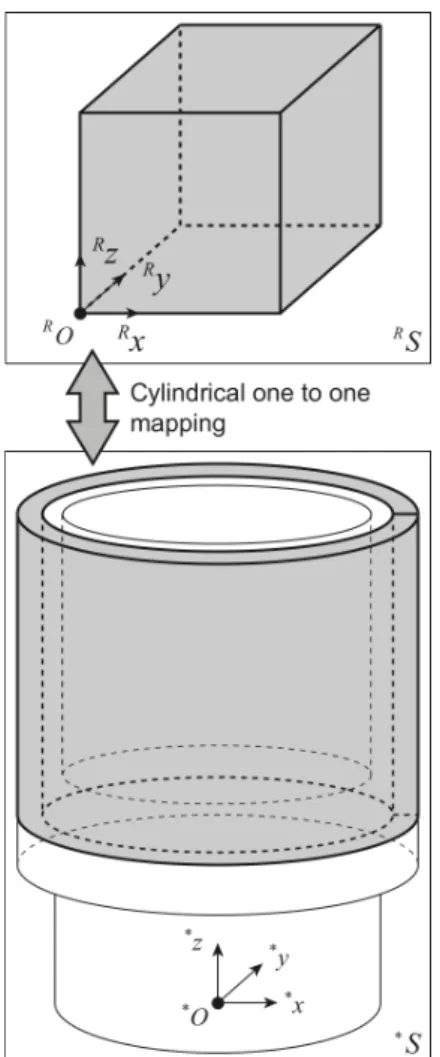
Figure 1: Multi-Level Z-Map model A key point of our approach is to determine the tool/workpiece intersection in a particular
con-figuration, named the reference configuration
RS, where dexels are well distributed (straight
and regularly spaced). A one-to-one mapping allows to move from this reference configuration to an undeformed configuration *S where the definition of the mesh of the workpiece was done (Figure 2). Then another one-to-one map-ping is used to pass from *S to the actual
con-figuration tS of the deformed workpiece and the
actual configuration of the rake faces. This last transformation is defined by using the deforma-tions of the workpiece mesh. More details of this strategy can be found in [12].
3 EXPERIMENTAL SETUP
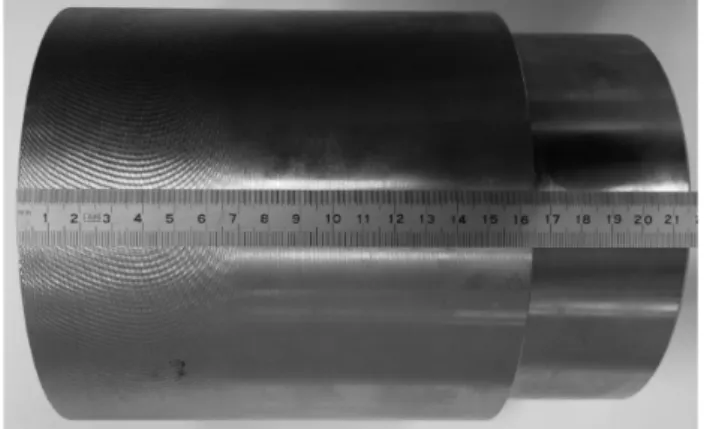
The dynamics of a thin walled turning operation is studied in this paper. The general form of the workpiece is selected to present a dynamic be-havior close to the dynamics of drums (shapes of the eigen modes), components that can be retrieved in turbofan aircraft engines.
Figure 2: One-to-one mapping from RS to *S
The experimental setup was also designed to enable the observation of the geometric defects on the machined surface and to guaranty the occurrence of chatter. As depicted in Figure 3 we choose a part with a high stiffness at the be-ginning of the machining (on the left) which
pro-gressively decreases as to tool progresses to the right.
Figure 3: Section of the machined tube
4 NUMERICAL MODEL 4.1 General description
The numerical model is subdivided in 4 sub-models:
1. The finite element model of the workpiece: 10 nodes tetrahedrons are used for the mesh which is composed of 28,000 tetra-hedrons (44,000 nodes). The characteristics of the material are given by table 1. The cut-ting tool is assumed to be rigid.
2. The dexel description of the workpiece: Fig-ure 2 presents the used one-to-one corres-pondence from the material configuration RS
to the undeformed configuration *S of the
workpiece. In *S the dexels are radial. The
axial distance between 2 dexels is 0.0156 mm which gives 31,640,000 dexels for the whole volume.
3. The geometric model of the tool rake face: a triangular tessellation.
4. The cutting law: the coefficients of the used cutting law are given in table 2.
Young modulus Density Poisson coef.
2.1 1011 Pa 7.85kg/m3 0.3
Table 1: Characteristics of the material
Kr = 245 N Kt = 0 N Kn = 1169 N
nr = 0.134 nt = 0 nn = 0.715
Table 2: Cutting law coefficients
A constant time increment equal to 3.5 10-5s has been used for the time integration and the convergence criterion of the Newton-Raphson iterative scheme is based on a force norm error equal to 10% of the mean cutting forces.
The sizes of the matrices related to equations (1) are important. The system is therefore ex-pressed into the dual space of the eigen modes. Only the 13 first eigen modes are taken (eigen frequencies from 1687 up to 6070 Hz). , and are considered as constant along the machining operation. The set of eigen modes is
therefore also considered as constant along the path.
4.2 Workpiece dynamic model
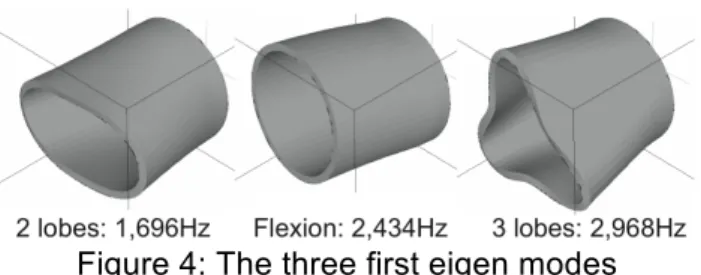
The comparison between the three first experi-mentally obtained eigen values and simulated ones is given table 3. The measurements have been done whereas the workpiece remained mounted in the chuck of the lathe after machin-ing. Eigen modes Measured freq.: Finite El. freq.: 2 lobes 1,595 Hz 1,648 Hz 3.35% bend-ing 2,122 Hz 2,520 Hz 18.75% 3 lobes 2,661 Hz 2,659 Hz -0.08%
Table 3: Eigen frequency comparison real/FE The simulated and experimental results ob-tained for the first and the third one eigen val-ues are very close but this is not the case for the second eigen value. This trend can be ex-plained considering that the influences of the chuck and the jaws, or even of the spindle, are negligible for the modes called “2 lobes” and “3 lobes”: these modes are local to the tube. This is not the case for the bending mode or for any modes which solicited heavily the attachment.
Figure 4: The three first eigen modes This difference is also visible on the relative damping related to each mode. The measured damping coefficient for the “2 lobes” mode is equal to 0,00135, and equal to 0,001 for the “3 lobes” mode, whereas this coefficient is higher than 0,03 for the flexion mode.
For the simulation, the relative damping co-efficients have been chosen equal to 0,00135 for the “2 lobes” mode, equal to 0.001 for the other “local” modes and equal to 0.05 for the modes involving the attachment. These values are very difficult to a priori select. The section 5.5 discusses the influence of damping on the chatter occurrence.
5 RESULTS AND DISCUSSION
Several axial toolpaths were necessary to ob-tain chatter during one of them. Chatter finally occurs during the path which imposed a
reduc-tion of the workpiece thickness from e=9 mm up to e=8 mm. The cutting conditions of the ma-chining operation were the followings:
• Cutting speed: 360m/mn,
• Feed per revolution: 0.25mm/rev, • Radial depth of cut: 1mm.
The simulations were performed on a Macintosh PowerBook laptop with processor Intel Core 2 Duo, 2.5 GHz. The used random access mem-ory was 2,5 GBytes SDRAM (667 MHz) and only one core was used (the program does not exploit parallelism). Generally the simulations were done only on a half-tube and required, in that case, 2 hours by simulation (4 hours for the whole tube).
5.1 Defects of the machined surface
The figure 5 shows the machined part. The chatter zone is clearly visible on the left of the part.
Figure 5: The machined surface
The frequency of chatter varies only very slightly (the observed angle αw results from a
very slow variation of this frequency) during the machining and remains very close to 3014Hz.
Figure 6: Chatter zone and wavelet slope The detailed control of the chatter zone allows to identify the length of the zone affected by the
chatter LB = 73mm ± 1mm and the length from
which the vibrations seem about to be stabilized in amplitude LV = 57mm ± 2mm. It is also
pos-sible to evaluate the number NV = 262 of
wave-lets in the circumferential direction and the slope αw of the wavelets which gradually varies
from 45°± 5° up to 45° ± 5°.
Finally, the minimum and maximum heights of the wavelets ZMin and ZMax have been measured
with respect to the non chattered surface: ZMax =
0.07mm and ZMin = -0.03mm.
5.2 Simulation versus experiment
As shown in Figures 7 and 8, the simulation produces a surface having quite a resemblance with the real surface but also a certain number of differences.
Figure 7: Experiment vs. Simulation - Large The both simulated and experimental surfaces present two series of wavelets. The first series of wavelets, the most visible in Figure 7, pre-sents a circumferential wavelength about 2mm and presents, for the real surface, a variable slope in the axial direction which evolves from 45° up to 45°. For the simulated surface, this series of wavelets presents on the other hand an almost constant slope of average 20°. The difference between the simulated and real fre-quency of chatter is about 9%. A very interest-ing aspect is that the simulation reproduces the fact that the chatter frequency remains almost constant in spite of the local stiffness of the part decreases when the tool progresses in the axial direction.
The second series of wavelets is perpendicular to the axial direction. The wavelength of this se-ries is twice of the feed by revolution. This sec-ond series of wavelets, which are finer than the first series, is clearly visible on the Figure 8. The chatter phenomena occurs later for the simulation (LB = 50mm) than it appears in reality
(LB = 75mm). The distance between the
begin-ning of the chatter and the "stabilized" chatter area is also longer in the reality than in the simulation. The difference of amplitude (ZMax
-ZMin) is twice as important for the simulation.
5.3 Comments on numerical models
To estimate the convergence of the numerical results we compared these results with simula-tions obtained from different values of the nu-merical parameters: the number of modes, the number of dexels and the size of the time in-crement. The increase of the number of modes, the increase of the number of dexels or the de-crease of the time increment do not generate significant differences on the obtained results. As for the number of modes it is interesting to note that a simulation with the only “2 lobes” and “3 lobes” modes is enough to reproduce the occurrence of chatter with however a slightly late occurrence (reduction of LB of
approxi-mately 20%). The choice of the time increment is more critical because beyond a certain value it is not any more possible to correctly repro-duce a phenomenon occurring with a frequency of 3,000Hz. Finally, it has been possible to re-duce the number of dexels by a factor of 2 ( in every direction) without affecting the results. Using such a condition, the only difference ap-pears with more perturbations on the calculated forces and a less detailed surface. The choice of the dexels sizes is directly related to the size of the defects that are to be observed. However a too small size, typically lower than 0.01mm, has no sense regarding the phenomena of ma-terial separation and is not coherent with the assumptions induced by the tool erasing model.
5.4 Tracks to improve the results
To achieve simulations more close to the reality different models can be improved and/or added. The cutting law might be improved. For example an increase of the tangent stiffness of the cut-ting model would tend to create earlier the chat-ter that would lead to move closer it to the re-ality. Besides, in the current numerical model, the consideration of a constant stiffness and a constant mass of the part during the machining
operation can explain the absence of angle
variation. The gyroscopic effect, which is not also taken into account, may also contribute to
explain the observed difference. All these propositions remain naturally to be verified.
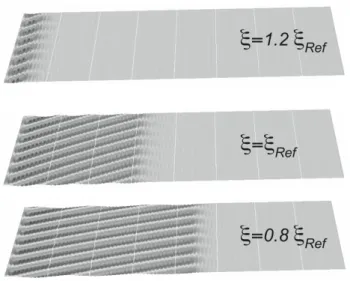
5.5 Influence of damping
This section deals with an important difficulty met during the definition of the numerical model: the modelling of damping. It is indeed particu-larly difficult to estimate the importance of the workpiece holder which plays an important role in the part machinability.
As it can be expected, the damping plays a key role in the chosen example (Figure 9). The ma-chining is almost stable for an increase of only 20% of the relative damping ξ and is much more unstable for a 20% decrease.
Figure 9: Damping influence
5.6 Modulation of the cutting speed
We numerically tested the influence of a peri-odic variation of the cutting speed on the chatter phenomena occurrence. The mathematical form chosen for the spindle frequency is the follow-ing:
. (3)
This means that the frequency of rotation of the spindle is modulated by a factor around the frequency every 5 rotations. Even for a small value of (5 percent) an important effect is observed in the proposed example (Figure 10). The case =10% was not represented in Figure 10 because the phenomenon of chatter did not start any more.
6 CONCLUDING REMARKS
Thanks to the used temporal approach it was possible to qualitatively reproduce the main de-fects observed on the machined surface. Even if differences remain, these first results seem to us very encouraging. Specifics investigations are in progress to improve the present model-ling: the quality of the cutting law, the consider-ations of the mass and part stiffness evolutions during machining as well as the gyroscopic ef-fects will be taken into account in the future. However, the proposed approach allows right now to highlight the main trends based on nu-merical tests, as it can be seen in the sections 5.5 and 5.6. This paper shows that the pro-posed approach enables to study the influences of the main parameters of the model as well as the influences of the main cutting parameters.
ACKNOWLEDGMENTS
This work was supported by the SNECMA-SAFRAN group, under grant YQ/2007/00771.
REFERENCES
[1] Merritt, H.E., 1965, Theory of self-excited machine tool chatter — Research i, J. En-gineering for Industry, 17:447–454.
[2] Altintas, Y, Weck, M, 2004, Chatter Stability of Metal Cutting and Grinding. Annals of the CIRP 53(2):619–642.
[3] Ismail, F.,Soliman, E., 1997, A new method for the identification of stability lobes in ma-chining, Int. J. Machine Tools & Manufactu-re, 37(6):763–774.
[4] Altintas, Y., Enginand, S., Budak, E., 1999, Analytical stability prediction and design of variable pitch cutters. J. of Manufacturing Science and Engineering, 121:173–178. [5] Altintas, Y, Stépan G, Merdol D,
Dombova-ri, Z, 2008, Chatter Stability of Milling in Frequency and Discrete Time Domain, CIRP Journal of Manufacturing Science and Technology, 1:35–44.
[6] Insperger, T., 2010, Full-discretization and semi-discretization for milling stability pre-diction: Some comment, International Jour-nal of Machine Tools & Manufacture, 50:658-662.
[7] Corduan, N., Costes J.-P., Lapujoulade, F., Larue, A., 2006, Experimental Approach of Milling Stability of Thin Walled Parts. Comparison with Time Domain Simulation, CIRP InternationalWorkshop onModeling of Machining Operations, 59–69.
[8] Biermann, A., Kersting, P., Surmann, T., 2010, A general approach to simulating workpiece vibrations during five-axis milling of turbine blades, CIRP Annals - Manufac-turing Technology, 59:125-128.
[9] Coffignal, G, Lorong, P, Planchat, J, Yaqub, S, Larue, A, 2007, Virtual Machining: a Ge-neral Approach to Deal with Flexible Work-pieces, CIRP International Work-shop on Modeling of Machining Operations, 477– 483.
[10] Kienzle, O., 1951, Die bestimmung von kräften und leistungen an spänenden werkzeugen und werkzeugmaschinen. Z-VDI, 94 :299–305.
[11] Choi, B.K., Jerard, R.B., 1998, Sculptured surface machining, Kluwer Academic Pub-lishers.
[12] Lorong, P., Yvonnet, J. Coffignal, G., Cohen, S., 2006, Contribution of Computa-tional Mechanics in Numerical Simulation of Machining and Blanking: State-of-the-Art, Arch. Comput. Meth. Engng., 13(1):45-90.