To link to this article : DOI: 10.1109/IECON.2012.6389275
URL :
https://doi.org/10.1109/IECON.2012.6389275
O
pen
A
rchive
T
oulouse
A
rchive
O
uverte (
OATAO
)
OATAO is an open access repository that collects the work of Toulouse researchers and
makes it freely available over the web where possible.
This is an author-deposited version published in: http://oatao.univ-toulouse.fr/
Eprints ID: 17379
To cite this version: Picot, Antoine and Obeid, Ziad and Régnier, Jérémi and
Maussion, Pascal and Poignant, Sylvain and Darnis, Olivier Bearing fault
Detection in Synchronous Machine based on the Statistical Analysis of Stator
Current. (2012) In: IECON 2012 - 38th Annual Conference on IEEE Industrial
Electronics Society, 25 October 2012 - 28 October 2012 (Montréal, Canada)
Any correspondence concerning this service should be sent to the repository administrator:
[email protected]
Bearing fault Detection in Synchronous Machine
based on the Statistical Analysis of Stator Current
Antoine Picot, Ziad Obeid, Jérémi Régnier and Pascal Maussion
LAPLACE Université de Toulouse
Toulouse, France
Email: [email protected]
Sylvain Poignant and Olivier Darnis
SAFRAN-Technofan Toulouse, France
Email: [email protected], [email protected]
Abstract—In this paper, an original method to compute an indicator for efficient detection of bearing defaults in high speed synchronous machines is presented. This indicator is based on the statistical analysis of the stator current spectrum. The principle of the method is to compare the current spectrum to a healthy reference spectrum. The reference spectrum is used to center and reduce the current spectrum and provides an indication on its difference from the reference spectrum. A statistical based indicator is then constructed as the sum of the contributions of the centered reduced spectrum for different interesting frequency bands. This indicator has been tested on 2 different test campaigns, for 4 different speeds and compared a vibratory indicator. Results show that the proposed indicator evolves the same way than the vibratory indicator and provides with an efficient detection of bearing fault with only very few false alarms.
I. INTRODUCTION
Over the past few years, monitoring has become an im-portant industrial research area in order to assess safety and reliability of electrical machines. There are a lot of different failure causes in electrical machines (overview in [1]). Among them, ball bearing defects are responsible for 40% of machine failures, as shown in [2]. Bearing faults can lead to critical events such as abnormal temperature or vibration level, rotor locking, stator friction, etc. Manufacturers show therefore more and more concerns about monitoring the state of health of bearings in order to guarantee the availability and the predictive maintenance in machine elements like actuators for example.
Vibration analysis has first been used to detect bearing faults ([3], [4], [5]). The characteristic frequencies of the vibration spectrum can indeed be used to detect specific bearing damages. Nevertheless, this solution is often expensive due to the price of vibration sensors (such as piezoelectric accelerometers). Consequently, several studies ([6], [7], [8]) have successfully suggested to process the stator current signal, which is often available for control purposes. Specific signatures linked to bearing faults appear indeed on the stator current spectrum. A review of the different techniques used based on the stator current spectrum analysis is presented in [9]. These techniques mainly concern the induction machine. However, a few work deals with bearing fault detection in permanent magnet machines ([10], [11]).
This paper focuses on bearing fault detection for a high speed permanent magnet synchronous machine (PMSM) be-longing to an air conditioning fan used in aeronautic. The clas-sical stator current signatures related to the vibration bearing frequencies are not suitable for such applications due to their low level. However, some frequencies multiple of the rotation frequency in the stator current spectrum have been proved to be sensitive to the considered faults [12]. A novel detection method based on a statistical process of the stator current spectrum is presented here. This method build indicators based on the deviation from reference distributions computed at the beginning of the recording for different harmonics families in order to enlighten changes in the stator current spectrum.
The outline of this paper is the following. Section II starts with a short description of the studied system and describes the experimental protocol and data used in this work. The bearing fault detection method is then detailed in section III. The process of the stator current is first presented. A brief analysis of the experimental data is then achieved. This section ends with a description of the indicator construction. Results are presented and discussed in section IV along with the strategy of evaluation.
II. MATERIAL A. System description
As previously mentioned, the studied system is an air conditioning fan based (Technofan LP2) with a high-speed permanent magnet synchronous machine. It is used in civil aeronautic to provide air conditioning and renewing. The whole fan is showed in Fig. 1. Its power is 5kV A and its maximum speed Vmax is 14100rpm (rotations per minutes).
This machine has sinusoidal back electromotive forces but is supplied by a pulse width modulation (PWM) inverter operating sequentially to provide 120˚ square wave currents in the three phases of the machine. This kind of control avoids using an accurate position sensor such as resolver. The block diagram of the whole system is depicted in Fig. 2 where Ibus, Iinv, I1,2,3are respectively the bus current, the inverter
current and the the stator current for the 3 phases and Ic, Ve
are the capacity current and the inverter speed used for the system regulation. The PWM is synchronized thanks to three Hall effect sensors. Cris the resistant couple of the machine.
Figure 1. TECHNOFAN LP2 fan - 5kV A - Vmax= 14100rpm
Figure 2. Block diagram of the PMSM Table I
HARMONIC FAMILIES OF THE STATOR CURRENT SPECTRUM
Type Rank
Current (6k ± 1)fs
PWM fswi± (6k ± 1)fs
Rotor kfr
The Fourier transform of the square wave form of the stator current Iscan be expressed as
Is= ∞ X n=1 4π n (sin πn 2 sin πn 3 )sin(2πntfs) (1) with fs the supply frequency. The study of eq. (1) leads to
the identification of the (6k ± 1)fs harmonic family. This
family can be modulated around the switching frequency fswi
because of the PWM. This is expressed by the fswi±(6k±1)fs
harmonic family in current spectrum. Some harmonics linked to the rotor speed can also appear in the current spectrum at the frequencies kfr. The rotor mechanical frequency fr can
be expressed as fr = Npfs where Np is the number of pole
pairs in the machine. The studied machine in this paper has 3 pole pairs. This is resumed in table I.
B. Experimental protocol and data
The experimental protocol consists in two parts measure-ment campaign. The first part is performed with a healthy bearing, and the second one with a faulty bearing. The faulty bearing is artificially aged by a burning grease process at 200˚C during 60 hours and a broken cage. This type of degradation is suitable because it guarantees a vibrational level very close to the healthy level for several hours of operation
Figure 3. Bearing fault diagnostic experimental bench
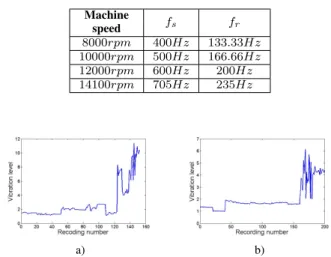
Table II
CHARACTERISTIC FREQUENCIES ACCORDING TO MACHINE SPEED Machine fs fr speed 8000rpm 400Hz 133.33Hz 10000rpm 500Hz 166.66Hz 12000rpm 600Hz 200Hz 14100rpm 705Hz 235Hz a) b)
Figure 4. Vibration indicator for campaign 1 (a) and 2 (b) at 12000rpm
before the first signs of failure. Two test campaigns have been conducted with bearings having followed the same degradation protocol. The experimental bench is presented in Fig. 3.
The measurement of the stator current has been performed using a 18 bits acquisition board with a sampling frequency of 200kHz. Data are recorded every hour with a 5s duration. The measurements have been performed for 4 different mechanical rotation speeds: 8000, 10000, 12000 and 14100rpm. Table II shows the characteristic frequencies fsand frfor the different
speeds.
For the first campaign, the whole dataset represents 84 recordings in the healthy case and 487 recordings in the faulty case. For the second campaign, the whole dataset represents 160 recordings in the healthy case and 902 recordings in the faulty case. Moreover, a vibration sensor has been inserted close to the bearing. A vibration indicator is automatically computed through a FFT by using the RMS (Root Mean Square) value of the signal in a frequency range from 1 to 19 kHz. A vibration indicator example is given in Fig. 4 for campaign 1 (a) and 2 (b) at 12000rpm. In both cases, the bearing was changed around the 40threcordings. It can be seen
in this figure that the vibration indicator is only reacting at the end of the dataset which confirms the fact that the degradation guarantees a vibrational level very close to the healthy level for several hours of operation before the first signs of failure.
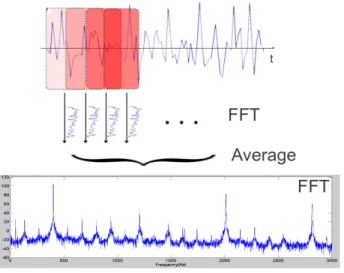
Figure 5. Principle of the FFT computation using Welch’s method
III. BEARING FAULT DETECTION METHOD A. Stator current processing
First, the spectrum of the stator current signal Is is
com-puted using a Fast Fourier Transform (FFT). It is comcom-puted on every recording using Welch’s periodogram method ([13]) with a 1s Hamming window with 50% overlapping. The principle of this method is to compute the FFT of a signal as the average of FFT computed on overlapping segments of this signal. This principle is depicted in Fig. 5. This method has been chosen in order to reduce the noise of the spectrum. The next step is to center and reduce the spectrum of every recording. For this purpose, the average µ and the standard deviation σ are calculated on the first recordings for each frequency bin f according (2) and (3). These measures are considered to be a reference of the healthy machine. The length of the reference is noted nref.
µ(f ) = nref X i=1 F F T (f ) nref (2) σ(f ) =pE[(F F T (f ) − µ(f ))2] (3)
The centered reduced spectrum CRF F T is then computed
for every recordings as the difference between the spectrum F F T and the average reference µ divided by the standard deviation σ according (4).
CRF F T(f ) =
F F T (f ) − µ(f )
σ(f ) (4)
To center and to reduce the current spectrum comes to perform a Student t-test to evaluate if the FFT values are close to those of the reference. As the reference is computed with the first healthy recordings, for a specific frequency, small values means that the frequency behavior is close to the healthy one. Otherwise, the more faulty the recording, the higher the
Figure 6. Examples of FFT (a) and centered reduced FFT (b)
value. One advantage of this technique is that the Student t-test is normalized. The same range of values is then obtained whatever the frequency.
Examples of FFT (a) and centered reduced FFT (b) are given in Fig. 6. The reference was computed on nref = 15
recordings. Values shorter than 3 on the centered reduced FFTs have been put to 0 as they can be considered as really close to the heathy values according the Student t-test table.
It can be seen in Fig. 6 that although no evident change appears in the FFT representation (a), the centered reduced representation (b) shows that the stator current spectrum moves away from the reference over time, which seems to match with the bearing deterioration.
B. Experimental data analysis
The stator current signals recorded during experimental campaigns 1 and 2 are processed using the method presented in III-A. The centered reduced data are then summed for every frequency bin in order to locate the frequency fmax where
there are the most changes from the reference. It is computed according (5). Table III presents the result for each speed.
fmax= max f (
X
recordings
CRF F T(f )) (5)
The analysis of the different frequencies presented in table III shows that they are all fs and fr multiples (cf table II)
except for 10000rpm in campaign 1. It seems indeed that fmax = 3fs = 9fr for campaign 1 and fmax = fs = 3fr
for campaign 2. The same frequencies are not reacting in campaign 1 and 2. It can be explained by the fact that the bearing is not deteriorating the same way in both campaigns,
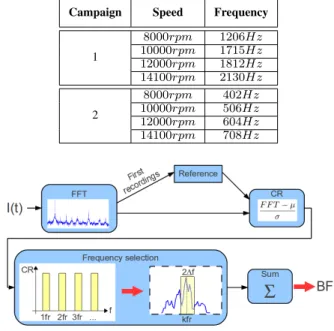
Table III
FREQUENCIES WHERE THE MOST CHANGES ARE DETECTED OVER TIME
Campaign Speed Frequency
1 8000rpm 1206Hz 10000rpm 1715Hz 12000rpm 1812Hz 14100rpm 2130Hz 2 8000rpm 402Hz 10000rpm 506Hz 12000rpm 604Hz 14100rpm 708Hz
Figure 7. Principle of the proposed method
as shown by the vibration sensor in both cases (cf Fig. 4 (a) and (b) in section II-B). Nevertheless, they are all linked to the same frequency and with the same ratio for the same campaign (i.e. for the same default). When these frequencies are compared the theoretical harmonic families presented in table I (section II-A), it appears that the only harmonic family linked to the found frequencies fmax is the one due to the
rotor speed kfr. The one linked to the current form is indeed
not possible because fmax = 3fs is not part of the family
(6k ± 1)fs.
This result is not absurd as it seems logical that if there is a bearing fault, it will have an impact at every turn and so be linked the rotor speed.
C. Indicator construction
It is decided to monitor the kfr family as the analysis
pro-cessed in section III-B demonstrates that changes appear for frequencies in this family. The bearing fault indicator BF I is then computed in the following way. For each recording r, the FFT of the stator current is computed, centered and reduced as described in section III-A. The indicator is calculated as the sum of the centered reduced FFT amplitude around the frequencies kfr with a tolerance ±∆f according (6). It is
normalised by the number of frequency bins nbinsused in the
calculation. The principle of the method is depicted in Fig. 7. BF I(r) =X
k
CRF F T(kfr± ∆f )
nbins
(6) The indicator is computed for every 5s recording. The tolerance used was ∆f = 10Hz. The kfr frequencies were
computed till k = 12 in order to have the same number of
Figure 8. Example of the instant TChange when the bearing is changed
by a faulty one and the instant TDef ault when the vibration indicator starts
reacting
frequency bins at each speed and to restrain the indicator to frequencies lower than (6 − 1)fs.
IV. RESULTS AND DISCUSSION A. Evaluation protocol
Vibration indicators are traditionally used to monitor bear-ing state of health. So, the proposed indicator is compared to the vibration indicator recorded during test campaigns 1 and 2. The correlation coefficient r between indicators obtained with the present method and vibration indicators is computed to evaluate if they are reacting the same way. Correlation coefficients measure the extent to which two variables are cor-related. The absolute value of this coefficient varies between 0 and 1. The closer to 1 the absolute value is, the stronger the linear relationship is between the two variables. Correlation was chosen because the indicators have different natures so it was not possible to directly compare the values obtained.
The time when the bearing has been replaced by a faulty one has also been marked during the campaign. Nevertheless, when the bearing is changed, its behavior is still close to healthy for one hundred hours or so and becomes really faulty only during the last working hours. Two instants are then defined on the vibration indicator: the one when the bearing is changed by a faulty one TChange and the one when the vibration indicator
starts highly to react TDef ault. These two instants are depicted
in Fig. 8.
The statistic based indicator is evaluated on is ability to separate healthy, faulty and very faulty cases. For faulty and very faulty cases, the true positive rate T Prate or sensibility
can be defined as the ratio between the number of correct faulty or (very faulty) detections and the total number of faulty (or very faulty) cases to detect, according (7). The false positive rate F Prate or false alarms rate can also be defined
as the ratio between the number of false detections and the number of healthy cases, according (8). The closer to 1 the T Prate and the closer to 0 the F Prate, the more accurate the
detection. T Prate=
N umber of correct detections
Table IV
RESULTS OF THE STATISTIC BASED INDICATOR ON CAMPAIGN1 Speed (rpm) 8000 10000 12000 14100 Correlation 0.748 0.789 0.766 0.756 T Prate(f aulty) 94.6% 50.8% 51.4% 91.4%
T Prate(very f aulty) 96.0% 70.2% 82.7% 56.4%
F Prate 0% 0% 5.7% 7.9%
Table V
RESULTS OF THE STATISTIC BASED INDICATOR ON CAMPAIGN2 Speed (rpm) 8000 10000 12000 14100 Correlation 0.770 0.718 0.527 0.849 T Prate(f aulty) 90.7% 42.1% 82.6% 71.8%
T Prate(very f aulty) 63.3% 50.1% 48.7% 62.7%
F Prate 2.5% 0% 0% 4.8%
Table VI
OVERALL RESULTS OF THE STATISTIC BASED INDICATOR Campaign 1 Campaign 2 Overall
Correlation 0.765 0.716 0.731
T Prate(f aulty) 72.1% 71.8% 72.0%
T Prate(very f aulty) 76.3% 56.2% 66.3%
F Prate 3.4% 1.9% 2.7%
F Prate=
N umber of f alse detections
T otal number of healthy cases (8) B. Results
The statistic based indicator has been computed on data from campaigns 1 and 2 (presented in II-B). The indicator is computed on every 5s recording. The indicator was computed using the first 15 recordings as a reference. The recording is considered to be a “faulty” case if the indicator is greater than a threshold sf = 0.3 and to be a “very faulty” case if greater
than svf = 0.8. The same thresholds were used for every
campaign and every speed. These thresholds were empirically chosen as they seem satisfying thresholds for correct “faulty” and “very faulty” detections. The results obtained on campaign 1 are presented in table IV and the ones obtained on campaign 2 in table V. Table VI presents the overall results on both campaigns 1 and 2.
C. Discussion
First, it can be seen in table VI that the overall correlation between statistic based and vibratory indicators is high with r = 0.784. A detailed analysis of correlation results presented in tables IV and VI shows that the correlation is always strong whatever the machine speed as the correlation rate is fluctuating between r = 0.680 and r = 0.881. This means that the proposed indicator evolves the same way than the vibratory indicator. Nevertheless, a close look at the results obtained for the indicator with the lowest correlation rate (campaign 2, speed = 12000rpm, r = 0.680) indicates that the detection of “faulty” and “very faulty” cases is relevant with about 80% of correct detections for both.
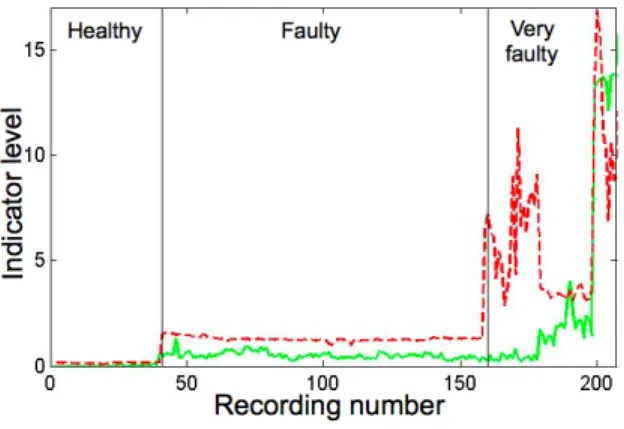
Figure 9. Statistic based (plain) and vibratory (dotted) indicators at 8000rpm in campaign 2
Table VI shows also that the proposed method has very few false alarms with an overall rate of F Prate= 2.7% . The
de-tailed results of tables IV and V confirm this very good result and shows that there is besides no false alarms in half cases (speed = 8000rpm and speed = 10000rpm in campaign 1 and speed = 10000rpm and speed = 12000rpm in campaign 2). The very low false alarms rate is really interesting because this is often required for industrial applications. Here again, tables IV and V show that there are only few variations of the false alarms rate whatever the campaign and the speed.
According table VI, the detection rate of “faulty” cases is good with the overall T Prate(f aulty) = 72%. The rate of
correct “faulty ” detections is as good for both campaigns. However, the detailed scores in table IV and V show some disparity between the T Prate(f aulty) for the different speed.
Concerning the low “faulty” detection rates, the fact that a faulty bearing works almost as a healthy one at the beginning may explain why it is sometimes difficult to detect the “faulty” cases. Moreover, we mainly want to be able to detect “very faulty” cases which are linked to the last hours before the bearing breaks. So this issue should not be that big of a deal. The analysis of the correct detections rate of “very faulty” cases shows that the method reach good detection performance for campaign 1 (T Prate(very f aulty) = 76.3) but the results
drop down to T Prate(very f aulty) = 56.2 in campaign 2.
However, a detailed analysis of the difference between the vibratory indicator and the proposed one enlightens that the “very faulty” cases are correctly detected, but a bit later than with the vibratory indicator, which explains the decrease of the T Prate(very f aulty) in campaign 2. An example is given
in Fig. 9 for speed = 8000rpm in campaign 2. The vibratory indicator is pictured by the dotted line and the statistical based indicator by the plain line. The vertical lines correspond to instants TChange and TDef ault. A linear transformation has
been applied on the vibratory indicator so it evolves in the same values range than the proposed indicator.
It can be seen Fig. 9 that the indicators evolve almost the same way (which is confirmed by the high correlation rate (r = 0.770)) except for the first abrupt change of the vibratory
indicator at the limit between the “faulty” and the “very faulty” parts. However, the statistic based indicator reacts a few recordings later and makes it possible to detect the bearing default soon enough before the bearing breaks (30 recordings before, that is about 20 hours of working). So, even if the T Pratemight seem a bit low, the bearing default is perfectly
detected using the proposed indicator.
Finally, the fact that all these results were obtained with the same thresholds is a really important point. This is an expected result as the operation that centers and reduces the stator current spectrum can be seen as a normalization operation. Once the spectrum is centered and reduced, the amplitudes for the different frequency bins evolve in the same range of values. That explains why the statistic based indicators evolves in the same range of values. This is interesting because this means the method does not need to be tuned. The tuning is indeed done by itself when computing the reference spectrum with the first recordings.
As the reference spectrum is computed on-line during the first hours of working, industrial applications seem possible as the healthy spectrum will be particular to every machine. In the case of a running-in period, the healthy spectrum might have to be computed a bit later. This methodology can also be applied to induction machine but probably on different monitoring frequencies which would require another experimental data analysis.
The apparition of harmonics due to other non-fault related phenoma should not disturb the proposed indicator as long as they do not appear in the monitored frequency bands.
V. CONCLUSION
An original method for bearing fault detection has been presented in this paper. This method proposes to center and reduce the stator current spectrum with a reference spectrum computed with the first recordings. This reference is consid-ered as a "healthy" reference. The centconsid-ered reduced spectrum gives an indication on how much the stator current spectrum changed from the reference, similar to a t-student statistical test. An indicator is then computed by summing the centered reduced spectrum contributions on the kfr frequency family
as it has been found to be a the most reacting family to bearing fault. This statistical based indicator has been tested on 2 different test campaigns for 4 different speeds. It provides with an accurate estimation of bearing state of health and evolves the same way than the vibratory indicator (overall correlation rate of r = 0.784), often used as a reference. Moreover, this indicator is normalized and provides with an accurate detection rate of “very faulty” bearing but sometimes a bi later than with the vibratory indicator. The proposed method has a very low false alarms rate (overall F Prate = 2.7%) and use the same
threshold on the 2 different test campaigns whatever the speed. Further studies needs to be done to better understand and explain the variations of the detection accuracy of “faulty” and “very faulty” cases. The choice of the frequency family could also be improved using faulty bearing model to predict the frequencies likely to react to bearing faults. This approach
could also be used to detect and classify different kinds of bearing faults, supposing they have different frequency signatures or it can be applied to other type of machines such as induction machines. Finally, it will be really interesting to compare this method to other indicators constructed from the stator current such as [12].
ACKNOWLEDGMENT
This work is part of the French national project PREMEP [14] (PRojEt Moteur Electronique de Pilotage), labelled by the Aerospace Valley cluster and involving the LAPLACE and Airbus suppliers such as Technofan, Liebherr Aerospace, CIRTEM, DELTY and ADN.
REFERENCES
[1] P. J. Tavner, “Review of condition monitoring of rotating electrical machines,” IET electric power applications, vol. 2 (4), pp. 215–247, 2008.
[2] S. Jeevanand, B. Singh, B. Panigrahi, and V. Negi, “State of art on condition monitoring of induction motors,” in Proc. of the Joint Intl. Conf. on Power Electronics, Drives and Energy Systems (PEDES), 2011, pp. 1–7.
[3] S. McInerny and Y. Dai, “Basic vibration signal processing for bearing fault detection,” IEEE Trans. on Education, vol. 46 (1), pp. 149–156, 2003.
[4] A. Sadoughi, M. Ebrahimi, and E. Razaei, “A new approach for induction motor broken bar diagnosis by using vibration spectrum,” in Proc. of the International Joint Conf. SICE-ICASE, 2006.
[5] W. Zhaoxia, L. Fen, Y. Shujuan, and W. Bin, “Motor fault diagnosis based on the vibration signal testing and analysis,” in Proc. of the 3rd international Symposium of Intelligent Information Technology Applica-tion, Nanchang, China, 2009, pp. 433–436.
[6] H. Henao, H. Razik, and G.-A. Capolino, “Analytical approach of the stator current frequency harmonics computation for detection of induction machine rotor faults,” IEEE Trans. on Industry Applications, vol. 41, no. 3, pp. 801–807, 2005.
[7] M. Blodt, M. Chabert, J. Regnier, and J. Faucher, “Mechanical load fault detection in induction motors by stator current time-frequency analysis,” IEEE Trans. on Industry Applications, vol. 42(6), pp. 1454–1463, 2006. [8] B. Trajin, J. Regnier, and J. Faucher, “Comparison between vibration and stator current analysis for the detection of bearing faults in asynchronous drives,” IET electric power applications, vol. 4(2), pp. 90–100, 2010. [9] W. Zhou, T. Habetler, and R. Harley, “Stator current-based bearing
fault detection techniques: A general review,” in Proc. of the IEEE Int. Symposium on Diagnostics for Electric Machines, Power Electronics and Drives, Cracow, Poland, 2007, pp. 7–10.
[10] J. Rosero, J. Romeral, J. Cusido, J. Ortega, and A. Garcia, “Fault detection of eccentricity and bearing damage in a pmsm by means of wavelet transforms decomposition of the stator current,” in Proc. of the 23rd IEEE Applied Power Electronics Conference and Exposition, Austin (TX), USA, 2008, pp. 111–116.
[11] B. Ebrahimi, J. Faiz, and M. Roshtkhari, “Static-, dynamic-, and mixed-eccentricity fault diagnoses in permanent-magnet synchronous motors,” IEEE Trans. on Industrial Electronics, vol. 56(11), pp. 4727–4739, 2009. [12] Z. Obeid, S. Poignant, J. Régnier, and P. Maussion, “Stator current based indicators for bearing fault detection in synchronous machine by statistical frequency selection,” in Proc. of the 37th Conf. on IEEE Indistrial Electronics Society, Melbourne, Autralia, 2011, pp. 2036– 2041.
[13] P. Welch, “The use of fast fourier transform for the estimation of power spectra: A method based on time averaging over short, modified periodograms,” IEEE Trans. on Audio & Electroacoustics, vol. 15, pp. 70–73, 1967.
[14] O. Darnis, S. Poignant, K. Benmachou, M. Couderc, Z. Obeid, M. Nguyen, J. Régnier, D. Malec, D. Mary, and P. Maussion, “Premep, a research project on electric motor optimization, diagnostic and power electronics for aeronautical applications,” in Proc. of the International Conference on Recent Advances in Aerospace Actuation Systems and Components, Toulouse, France, 2010, pp. 127–132.