Improved stator current spectral analysis technique for bearing fault diagnosis
Ahmed Hamida BOUDINAR Electrical Engineering Faculty, Diagnosis Group
University of Sciences and Technology of Oran Oran, Algeria
Email : [email protected]
[email protected] Noureddine BENOUZZA
Electrical Engineering Faculty, Diagnosis Group University of Sciences and Technology of Oran
Oran, Algeria Email : [email protected]
Azeddine BENDIABDELLAH Electrical Engineering Faculty, Diagnosis Group
University of Sciences and Technology of Oran Oran, Algeria
Email : [email protected]
Mohamed Ferradj
Electrical Engineering Faculty, Diagnosis Group University of Sciences and Technology of Oran
Oran, Algeria Email : [email protected]
Abstract—Although detection of bearing faults from vibration
signal has been extensively used, detection using electrical signal such as the stator current has also proven to be interesting and relevant, but improvements of the stator current spectrum are necessary so as to assist in a more readable signal. In this paper, two improvements have been proposed and discussed. Firstly, the proposition of a designed and realized anti-aliasing filter to be inserted in the acquisition chain so as to improve the processed signals quality. Secondly, the proposition of a developed algorithm to enable the maxima localization in a given frequency band for a more readable stator current spectrum. The experimental results obtained, show the merit and effectiveness of the proposed contribution.
Keywords—Bearings faults; Current Spectrum; Antialiasing filter; Maximum localization.
I. I
NTRODUCTIONThe development known to human kind in various sectors has lead to the increase use of electric motors which have become very important and essential in many industrial applications. Indeed, an unexpected shutdown of these motors could have very serious consequences in certain critical services such as medical, transportation, or during military operations. In industry these failures not only can cause the shutdown of the entire production chain resulting in huge financial losses but may also affect the human safety and the service quality [1].
Among the major components that constitute the vast majority of electrical machines we include the bearings. The bearing is basically an organ which provides a movable liaison between two parts of a mechanism in relative rotation to each other. They are responsible for the conversion of energy and should therefore act as an electromechanical interface with a precision and with a minimum friction. Unfortunately, this role makes them more fragile. Indeed, a reliability study conducted
on a large number of high power induction motors of the petrochemical industry, has established statistically different faults that can occur. It was found that the bearing faults are the most common faults in induction machines estimated at over 52% compared to other faults [2], see Fig. 1.
Fig. 1. Distribution of various faults in an induction motor
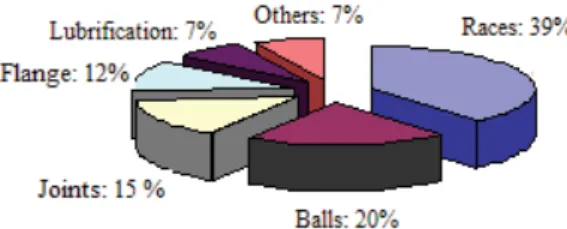
Most of the bearing faults affect the geometrical shape of the rolling surface. These faults are due to cracks in the two inner and outer races or due to cage damage. Another statistical study was conducted by General Electric Company [3]. The study which covered about 5,000 drivers; 97% of which were three- phase cage induction motors; shows that over 39% of bearing faults occur at the races level, see Fig. 2.
Fig. 2. Distribution of various faults in a ball bearing
In order to diagnose these faults, several techniques have
been developed, depending on the measurable physical
quantity selected. Among these techniques, the vibration
approach is considered to be a popular one, used extensively in bearing fault diagnosis. Another very promising approach for bearing faults detection is based on the analysis of an electrical signal technique; this is the stator current analysis technique.
The main strength of this technique compared to the vibration one lies in the instrumentation used, its ease of implementation as well as the wealth of information provided on the existence or not of a fault as well as its severity.
In addition to the various diagnostic techniques, several signal processing methods have also been developed for the diagnosis of electrical machines. The most commonly used in industry are methods based on the estimation of the Power Spectral Density “PSD” using the periodogram algorithm [4-5].
However, the PSD method has several disadvantages which are mainly due to the problem of frequency resolution and the selected window function. In order to properly analyze a spectrum, it is advantageous to have a main lobe as narrow as possible and the side lobes as low as possible. This situation is impossible to achieve simultaneously by the PSD [5]. In addition, having a rich stator current spectrum, does not necessary imply that all harmonics reflect the state of the motor. Some harmonics may for instance be related to electromagnetic noises; these are random disturbances that are not being properly filtered during the current acquisition. These harmonics even if they are high frequencies, they can appear on the low frequency bands due to the sampling signal operation.
This is known as the spectral aliasing.
In this paper, the stator current spectral analysis is being discussed and applied for bearing faults detection. The purpose of this work is to introduce two main improvements in the stator current analysis. The first proposal is concerned with the spectrum quality improvement and is dealt with by the design and realization of an anti-aliasing filter “AAF”. The second proposal is concerned with the spectrum readability improvement and is taken in charge by adding to the PSD calculation a maxima localization algorithm “MLA” over a determined frequency band.
II. B
EARINGF
AULT DIAGNOSIS BY STATOR CURRENT SPECTRAL ANALYSIS TECHNIQUEThe ball bearings type is the most widely used in electrical machines. They consist mainly of the outer race, the inner race, the balls and the cage ensuring equidistance between the balls.
Fig. 3 shows the geometry of a radial ball bearing contact.
Fig. 3. A typical bearing geometry
The possibility of bearing faults detection in induction machines has been studied extensively using vibration
monitoring [4, 6]. Theoretically, several studies [1, 4, 6-9] have shown that in vibration analysis, it is possible to observe certain frequency bands to identify the type of bearing fault.
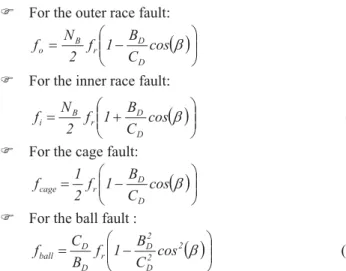
Expressions of these characteristic mechanical vibration frequencies which depend on the geometry of the bearing and the shaft speed are summarized as follows:
) For the outer race fault:
¸¸ ¹
¨¨ ·
©
§ cos E
C 1 B 2 f f N
D D r B
o
(1)
) For the inner race fault:
¸¸ ¹
¨¨ ·
©
§ cos E
C 1 B 2 f f N
D D r B
i
(2) ) For the cage fault:
¸¸ ¹
¨¨ ·
©
§ cos E
C 1 B 2 f f 1
D r D
cage
(3) ) For the ball fault :
¸¸ ¹
·
¨¨ ©
§
2 2E
D 2 D r D D
ball
cos
C 1 B B f
f C
Where, f
ris the shaft speed frequency, N
Bthe number of balls, B
Dthe ball diameter, C
Dthe pitch diameter of the bearing and E is the contact angle as shown in Fig. 3.
Unfortunately, the reliability of the results in this technique is strongly associated with the position of the accelerometers placed on the motors along the vertical, axial and radial axes.
This is in fact the main drawback of the vibration technique [9], besides being also affected by the speed of the machine, especially when the bearings are deteriorated. However, monitoring stator current lines is proved to be by far the most interesting and attractive for bearing fault detection and this is due to the two main following reasons:
The stator current can be used to diagnose both electrical and mechanical faults such as, phase imbalances, inter-turn short circuits in stator windings, bearings failure, bent shaft, broken bar, etc ...
The stator current is very easy to access, since it is in general already used to control the motor and can be measured directly at the power supply unit.
By assuming that the air gap is not constant during a bearing fault, Schoen and coauthors [9-10] have shown that this information is also present in the stator current spectrum and is defined by the following expression:
v s bear
( Hz ) f k . f
f r
Where k=1,2,3…, f
sis the supply frequency, f
vis one of the four characteristic mechanical vibration frequencies “f
o, f
i, f
cageand f
ball”.
III. S
TATOR CURRENT SPECTRAL ANALYSIS TECHNIQUE IMPROVEMENTSImprovements of the stator current spectral analysis are
necessary so as to assist in a more readable signal for bearing
faults detection.
A. Effect of the Anti-Aliasing Filter “AAF” on the quality of the signal processing
The sensors of the stator phase currents of an induction machine are usually placed in an environment electromagnetically polluted. Indeed, machines and static converters radiate electromagnetic fields that can induce interference, creating an additive noise measurement. In the case where electromagnetic interferences; even at very high frequencies; are occurring upstream of the sensor, these can appear on the current spectrum low frequency bands due to a bad choice of sampling and cut-off frequencies. It is this phenomenon that is called the spectral aliasing. For this reason, and in order to eliminate these parasites, an AAF is being designed and realized to be part of the acquisition chain. This filter is a low-pass filter of the 4th order having attenuation of -80dB/decade and an adjustable cut-off frequency. Fig. 4 shows the photo and the location of the realized AAF in the acquisition chain.
(a)
(b)
Fig.4. (a) Photo of the realized AAF; (b) The AAF location in the acquisition chain
B. Effect of the Maxima Localization Algorithm “MLA” on the readability of the signal processing
This proposal concerns the improvement of the readability of the stator current spectrum by adding to the PSD calculation a Maxima Localization Algorithm “MLA” on a determined frequency band. Indeed, although the spectrum of the stator current is rich in harmonics, the signature of a bearing fault;
that is the fault harmonics; only appears in a given frequency band, depending on the nature of the fault, the bearing size and the shaft speed. In this paper, the spectral analysis is therefore limited only to this frequency band. Moreover, if the fault is an incipient fault, then its signature amplitude appears only slightly higher than the other harmonics.
For this reason, we have developed an algorithm so as to localize numerically the maximum harmonic reflecting the fault by processing only the frequency bands where may appear its signature. Furthermore, the analysis of each phase current
apart may be detrimental in computation time. For this, we prefer to make a spectral analysis of the combination of the three currents “using Fortescue transformation”, resulting in the direct symmetrical component Isd given as [11]:
3 I.
a I . a
I I
sc2 sb sa sd
Where I
sa, I
sband I
scare the Fourier transforms of the three phases currents and a e
j.2S/3.
Procedure for bearing fault diagnosis
1. Acquisition of the phase currents after filtering with the AAF.
2. Calculation of the direct symmetrical component Isd from equation (6).
3. Determination of the processed frequency band, the band which is likely to show the signature of the required fault.
4. Localization of the maximum harmonic in the chosen frequency band.
5. Verification if the localized frequency corresponds to that obtained by calculation.
IV. E
XPERIMENTAL RESULTS OF BEARING FAULTS DIAGNOSISThe objective of this section is to show the merits of the proposed improvements and to verify the agreement between the theoretical values of the characteristic frequencies of the different bearing faults and those found by experimental tests in the laboratory.
A. Test rig and acquisition parameters
The main experimental tests that are being presented in this paper are carried out by the diagnosis group in the laboratory of development of electrical drives “LDEE”. The motor used is a three-phase squirrel cage motor coupled to a DC generator. The motor parameters are given in appendix A. The bearing in the motor to be diagnosed is of ball bearing type of reference 6205- ZZ “opposite side to coupling”, in which its different geometric parameters are given in appendix B. The bearing faults dealt with are artificially created by drills in order to simulate the same situations as real ones. Fig. 5 illustrates the faults created in the bearings used in our experimental tests.
(a) (b) (c)
Fig.5. Artificial bearing faults. (a) Cage fault; (b) Outer race fault
“ 3mm diameter“; (c) Outer race fault “ 6mm diameter“
The measuring system includes two current Hall Effect sensors, an anti-aliasing filter AAF with a 400 Hz adjustable cut-off frequency chosen for our tests and an acquisition card.
The whole set is connected to a computer for viewing the
processed sensed signal as shown in Fig. 6. In addition, a tachometer is used for measuring the actual shaft speed of the motor.
Fig. 6. Test rig
All acquisitions were performed in the nominal steady state condition. We have an estimated torque of about 20 N.m over a period of 40 seconds with a sampling frequency of 1.5 KHz which corresponds to a frequency resolution equal to 0.025 Hz.
The various modes of operation being performed to validate the diagnostic procedure are:
9 Motor operation with healthy bearings, 9 Motor operation with faulty cage,
9 Motor operation with faulty outer race: 3mm hole diameter,
9 Motor operation with faulty outer race: 6mm hole diameter.
For a more reliable analysis and due to the randomness of the measured signals, several acquisitions were made for each operation.
B. Motor operation with healthy bearings
In these first tests, we will analyze the stator current in the case where the two bearings “the opposite side to coupling and the coupling side” are healthy bearings. This analysis will be considered as the benchmark for all future tests.
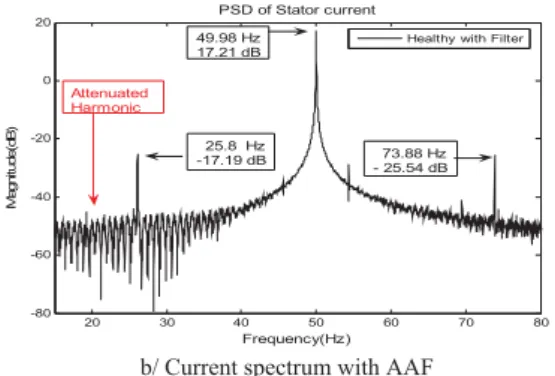
Improvement of the spectrum quality by the AAF The spectral analysis of the stator current filtered by the AAF enables us to see clearly the improvements that can be brought to the diagnosis process as seen in Fig. 7.
20 30 40 50 60 70 80
-80 -60 -40 -20 0 20
Frequency (Hz)
Magnitude(dB)
PSD of Stator current
Healthy without Filter
21.73 Hz - 39.53 dB
25.8 Hz - 17.19 dB 49.58 Hz 17.87 dB
73.33 Hz - 20.67 dB
a/ Current spectrum without AAF
20 30 40 50 60 70 80
-80 -60 -40 -20 0
20 PSD of Stator current
Frequency(Hz)
Magnitude(dB)
Healthy with Filter 49.98 Hz
17.21 dB
73.88 Hz - 25.54 dB 25.8 Hz
-17.19 dB Attenuated
Harmonic
b/ Current spectrum with AAF
Fig. 7. Random disturbances attenuation by the AAF “Healthy bearings”
In fact, it is seen in Fig. 7, that the current analysis without filtering has a harmonic at the position 21.73 Hz with amplitude of -39.53dB. While with filtering, this frequency is strongly attenuated confirming that this harmonic is an electromagnetic disturbance which occurred because of spectral aliasing. By cons, other frequencies related to the motor state “the fundamental and eccentricity harmonics” are not affected by the filtering operation.
Furthermore, the AAF also contributes in noise effect attenuation, and can therefore enhance some harmonics carrying information of the system status. It can be noted from Fig. 8, that the average noise without the AAF is -60dB, whereas it is -65dB when the filter is used. The figure illustrates clearly the spectrum readability by the appearance of a single harmonic at frequency 169.5 Hz.
166 168 170 172 174 176
-90 -80 -70 -60 -50 -40
-30 PSD of Stator current
Frequency (Hz)
Magnitude (dB)
Healthy without Filter
a/ Current Spectrum without AAF
166 168 170 172 174 176
-90 -80 -70 -60 -50 -40
-30 PSD of Stator current
Frequency(Hz)
Magnitude(dB)
Healthy with Filter 169.5 Hz
- 39.89 dB
b / Current spectrum with AAF Fig. 8. Noise reduction by the AAF “Healthy bearings”
After illustrating the positive contribution of the AAF, we
now study the bearings fault diagnosis. Theoretically, the
frequency signature of a cage fault or an outer race fault is
determined by the geometric parameters of the bearing “see
Appendix B” based on equations (1), (3) and (5). The following table shows the frequencies of the harmonics of each fault that may appear on the current spectrum.
TABLE I.THEORETICAL BEARING FAULTS CHARACTERISTIC FREQUENCIES AT RATED LOAD WITH FR=23.69HZ AND K=1
Cage fault frequency 40.50 Hz 59.4 Hz
Outer race fault frequency 34.66 Hz 134.6 Hz
Where fr is measured by the tachometer.
From Table I, one can deduce that the frequency band which provides information on the existence or not of the bearing fault “outer race or cage faults” may be limited to the range [33 Hz 43 Hz]. It is within this frequency band that the search of the fault signature in the spectrum will be performed.
The analysis of the stator current on the selected frequency band in Fig. 9 shows that there is no particular harmonic presence in the spectrum which could confirm that there is no bearing fault.
35 37 39 41 43 45
-55 -50 -45 -40 -35 -30
Frequency (Hz)
Magnitude (dB)
PSD of Stator current
With Filter
Fig. 9. Current spectrum “Healthy bearings”
C. Motor operation with bearing cage fault
It can be easily noticed in Fig. 10, that an additional harmonic appears in the stator current spectrum at frequency 39.9Hz in comparison with Fig. 9. This harmonic obtained experimentally demonstrates the existence of the bearing cage fault according to the theoretical calculations obtained in Table I. The slight difference 39.9 Hz instead of 40.5 Hz is due to the frequency resolution and the measurement error of the shaft speed frequency.
35 37 39 41 43 45
-50 -45 -40 -35 -30
Frequency (Hz)
Magnitude (dB)
PSD of Stator current
With Filter 39.9 Hz
- 30.75 dB
Fig. 10. Current spectrum “Bearing cage fault”
Improvement of the spectrum readability by the MLA Furthermore in order, to improve the readability of the spectrum, we apply the proposed algorithm MLA to display the
maximum harmonic supposed to represent the signature of the desired fault. It can be noticed from Fig. 11, that the maximum harmonic in the frequency band [33 Hz 43 Hz] occurs at the frequency 39.9 Hz for the rated load condition. This confirms the existence of the cage fault.
33 35 37 39 41 43
-52 -48 -44 -40 -36 -32 -28
Frequency (Hz)
Magnitude (dB)
PSD of Stator current
39.9 Hz - 30.75 dB
Fig. 11. Current spectrum with MLA “Bearing cage fault”
We can conclude from this result, that the use of the MLA in the spectrum analysis, not only provides better readability of the spectrum; that is the fault signature identification is easy and direct without recourse to successive zooms; but also and above all allows rapidity in decision of the bearing state.
D. Motor operation with bearing outer race fault
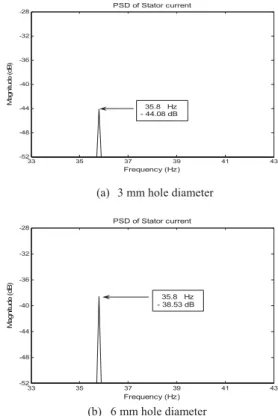
According to Fig.12, it can be noticed that the signature of the outer race fault at rated load, appears at the same frequency value 35.8 Hz, independently of the hole diameter size. This result confirms the theoretical results obtained in Table I. By cons, as far as the amplitude of the fault is concerned, the harmonic amplitude for the case of the 6mm hole diameter is larger than the 3 mm one. This fact helps us to monitor the fault severity.
33 35 37 39 41 43
-52 -48 -44 -40 -36 -32 -28
Frequency (Hz)
Magnitude (dB)
PSD of Stator current
35.8 Hz - 44.08 dB
(a) 3 mm hole diameter
33 35 37 39 41 43
-52 -48 -44 -40 -36 -32 -28
Frequency (Hz)
Magnitude (dB)
PSD of Stator current
35.8 Hz - 38.53 dB
(b) 6 mm hole diameter
Fig. 12. Current spectrum with MLA “Bearing outer race fault”
V. C
ONCLUSIONThe work in this paper deals with the induction motor diagnosis based on the stator current spectrum technique. For a better exploitation of this technique for bearing fault detection, two main improvements have been proposed. The first proposal is to design and to realize an anti-aliasing filter “AAF”
which has direct effect on the processed signal quality. Indeed, we have noted that the AAF has eliminated some electromagnetic disturbances and has minimized the measurements noise effects. Regarding the second proposal, an algorithm for the maxima localization “MLA” was developed and added to the standard PSD calculation. This algorithm has positively contributed in the readability of the stator current spectrum and significantly facilitated its analysis. Both proposals have enabled us to verify the correlation between the frequency signatures of the bearing faults obtained experimentally and those calculated theoretically.
R
EFERENCES[1] H. A. Toliyat, S. Nandi, S. Choi, H. Meshgin-Kelm, “Electric machines:
Modeling, condition monitoring and fault diagnosis,” Taylor & Francis Group Eds. New York, 2012, pp. 1-23.
[2] O. V. Thorsen and M. Dalva, “Failure identification and analysis for high voltage induction motors in the petrochemical industry,” IEEE Trans. Ind. Applicat, vol. 4, pp 810-818, July/August 1999.
[3] EPRI, “Improved motors for utility applications,” final report publication, EPRI EL-2678 Project 1763-1, 2 (1982).
[4] B. Trajin, “Détection automatique et diagnostic des defaults de roulement dans une machine asynchrone par analyse spectrale des courants statoriques,‘’ JCGE 2008, Lyon, France, 16-17 Dec 2008.
[5] A.F. Aimer, A.H. Boudinar A. Bendiabdellah, C. Mokhtar, “Effet du fenetrage sur la résolution de la DSP et son apport dans le diagnostic des défauts rotoriques du moteur asynchrone ‘’. Int. Conf. on Industrial Engineering and Manufacturing, 2010, Batna, Algeria, May 2010, pp.
9-10.
[6] Wei Zhou, “Incipient bearing fault detection for electric machines using stator current noise cancellation,” Ph.D. Dissertation, Department of Electrical and Computer Engineering, Georgia USA, Nov 2007.
[7] Jee-Hoon Jung, Jong-Jae Lee, Bong-Hwan Kwon. “Online diagnosis of induction motors Using MCSA,” IEEE Trans. Indus. Electronics, Vol 53, N° 6, pp 1842-1852, December 2006.
[8] N. Mehala, R. Dahiya, “Motor current signature analysis and its applications in induction motor fault diagnosis,” Int. J. Sys. Applicat.
Engineering and Development, Vol 2, N° 1, pp 29-35, 2007.
[9] R. Schoen, T. G. Habetler, F. Kamran, R. G. “Bartheld, Motor bearing damage detection using stator current monitoring,” IEEE Trans. Ind.
Applicat, Vol 31 N° 6, pp 1274 – 1279, Nov/Dec 1995.
[10] R. Schoen, T. Habetler, “A new method of current-based condition monitoring in induction machines operating under arbitrary load conditions,” Electric Machines and Power Systems, Vol 25 N° 2, pp 141-152, May 1997.
[11] A.H.Boudinar, A.Bendiabdellah, N.Benouzza, N.Boughanmi, “Three phase induction motor incipient rotor’s faults detection Based on Improved Root-MUSIC approach,” Int. Rev. of Electrical Engineering , Vol 2, N° 3, pp 406-413, May/June 2007.
A
PPENDIXA:
I
NDUCTION MOTOR INFORMATION Rated power 3 kWFrequency 50 Hz Rated voltage 380 V Rated current 7 A Rotor speed 1440 rev /min Number of rotor bars 28
Number of stator slots 36
Power factor cos ij 0.83
Number of poles pairs 2
A
PPENDIXB: G
EOMETRIC PARAMETERS OF THE DIAGNOSED BEARING“Reference 6205-ZZ coupling opposite side"
Outer race diameter 52 mm Inner race diameter 25 mm Cage diameter 38.5 mm Ball diameter approximate to 07.938 mm Number of balls 9 The contact angle ȕ is assumed to be zero