To cite this version : Obeid, Ziad and Poignant, Sylvain and Regnier,
Jérémi and Maussion, Pascal
Stator Current based Indicators for
Bearing Fault Detection in Synchronous Machine by Statistical
Frequency Selection
. (2011) In: IEEE IECON 2011, Industrial
Electronics CONference, 11 November 2011 (Melbourne, Australia).
To link to this article : doi:
10.1109/IECON.2011.6119621
URL :
http://dx.doi.org/10.1109/IECON.2011.6119621
O
pen
A
rchive
T
OULOUSE
A
rchive
O
uverte (
OATAO
)
OATAO is an open access repository that collects the work of Toulouse researchers and
makes it freely available over the web where possible.
This is an author-deposited version published in :
http://oatao.univ-toulouse.fr/
Eprints ID : 14325
Any correspondance concerning this service should be sent to the repository
administrator:
[email protected]
Stator Current based Indicators for
Bearing Fault Detection in Synchronous
Machine by Statistical Frequency Selection
Ziad Obeid1,2, Sylvain Poignant3, Jérémi Régnier1,2, Pascal Maussion1,2,
1
Université de Toulouse ; INPT, UPS ; LAPLACE (LAboratoire PLAsma et Conversion d’Energie) ;
ENSEEIHT,2CNRS,3SAFRAN-Technofan Toulouse
Abstract: The aim of this paper is to present some indicators developed for efficient detection of bearing defaults in high speed synchronous machines using a stator current analysis. These actuators are used in an air conditioning fan for aeronautic applications. The signatures of the bearing defects appear through an increase in amplitude of specific current harmonics multiples of the rotation frequency. From an experimental comparison between a healthy fan and another with damaged bearings, an automatic frequency selection is performed to identify the frequency ranges for which the energy is the most sensitive to the considered faults. From these frequencies, several strategies are investigated to propose a suitable indicator for the bearing fault detection. A post-processing algorithm is then developed and tested for different measurements, different types of faults and different operating points, to ensure the robustness of the proposed method.
Keywords: Diagnostic, Bearing fault detection,
Current spectrum analysis, Automatic frequency research.
I. INTRODUCTION
In recent years, monitoring has become an important industrial research area in topics related to safety and reliability. Ball bearing defects are among the elements of greatest occurrence (40% of machine failure) according to [1]. The bearing failure could lead to critical events such as abnormal temperature or vibration level, rotor locking, stator friction,… Consequently, the manufacturers show a great concern about the bearings state of health in order to guarantee the availability and the predictive maintenance of an actuator. Traditionally, bearing fault detection uses vibration analyses [2][3][4]. The characteristic frequencies of the vibration spectrum could be used to point out a bearing damage. This solution could be expensive, consequently instead of using the vibration measurements, the stator current signal has been successfully investigated [5][6].
Several techniques based on the stator current spectrum analysis have been studied over time by several authors. A list of these techniques is reviewed in [7]. These applications are mainly dedicated to the induction machines. However, a few work deals with
bearing fault detection in permanent magnet machines [8][9].
The researches presented in this paper are focused on bearing fault detection for a high speed permanent magnet machine belonging to an air conditioning fan used in aeronautic. The classical stator current signatures related to the vibration bearing frequencies are not suitable for such applications due to their low level. Nevertheless, some frequencies multiple of the rotation frequency in the stator current spectrum seem to be sensitive to the considered faults. A statistical research is then performed to automatically identify the frequencies for which these current harmonics present the most significant variations between healthy and faulty cases.
Then, some indicators are proposed to highlight the occurrence of defects in the bearing. This work is part of the French national project PREMEP [10] (PRojEt Moteur Electronique de Pilotage), labelled by the Aerospace Valley cluster and involving the LAPLACE and Airbus suppliers such as Technofan, Liebherr Aerospace, CIRTEM, DELTY and ADN.
II. SYSTEM DESCRIPTION
As previously mentioned, the studied system is an air conditioning fan based with a high-speed permanent magnet synchronous machine, showed in Fig. 1.
Fig.1. Picture of the whole fan
PMSM has sinusoidal back electromotive forces but is supplied by a PWM inverter operating sequentially to provide 120° square wave currents in the three phases of the machine, according to Fig.2.
This kind of control avoids using an accurate position sensor such as resolver. Figure 3 shows the whole system in its industrial test bench.
Fig.2. Block diagram of the system
Fig.3. Bearing fault diagnostic setup
According to the square wave form of the stator current, a theoretical study allows to identify different frequency families of the harmonic content in the stator current (see Table I).
TABLE I
HARMONIC FAMILIES OF THE PHASE CURRENTS
Harmonic type Theoretical rank
Current harmonics
6 "
k 1
!
f
s PWM harmonicsF
dec"
6 "
k
1
!
f
s!
where
f
s is the supply frequency andf
r is the rotor mechanical frequency, with fs # p.fr, wherep
is the pole pair number.These harmonic components are related to the supply conditions, whatever the bearing damage, and will be therefore excluded during the statistical research [11].
Fig.4. FFT of the stator current
As shown in Fig. 4, the stator current spectrum indicates an increase of energy for harmonics multiple of the mechanical rotation frequency in the faulty case. Thus, our approach is to scan all these frequencies and to select those who react in presence of default in different operating conditions.
III. FAULT SIGNATURE
In the field of bearing fault detection, a lot of researches investigate the vibration signals [2][4][3]. However, since the implementation of these sensors is rather difficult and could be expensive, an alternative idea is to extract the default signatures from the current signals, using only the embedded current sensors already used for control purposes.
Rolling element bearing includes four classic parts: cage, balls, inner and outer races. The signature of failure appears in the vibration signals at frequencies known as characteristic frequencies [12] of the rolling elements. These frequencies are listed below (1)-(4): $$ % & '' ( ) * # c b b r inner D D N f f 1 cos+ 2 (1) $$ % & '' ( ) , # c b b r outer D D N f f 1 cos+ 2 (2) $ $ % & ' ' ( ) -. / 0 1 2 * # 2 cos 1 2 c b b c r b D D D D f f + (3) $$ % & '' ( ) * # c b r cage D D f f 1 cos+ 2 (4) where :
3 :inner race fault frequency, 3 !" :outer race fault frequency, 3 #$% :cage fault frequency, 3 & :ball fault frequency, 3 '& :number of balls, 3 (& :ball diameter, 3 (# :ball pitch diameter, 3 : ball contact angle
The air gap eccentricity or the load torque oscillations caused by the default produces anomalies in the air gap flux density [13]. These phenomena induce additional components in the current spectrum. The multiple of the fundamental current frequency could be modulated by one of the characteristic frequency [5]. For example, Fig. 5 shows extra harmonics at 5)± #$% in the faulty case. However, the related pick amplitude is close to the noise level and using this signature for the detection is difficult. 8150 8200 8250 8300 8350 8400 8450 8500 8550 8600 0 0.5 1 1.5 2 2.5 3 3.5x 10 4 Fréq uen ces(Hz) |F F T | Couran t Sain Couran t Défaut Healthy Faulty Frequency (Hz)
Fig.5. FFT of the stator current at specific frequency
However, a more significant increase of frequency components with modulation related to the rotation frequency can be noticed (5)± for example). This can be explained by the appearance of a speed modulation caused by the misplacing of the grease in the rolling element. Moreover, this frequency can be seen as a multiple of the rotation frequency since the fundamental stator current frequency is a multiple of the rotation frequency. Consequently, the proposed approach is to find among the components at * (excluding the frequency families in table I) those that present the most sensitivity to the investigated bearing defaults.
IV. CONSTRUCTION OF THE
DEGRADATION INDICATOR
The chosen indicator must meet several criteria including :
3 Good separation between healthy and faulty machines,
3 Good separation between different types of failures, that means, the ability of the indicator to establish degrees of criticality for the considered defects,
3 Good reproducibility of detection for different recordings of the stator current,
3 Good robustness of the indicator vs the operating speed and the load level.
As previously mentioned, the first step will be to determine frequency families including all the frequencies which are the most sensitive to the studied defects. Once these families are identified, an indicator will be proposed by calculating the accumulation of energy around the frequencies included in the family. The complete construction process of the indicator is summarized in Fig. 6 where+,$-is the time span for one observation,. is the sampling frequency and /#$ is the scanning frequency. It is important to notice that this analysis is only performed in steady state (the fan speed in normal operation is generally constant).
V. STATISTICAL RESEARCH
FREQUENCY
The construction of an indicator capable of detecting the presence of failures requires a frequency selection. Among the studied frequencies, only the multiples of with higher power in faulty cases are taken into account. The method for determining the suitable frequency families is to scan the frequencies at *. (excluding the frequency families of the table I) and to select those that lead to the best separation healthy/faulty cases. The research is based on experimental data obtained from stator current measurements on healthy and faulty machines.
A difference of relative energy, expressed in (5), is calculated on multiples*of the mechanical rotor frequency . ) ( ) ( ) ( ) ( k h k f k h k r f E f E f E f E # * (5)
From this series
E
r(
f
k)
, only the multiples off
r leading to a negative relative value are stored, i.e. the frequencies leading to a higher energy in faulty machines.Fig.6. Indicator construction
2800 2850 2900 2950 3000 3050 3100 3150 3200 3250 -2000 0 2000 4000 6000 8000 Temps |F F T | Frequency (Hz) r s f f , 5 r s f f * 5 5f *s fcage 5f ,s fcage ) (t Is t final t Stator current f Normalized specter healthy machine )] ( [I t FFT s 1 f f2 f4 i f scan f 2 1 X XN max X ) (k E k 1 2 3 4 1 E 2 E 3 E 4 E
…
tot N tot N E 4 # N i k X E 1 Cumulativ sum ) (k D k 1 EE ,1 E2 3 1 ... E E , , 4 1 ... E E , , Ntot E E1, ..., Indicator value 4 # NtotEi D 1 3 f Frequency families(A or B or …) 1 2 3 4 NtotHowever, every observation is divided into several slices (5 for this example) in order to compare different observations. This approach allows taking into account the reproducibility of the frequency families extracted by this statistical approach. The robustness of the indicator algorithm subsequently proposed will strongly depend on this point. The intersection of these families gives the selected family for the global observation. Fig. 7 describes our approach.
Fig.7. Construction of frequency families
Once these families are selected, the indicator is applied to the selected family for the specified type of bearing default (Cf Figure 6 for the details about the indicator computation).
.2=3 9 17 27 35 45 53 63 71 77 81 89 95 99 107 123 125 4 (6) .6=79 27 45 63 8199 117 123 8 (7)
VI. RESULTS AND DISCUSSION
This part is organized as follows. The first part contains the experimental results from a healthy machine compared with two faulty machines with different kinds of bearing faults. The aim is to study if the selection of the frequency families is sensitive to the kind of default. In the second part, a machine has been study during a long life cycle. The objective was to identify the origin of these frequencies and select a frequency family that allows the best detection of the default.
A. Experimental results from healthy machine and faulty machines
The two faulty machines used in this part are equipped with bearings artificially degraded:
3 heated greases, 200°C / 3 hours for machine
m
1353 damaged cages in two points and over-heated greases at 185°C during 2 hours for the machine
m
116.To illustrate the effectiveness of the proposed method, several indicators are constructed according to the process described in Fig. 6, from families previously identified. The results presented include tests at different load levels (air handling charge is imposed by diaphragms of different diameters), and different operating speeds (10 000, 12 000 and 14 100 rpm). This process is repeated for each of the faulty machine92:; and922<. Thus, two frequency families .2 and .6 are sensitive to the defaults in each of the considered machine. It can be noticed that the most sensitive frequency families are not the same for different types of defaults. As mentioned before, every observation is divided into 5 slices and the indicator is applied to every slice leading to different values.
Fig.8. Power cumulating indicator - family (
F
1) for machine m116 compared to the healthy machine at 12 000 rpmFig.9. Power cumulating indicator - family (
F
2) for machine m135 compared to the healthy machine at 12 000 rpmFigure 8 and 9 present the cumulative sum extracted from the frequency families.2 and.6. Only the final value of the cumulative sum can be considered as the significant indicator value. It is important to point out that the indicators can independently produce in all cases, a very good separation between healthy and faulty machines. From these figures, we can conclude that a sampling frequency of 20 kHz is good enough to obtain good results from the indicator. The intersection of families.2 and.6 leads to a global family
F
Gsensitive to both types of studied defaults,
.==79 27 45 6381 99 1238 (8) ) ( k s f E k 1 _ s E 2 _ s E 3 _ s E 4 _ s E … ) ( k d f E k 1 _ d E 2 _ d E 3 _ d E 4 _ d E … tot N d E_ tot N s E_ ) (k r f E k … tot N tot rN E Obtained Family … r f 2fr 3fr 4fr Ntotfr fr 2fr 3fr 4fr Ntotfr r f 2fr r f 3 r f 4 r f 2fr4fr Family ) ( / )) ( ) ( (Es fk *Ed fk Es fk 1 r E 2 r E 3 r E 4 r E ) (Eri sort … 2 r E Er1Er4 First Ne Obtained Family … E F5 r f r f 2 4fr Family ) (fi sort r FE 0 0.5 1 1. 5 2 2.5 x 10⁴ 0 5 10 15 20 25 30 35 Fréquenc es (Hz ) V le u r d e l 'in d ic a te u r s aine m116 m116 m116 Health In d ic at o r Frequency (Hz) 0 0.5 1 1.5 2 2.5 x 10⁴ 0 5 10 15 20 25 Fréquences (Hz ) V le u r d e l 'i n d ic a te u r saine m135 m135 m135 Health In d ic at o r Frequency (Hz)
Fig.10. Power cumulating indicator family
F
G for machine m166 and m135 compared to the healthy machine at V=12 000 rpmFig.11. Power cumulating indicator (family.=) at V = 10 000 rpm
Applying now the one calculated from the family.= we observe in Fig. 10 and Fig.11 that whatever the type of fault, the detection of degradation of the bearings is ensured.
B. Long time experimental results from a faulty machine
This part will try to identify the origin of the characteristic frequencies and select the family that leads to an early detection. We are interested in studying the machine m116 where the default seems closer to a realistic one. A new healthy machine is studied for several days. Then the healthy bearing is replaced by a faulty one with heated grease and fractured cage in order to emulate an accelerated ageing. The current signals are sampled and studied until the complete failure of the machine few days later. The automatic research frequency is then applied to select the frequency families which are sensitive to the default. From different speed rates, the statistical analysis results underline the occurrence of a specific family defined by [2, 4, 14, 16, 20]. (only the first 20 multiples of the rotation frequency have been included). This frequency family can be generalized and re-written by taking into account the modulation of the current harmonics by the mechanical rotation frequency as shown in (9)
.> = (6* ± 1)± ! (9)
Figure 12 and Fig.13 show the values of the indicator applied for family Fc for two operating speeds of 14 100 rpm
and 12 000 rpm at a sampling frequency of 10 kHz for one
phase current. Only the last value of the cumulated indicator for each record is presented. Table II shows the mean value of the indicator in healthy, faulty and last 2 days of simulation.
Fig 12. Power cumulating indicator (family"#) at V = 14 100 rpm
Fig. 13. Power cumulating indicator (family"#) at V = 12 000 rpm Table II
MEAN VALUE OF THE INDICATOR healthy Faulty-2 daysbefore failure Last 2 days Mean
value 45 51 1757
The same type of indicator is applied on the dc inverter supply current and the results are shown in Fig. 14. Applying the statistical frequency research to this inverter current, leads to the family [1, 5, 7, 17, 19]. ! which includes different
frequencies from those of the phase currents.
Fig 14. Power cumulating indicator (family
F
I) at V = 14 100 rpm0.8 1 1.2 1.4 1.6 1.8 2 2.2 2.4 x 10⁴ 0 5 10 15 20 25
30 Indicateur Accumulateur d'énergie (v = 12000 phase 1)
Fréquences (Hz) V a le u r d e l 'in d ic a te u r saine m116 m135 0.8 1 1.2 1.4 1.6 1.8 2 2.2 2.4 x 10⁴ 0 5 10 15 20 25
30 Indicateur Accumulateur d'énergie (v = 12000 phase 1)
Fréquences (Hz) V a le u r d e l 'in d ic a te u r saine m116 m135 Health In d ic at o r Frequency (Hz) 1.2 1.4 1.6 1.8 2 2.2 2.4 x 10⁴ 0 5 10 15 20 25
Indicateur Accumulateur d'énergie (v = 12000 phase 2)
Fréquences (Hz) V a le u r d e l 'in d ic a te u r saine m116 m135 1.2 1.4 1.6 1.8 2 2.2 2.4 x 10⁴ 0 5 10 15 20 25
Indicateur Accumulateur d'énergie (v = 10000 phase 1)
Fréquences (Hz) V a le u r d e l 'in d ic a te u r saine m116 m135 1.2 1.4 1.6 1.8 2 2.2 2.4 x 10⁴ 0 5 10 15 20 25
Indicateur Accumulateur d'énergie (v = 12000 phase 2)
Fréquences (Hz) V a le u r d e l 'in d ic a te u r saine m116 m135 1.2 1.4 1.6 1.8 2 2.2 2.4 x 10⁴ 0 5 10 15 20 25
Indicateur Accumulateur d'énergie (v = 10000 phase 1)
Fréquences (Hz) V a le u r d e l 'in d ic a te u r saine m116 m135 0 50 100 150 200 250 0 1000 2000 3000 4000 5000 6000 7000 In d ic a to r V a lu e
Record Number [Time] Faulty Healthy 0 20 40 60 80 100 120 140 160 0 100 200 300 400 500
Record Number [Time]
In d ic at o r V al u e Healthy Faulty 0 50 100 150 200 250 0 1 2 3 4 5 6 7 8 9x 10 12
Record Number [Time]
In d ic a to r V al u e Healthy Faulty
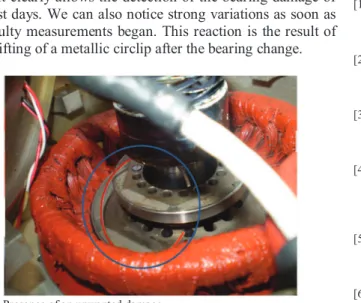
As shown in Fig. 14 the indicator applied to the inverter current clearly allows the detection of the bearing damage of the last days. We can also notice strong variations as soon as the faulty measurements began. This reaction is the result of the shifting of a metallic circlip after the bearing change.
Fig 15. Presence of an unwanted damage
This damage is an unwanted phenomenon because it is not related to the bearing. However, it is interesting to observe that the stator current based indicator has not been able to detect it. This analysis underlines the fact that it is possible to take advantages of the inverter current for the detection of mechanical failure other than bearing damages. This frequency family can be generalized and re-written by modulating family by the stator frequency as in (10).
(10)
VII. CONCLUSION
Using a statistical analysis of an experimental set of data, the proposed approach has shown that it was possible to determine the harmonics in the stator current spectrum having the higher sensitivity to a bearing damage. Based only on an a
priori knowledge of the theoretical harmonics, the indicator
would not have been enough efficient. The proposed automatic frequency selection has been proved to be relevant.
The indicator was then applied to different measurements of three stator currents and to the inverter current. The results provide good separation for all measured signals between healthy and faulty cases. Moreover, through an accelerating ageing process, the ability of the indicator to detect the fault occurrence before the bearing death has been demonstrated. In addition, other type of mechanical failure (shifting of a keeper-in metallic piece) can also be detected using the inverter current. Future work should concentrate on this point. Although the results of the algorithm show that the frequency families could be speed and default type dependant, it is possible to find suitable frequencies for detection. In future works, the frequency family research algorithm will be improved for more robustness versus the type of default and ac network variations.
VIII. REFERENCES
[1] P. Albrecht, J. Appiarius, R. McCoy, E. Owen, et D. Sharma, “Assessment of the Reliability of Motors in Utility Applications -Updated,” Energy Conversion, IEEE Transactions on, vol. EC-1, 1986, p. 39-46.
[2] Wu Zhaoxia, Li Fen, Yan Shujuan, et Wang Bin, “Motor Fault Diagnosis Based on the Vibration Signal Testing and Analysis,”
Intelligent Information Technology Application, 2009. IITA 2009. Third International Symposium on, 2009, p. 433-436.
[3] A. Sadoughi, M. Ebrahimi, et E. Razaei, “A New Approach for Induction Motor Broken Bar Diagnosis by Using Vibration Spectrum,” SICE-ICASE, 2006. International Joint Conference, 2006, p. 4715-4720.
[4] A. Sadoughi, M. Ebrahimi, M. Moalem, et S. Sadri, “Intelligent Diagnosis of Broken Bars in Induction Motors Based on New Features in Vibration Spectrum,” Diagnostics for Electric Machines,
Power Electronics and Drives, 2007. SDEMPED 2007. IEEE International Symposium on, 2007, p. 106-111.
[5] B. Trajin, J. Regnier, et J. Faucher, “Bearing fault indicator in induction machine using stator current spectral analysis,” Power
Electronics, Machines and Drives, 2008. PEMD 2008. 4th IET Conference on, 2008, p. 592-596.
[6] B. Trajin, J. Regnier, et J. Faucher, “Indicator for bearing fault detection in asynchronous motors using stator current spectral analysis,” Industrial Electronics, 2008. ISIE 2008. IEEE International Symposium on, 2008, p. 570-575.
[7] Wei Zhou, T. Habetler, et R. Harley, “Stator Current-Based Bearing Fault Detection Techniques: A General Review,” Diagnostics for
Electric Machines, Power Electronics and Drives, 2007. SDEMPED 2007. IEEE International Symposium on, 2007, p. 7-10.
[8] J. Rosero, J. Cusido, A. Garcia Espinosa, J. Ortega, et L. Romeral, “Broken Bearings Fault Detection for a Permanent Magnet Synchronous Motor under non-constant working conditions by means of a Joint Time Frequency Analysis,” Industrial Electronics, 2007.
ISIE 2007. IEEE International Symposium on, 2007, p. 3415-3419.
[9] J. Rosero, J. Romeral, J. Cusido, J. Ortega, et A. Garcia, “Fault detection of eccentricity and bearing damage in a PMSM by means of wavelet transforms decomposition of the stator current,” Applied
Power Electronics Conference and Exposition, 2008. APEC 2008. Twenty-Third Annual IEEE, 2008, p. 111-116.
[10] O. Darnis, S. Poignant, K. Benmachou, M. Couderc, Z. Obeid, D, M.Q. Nguyen, J. Régnier, D. Malec, D. Mary and P. Maussion, “PREMEP, a research project on electric motor optimization, diagnostic and power electronics for aeronautical applications,” Toulouse, France, May. 2010.
[11] Wei Zhou, T. Habetler, et R. Harley, “Stator Current-Based Bearing Fault Detection Techniques: A General Review,” Diagnostics for
Electric Machines, Power Electronics and Drives, 2007. SDEMPED 2007. IEEE International Symposium on, 2007, p. 7-10.
[12] J. Stack, T. Habetler, et R. Harley, “Fault classification and fault signature production for rolling element bearings in electric machines,” Industry Applications, IEEE Transactions on, vol. 40, 2004, p. 735-739.
[13] R. Schoen, T. Habetler, F. Kamran, et R. Bartfield, “Motor bearing damage detection using stator current monitoring,” Industry Applications, IEEE Transactions on, vol. 31, 1995, p. 1274-1279.