OATAO is an open access repository that collects the work of Toulouse
researchers and makes it freely available over the web where possible
Any correspondence concerning this service should be sent
to the repository administrator:
[email protected]
This is an author’s version published in: http://oatao.univ-toulouse.fr/21
659
To cite this version:
Trajin, Baptiste, Régnier Jérémi, Faucher Jean Comparison
Between Stator Current and Estimated Mechanical Speed for
the Detection of Bearing Wear in Asynchronous Drives.
(20
09) IEEE Transactions on Industrial Electronics, 56 (11).
4700-4709. ISSN 0278-0046
Official URL:
https://doi.org/10.1109/TIE.2009.2023630
Comparison
Between Stator Current and Estimated
Mechanical
Speed for the Detection of Bearing
Wear
in Asynchronous Drives
Baptiste
Trajin, Jeremi Regnier, Jean Faucher
Abstract—This paper deals with the detection of worn rolling
bearings in asynchronous machines using electrical measure-ments and estimated mechanical variables. These two approaches are based on the use of the available electrical quantities e.g. the machine stator currents which are often already measured for control and protection purposes. Considering that bearing faults induce load torque oscillations, a theoretical stator current model in case of load torque oscillations is recalled. Then, a theoretical estimated rotor flux and estimated speed model demonstrates the presence of harmonics related to load torque oscillations. Phase modulation components on stator current and harmonics on estimated speed can be used for detection purposes. The frequency behavior of monitored quantities with regard to the load torque oscillation frequency is particularly investigated. Fault detectors are then proposed on monitored variables. The efficiency of the indicators is studied for different operating points considering the frequency behavior of the system. Finally, the use of detectors is discussed regarding the supply frequency range usable for the detection.
Index Terms—Bearing wear, Mechanical analysis, Luenberger
speed observer, Stator current spectral analysis, Automatic energy extraction.
I. INTRODUCTION
E
LECTRICAL drives using induction motors are widely used in industrial applications because of their low cost and high robustness. However, faulty operations may be in-duced by bearing faults [1], [2]. To improve the availability and reliability of the drive, a condition monitoring may be implemented to favor the predictive maintenance. Tradition-ally, motor condition is supervised using vibration analysis, but measuring such mechanical quantities to detect bearing faults is often expensive. To overcome this problem, available electrical quantities such as stator currents may be used. A general review of monitoring and fault diagnosis schemes using stator current can be found in [3]. Concerning bearing fault detection, several studies demonstrate that specific signa-tures appear on stator current spectrum [4]–[7]. Some papers concern the definition of an automatic indicator performing anB. Trajin, J. Regnier and J. Faucher are with the Universit´e de Toulouse; INP, UPS; LAPLACE; ENSEEIHT, 2 rue Camichel, BP7122, F-31071 Toulouse Cedex 7;
CNRS; LAPLACE; F-31071 Toulouse Cedex 7.
(e-mail: {baptiste.trajin, jeremi.regner, jean.faucher}@laplace.univ-tlse.fr)
extraction of relevant information from the current spectrum [8], [9].
Moreover, speed closed-loop Luenberger observers are used in several applications for sensorless control [10]–[12]. Never-theless, few papers deal with the application of speed observer for bearing fault condition monitoring. The present paper deals with the comparison of this method with the one based on stator current monitoring. It has been demonstrated in [8], [9], [13] that bearing faults induce load torque oscillations. As a consequence, estimated mechanical speed oscillations due to load torque variations appear [14].
In this paper, the detection of bearing wear is performed by stator current and estimated mechanical rotating speed. First of all, section II recalls the effects of bearing faults on mechanical quantities such as vibrations or load torque oscil-lations, especially for the naturally worn bearing under test. It comes from the after-sales service of a motor manufacturer that declares it as worn; then, the fault type is a realistic one. Section III recalls the effects of load torque oscillations on the stator currents of the induction machine. Section IV proposes a model of estimated variables in case of load torque oscillations such as rotor flux and mechanical rotating speed. In section V, simulations of the drive including the observer are performed to establish gain diagrams of estimated speed fault harmonic and stator current sideband components amplitude regarding load torque oscillation frequency. Section VI deals with the definition of automatic indicators based on the extraction of spectral energy of stator current and estimated speed to detect faulty bearings. In section VII, the indicators are applied on stator current and estimated speed. The proposed detectors are validated using experimental measurements on the two inves-tigated variables. Short data sequences are also invesinves-tigated. The use of stator current or estimated speed is then discussed.
II. MECHANICAL EFFECTS OF BEARING DEFECTS
Three major mechanical effects of bearing faults have to be studied. On the one hand, additional vibrations appear face to faulty bearing. On the other hand, a radial eccentricity can be induced by holes on raceways [15]. Finally, load torque oscillations can be considered [13].
A. Characteristic fault frequencies
As a matter of fact, frequencies that could appear in vibration spectrum with appearance of bearing faults are theo-retically well known. Harmonics due to defects could appear
TABLE I
EXAMPLE OF FAULT HARMONICS IN VIBRATION SPECTRUM OF NATURALLY WORN BEARING FORfr= 25Hz
Harmonic frequency Harmonic amplitude variation
firf+ fr−f2c +21dB 2firf−f2c +26.5dB
2firf +31dB
3firf+ fr− fc +27dB
3firf+ fr +18.8dB
as combinations of the characteristic fault frequencies, the mechanical rotating speed [8], [9]. Characteristic frequencies
forf, firf and fc related to outer race, inner race and cage
respectively, are given in [2], [16]. Considering a one row 6208-type ball bearing (inner diameter: 40mm, outer diameter: 80mm, 9 balls) with a rotating speed of 25Hz, assuming a null contact angle in the bearing, the characteristic frequencies are the following: forf = 89.4Hz, firf = 136Hz and
fc= 9.94Hz.
B. Bearing fault type and vibration spectrum
In this paper, a 6208-type bearing coming from a motor manufacturer after-sales service is used. This bearing has been declared worn but the fault types and locations are unknown. Thus, the faulty bearing is mounted in a 5.5kW , 2 pole pair induction machine supplied by a variable frequency inverter. All signals are sampled using an acquisition board.
A piezoelectric accelerometer is placed on the housing of the faulty bearing. Vibration spectrum is computed using an average periodogram [17]. The analysis of vibration spectrum of this naturally worn bearing shows that the main defects are related to inner race fault frequency. Table I indicates the increase of specific fault harmonics in the vibration spectrum between faulty and healthy cases.
C. Eccentricity and load torque oscillations due to bearing faults
Artificial bearing faults may produce a radial displacement of balls when rolling through the hole. According to the geometrical parameters of the 6208-type bearing, it can be estimated that the radial eccentricity of the shaft is neglectful and close to the natural radial free play of the bearing. Consequently, the eccentricity is out of concern in this paper. Mechanical measurements of load torque in case of bearing defects demonstrate the appearance of load torque harmonics at combinations of characteristic fault frequencies and the rotating frequency of the machine [8], [9]. All theoretical combinations do not appear in load torque spectrum and the frequency content cannot be theoretically predicted. As a consequence, detection of bearing faults has to take into account the stochastic nature of fault harmonics.
III. INDUCTION DRIVE MODEL FOR STATOR CURRENT DEFINITION IN CASE OF BEARING FAULTS
Previous studies on mechanical failures in induction motors have shown that load torque oscillations induce phase
modula-tions (PM) on stator current [13], [18], [19]. Considering that load torque oscillations are composed of a sum of n harmonics of frequencies fn and amplitudes Γn, the load torque on the
shaft of the machine can be expressed using (1). The average load torque is equal to the average electromagnetic motor torque, that is considered as a constant Γ0.
Γload(t) = Γ0+
X
n
Γncos (2πfnt) (1)
Load torque oscillations induce mechanical speed oscilla-tions, leading to a phase modulated rotor flux. According to the electrical model of the induction machine, the stator currents are also phase modulated. In case of slight load torque oscillations, the Fourier Transform (FT) of the stator current can be approximated by (2) along the frequency ν [18]. In (2), Is is the RMS value of stator current, Ir the RMS value
of rotor current and δ is the Dirac function. Moreover, one can notice that in case of faulty bearings, the frequencies of load torque oscillations fn may equal any combination of
characteristic fault frequencies underlined by the load torque spectrum. |F T {i(t)}| = √2(Is+ Ir)δ(ν − fs) +√2Ir P nβ2nδ ³ ν − (fs± fn) ´ (2) where the phase modulation index on stator currents βn,
which depends on the load torque oscillations amplitude Γn
and frequency fn, has to be characterized.
IV. SPEED OBSERVER FOR ASYNCHRONOUS DRIVES
In order to design a speed observer for the asynchronous machine, a model of the drive has to be defined. The model depends on the allowed input measurements and the desired output variables.
A. Asynchronous drive model
The supply voltage of the machine can be measured or calculated with the knowledge of the duty-cycle applied on the inverter. Consequently, the supply voltages are defined as the input variables. Stator currents are often already measured for control purposes. The stator currents are defined as output and state variables. Finally, to get the mechanical speed, the rotor flux has to be estimated [10]. Then, the rotor flux is defined as a state variable. The Concordia transform (α,β) [20], [21] is used in the model. This transform, applied to a three-phase system that satisfies x1+ x2+ x3= 0 along time,
can be expressed via the Concordia matrix in (3), in order to obtain two oscillating components in quadrature.
µ xα xβ ¶ = Ãq 3 2 0 1 √ 2 2 √ 2 ! µ x1 x2 ¶ (3) Then, the classical first harmonic equations lead to the state model defined in (4), where B is the input matrix, C is the output matrix, A is the dynamic matrix, U is the input vector,
˙ X = a1 0 a2 a3ω 0 a1 −a3ω a2 a4 0 a5 −ω 0 a4 ω a5 | {z } A X + 1 σLs 0 0 1 σLs 0 0 0 0 | {z } B µ vSα vSβ ¶ | {z } U µ iSα iSβ ¶ | {z } Y = µ 1 0 0 0 0 1 0 0 ¶ | {z } C iSα iSβ φrα φrβ | {z } X (4) with: a1= − µ 1 σTs + 1−σ σTr ¶ , a2=σT1−σrMsr, a3= 1−σ σMsr, a4= Msr Tr , a5= − 1 Tr ω = pΩmech where:
• Lsis the stator cyclic inductance,
• Ts = RLss is the stator electrical time constant i.e. the
stator cyclic inductance divided by the stator resistance,
• Tr= Lr
Rr is the rotor electrical time constant i.e. the rotor
cyclic inductance divided by the stator resistance,
• Msr is the mutual stator-rotor inductance, • σ is the leakage coefficient,
• p is the number of pole pair of the machine, • Ωmech is the mechanical rotating speed.
B. Speed observer
The mechanical rotating speed is estimated by the difference (7) between estimated stator angular velocity ˆωs (5) and
estimated slip angular velocity ˆωr (6). The notation ˆx means
that the variable x is estimated. ˆ ωs= ˆ φrαˆ˙φrβ− ˆφrβˆ˙φrα ˆ φ2 rα+ ˆφ2rβ (5) ˆ ωr= Msr Tr ˆ φrαiSβ− ˆφrβiSα ˆ φ2 rα+ ˆφ2rβ (6) ˆ Ωmech=1 p( ˆωs− ˆωr) (7)
The closed-loop observer is designed according to the model of the asynchronous machine (4). The dynamic of the observed variables, i.e. the convergence of estimated variables to measured ones, is defined with the parameters of the gain matrix K. In order to ensure this convergence, the real and imaginary parts of the poles of the observer are decreased to accelerate and damp the response of the observed variables. Thus, the state equation of the observer is given in (8).
ˆ˙
X = (A(ˆω) − KC) ˆX + BU + KY (8)
C. Estimated speed with load torque oscillations
It has been demonstrated that load torque oscillations induce phase modulations (PM) on stator current. Then, it has to be shown that the presence of PM on the stator current induces oscillations on the estimated mechanical speed.
Considering the Luenberger Observer in open-loop condi-tions, the gain matrix K is null. According to the dynamic matrix A, the rotor flux is dependent on the electrical pulsation i.e. the mechanical rotating speed. However, the estimated rotor fluxes can be expressed only with the stator currents and the supply voltages (9).
ˆ φrα= R ÷M sr Tr + a1 a3 ¸ iSα+σL1sa3vSα ! dt − 1 a3iSα ˆ φrβ= R÷M sr Tr + a1 a3 ¸ iSβ+σL1sa3vSβ ! dt − 1 a3iSβ (9)
Considering that the inverter imposes sinusoidal supply voltages and that a load torque oscillation exists at fosc
frequency, stator currents in (10) are phase modulated at the oscillation frequency fosc. In (10), ISαβ is the RMS value
of stator currents in (α,β) coordinate system, θIs is the phase
shift between stator current and supply voltage, βIis the stator
current PM index and θosc is an arbitrary phase.
iSα=
√
2ISαβcos(2πfst + βIsin(2πfosct + θosc) + θIs)
iSβ=
√
2ISαβsin(2πfst + βIsin(2πfosct + θosc) + θIs)
(10) Using equations (9), (10), the development of phase mo-dulated sinus and cosinus in Bessel functions [22], and the assumption that the phase modulated index βI is quite small,
the rotor fluxes can be expressed. Moreover, considering the assumption that J0(x) ' 1 and J1(x) ' x2 for x ¿ 1, the
rotor fluxes can also be considered as phase modulated at the load torque oscillation frequency (11). More developments can be found in [14].
ˆ
φrα=
√
2Φrαβcos(2πfst + βφsin(2πfosct + ψosc) + ψφr)
ˆ
φrβ=
√
2Φrαβsin(2πfst + βφsin(2πfosct + ψosc) + ψφr)
(11) where:
• Φrαβis the RMS value of rotor fluxes in (α,β) coordinate
system,
• βφ is the flux PM index, • ψosc is an arbitrary phase,
• ψφr is the phase shift between rotor flux and stator
voltage.
According to (5), (6) and (11) and by neglecting square terms, the stator and slip angular velocities are equal to a constant plus oscillations at multiples of the load torque oscil-lation frequency. As a consequence, the estimated mechanical rotating speed is also a constant plus oscillations at multiples of the load torque oscillation frequency. Moreover, considering
βI and βφ as quite small, the estimated rotating speed may be
Mechanical system system Electrical φ I V Γem Γload Ω
Fig. 1. Schematic basic model of electrical machines
with an arbitrary phase ϕΩ, whose amplitude ˆΩoscdepends on
modulation indexes βI and βφ (12).
ˆ
Ωmech= ˆΩ0+ ˆΩoscsin(2πfosct + ϕΩ) (12)
Through experimental results, the ability of the Luenberger speed observer to yield the presence of physical load torque oscillations is demonstrated in [14], using a comparison bet-ween estimated speeds in healthy and load torque oscillation conditions.
V. FREQUENCY BEHAVIOR OF THE INDUCTION MACHINE IN CASE OF LOAD TORQUE OSCILLATIONS
The amplitude of the fault harmonic on estimated speed in (12) depends on βI and βφ. Thus, the knowledge of the
electromechanical frequency behavior of the whole system regarding the load torque oscillation frequency fosc and,
consequently, the knowledge of the amplitude variation law of stator current sideband components and estimated fault harmonic related to the fault frequency, is of strong interest for the detection of bearing faults. An approach of amplitude variation law of stator current components is proposed in [23]. A complete model of the induction drive based on simulations is here introduced.
A. Amplitude variation law of sideband components on stator current
Assuming a load torque oscillation of amplitude Γosc and
frequency fosc on the shaft on the machine, the stator current
sideband amplitudes at fs±foscare studied regarding the load
torque oscillation frequency. The corresponding function βI
Γosc
is then studied regarding fosc. Using the state model of the
asynchronous drive, simulations are performed to obtain the corresponding gain diagram.
1) Induction machine model: Considering the general
model of an electrical drive as depicted in Fig. 1, where V , I and Φ are stator voltage, current and rotor flux vectors. More-over, considering the load torque as an input and the stator current as an output, it can be seen, from the Fig. 1, that both the mechanical and electrical models of the asynchronous drive must be taken into account to establish the link between these two physical variables. In a general approach, mechanical and electrical transfer functions are at least of first order. Thus, even if mechanical and electrical transfer functions are non-resonant, the corresponding transfer function resulting from their association may present a resonant behavior with an order greater than or equal to 2. The existence of this resonance is related to electrical and mechanical parameters values of the models.
Fig. 2. Simulated 3D gain diagram 20 log10
h
βI(fosc,fs) Γosc
i
with a non resonant mechanical transfer function for 20Hz ≤ fs≤ 50Hz
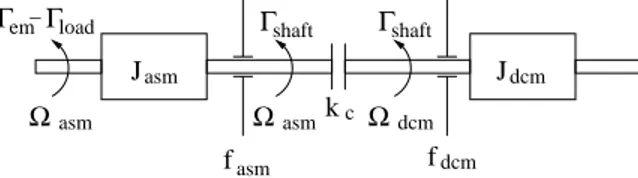
kc Jasm Jdcm fasm fdcm Ωasm Ωasm Ωdcm Γshaft Γshaft Γem−Γload
Fig. 3. Model of the mechanical drive used in the simulation process
Due to the product of currents and fluxes to obtain the electromechanical torque, a complete analytical approach can-not be performed to determine βI
Γosc and βφ
Γosc. To obtain
suitable information concerning the variation law of sideband components on the stator current with regard to the load torque oscillation frequency, a simulation approach is proposed. Firstly, a state model of the motor is associated with a first order mechanical model composed of an inertia plus a friction. An oscillating load torque of amplitude Γosc with variable
frequency foscis added to the mean load torque and amplitude
of sideband components at fs± fosc in the stator current are
extracted from its spectrum. Using electrical and mechanical parameters of the setup, the simulation demonstrates that a natural resonance exists in the drive. Moreover, the resonance characteristics, in terms of gain and frequency, also depend on the motor operating point. Fig. 2 underlines this point by depicting the gain diagram 20 log10
³
βI(fosc,fs)
Γosc
´ along the load torque oscillation frequency fosc and the supply
frequency of the induction machine fs. The level of grey
depicts the gain value. It can be maintained that the frequency behavior of βφ
Γosc is similar to the one of βI
Γosc [14]. In a second
time, a more complete mechanical model is introduced.
2) Setup analysis: The physical setup is composed of the
asynchronous motor coupled to a DC motor. Thus, the mecha-nical system depicted in Fig. 3 is composed of inertias of the motor Jasm and the load Jdcm, frictions fasm and fdcm and
a coupling stiffness kc. Equations related to the mechanical
model are given in (13). Parameters of the mechanical transfer function come from the manufacturer datasheets. Evaluating the bode diagram Ωasm
Γem−Γload, a mechanical resonance around
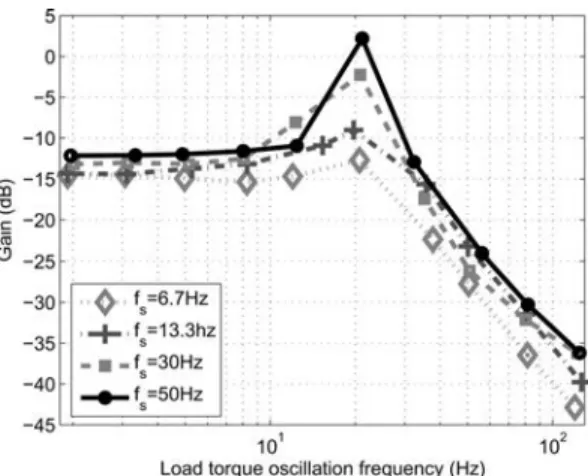
Fig. 4. Experimental gain diagrams of stator currents sideband components 20 log10 hβ I(fosc) Γosc i
for several supply frequencies
Γem− Γload= JasmdΩasm
dt + fasmΩasm+ Γshaf t
Ωasm− Ωdcm= 1 kc Γshaf t dt Γshaf t= JdcmdΩdcm dt + fdcmΩdcm (13)
3) Gain diagram of the setup: In order to get the
expe-rimental gain diagram 20 log10³βI(fosc)
Γosc
´
, the DC machine, used as a load, is connected to a resistor through a DC/DC converter which controls the DC motor armature current. The reference current of the DC/DC converter is composed of an oscillating component at variable frequency. The experimental gain diagrams are measured for several supply frequencies (fs = 50Hz, fs = 30Hz, fs = 13.3Hz and fs = 6.7Hz).
The main observation lies in the existence of an experimental resonance point around fres ' 20Hz. It is noticed on
mea-sured diagrams in Fig. 4 that even if the resonance amplitude varies, the resonance frequency is almost constant, whatever the considered supply frequency. This observation is confirmed by simulation. Comparing to the simulation results obtained with a first order mechanical model (Fig. 2), it can be said that accurately modelling the mechanical part of the drive allows to be more realistic in order to predict the whole frequency behavior of the setup.
According to this frequency response of the electromechani-cal test bench and assuming that a bearing defect creates slight load torque oscillations, the resonance point may be used as a natural amplifier to obtain amplified PM harmonics on stator current [8], [9].
B. Amplitude variation law of fault harmonic on estimated speed
The state model of the motor is associated with the me-chanical model given in (13). An oscillating torque at fosc
is added to the mean load torque in order to establish the gain diagram between simulated stator current sideband energy at fs± fosc and load torque oscillation at fosc frequency. A
similar gain diagram is established between estimated speed
Fig. 5. Gain diagrams of simulated stator current sideband components 20 log10
h βI(fosc)
Γosc
i
and estimated speed 20 log10
hˆ
Ωosc(fosc) Γosc
i
component at fosc frequency and load torque oscillation at
fosc frequency. Fig. 5 shows the corresponding gain diagrams
20 log10 ³ βI(fosc) Γosc ´ and 20 log10 ³ˆ Ωosc(fosc) Γosc ´
for the nominal supply frequency of the induction machine fs= 50Hz. On the
simulated stator current and estimated speed, a first resonance frequency appears on the gain diagrams around fres1= 20Hz,
that comes from the electromechanical frequency behavior of
βI as previously demonstrated. A second resonance frequency
appears on the estimated mechanical rotating speed around
fres2 = 160Hz. As the observer has a dynamic similar
to the induction drive but faster and more damped, it is understandable that the estimated mechanical speed has a second high frequency resonance depending on acceleration and damping parameters included in the gain matrix K of the observer. It can be pointed out that this resonance is not a physical phenomena but only a consequence of the computation of the observer. Moreover, the dynamic of the observer, i.e. the parameters of the matrix K have to be defined as a compromise between the performances of the observer in terms of convergence and the use of the resonant behavior of the estimated speed in bearing fault detection.
The electromechanical resonance around 20Hz is useful for the detection of bearing faults using stator current spectral analysis [8], [9]. Moreover, the characteristic resonance of the observer can also be used in the detection scheme to favor the detection of high frequency load torque oscillations due to bearing faults [14].
VI. DEFINITION OF DETECTORS FOR BEARING FAULTS
A. Definition of spectral indicator SI on stator current
As defined in section II-C, bearing defects induce load torque oscillations and consequently, phase modulations on stator current. However, the amplitude of these PM is quite slight and could be buried in noise. Some techniques are used to reduce the stator current Signal to Noise Ratio (SNR). The Fast Fourier Transform (FFT) of two stator currents is performed and resulting spectra from the two phases are multiplied to correlate signatures [8]. This method allows improving the efficiency of fault harmonics detection.
According to the load torque analysis and the stator current model in section III, detector SI is defined by extracting
energy on frequency ranges corresponding to the sideband components at fs± nfdef where fdef is either the inner or
the outer theoretical characteristic fault frequency. In a general frequency range [ν1; ν2], the spectral energy E of a signal in
the frequency domain X(ν) is defined as (14).
E =
Z ν2 ν1
X(ν) dν (14)
Moreover, like in the load torque analysis, the theoretical spectral content of stator currents in case of bearing faults cannot be predicted. Thus, as a contrary to other studies that generally focus on the detection of specific harmonics in stator current spectra, such as in [6], [7], the proposed indicator takes into account the probabilistic nature of stator current harmo-nics due to bearing defects underlined in section II. This allows to consider the possible appearance of numerous harmonics related to phase modulations of stator current due to bearing faults, by analyzing a global energy increase in frequency ranges. Consequently, the frequency ranges are extended to include modulations linked to the cage and mechanical rotating frequencies underlined by the vibration. Chosen frequency ranges are given in (15).
|fs± [nfdef− fc; nfdef+ fc]|
|fs± [nfdef− fr− fc; nfdef− fr+ fc]|
|fs± [nfdef+ fr− fc; nfdef+ fr+ fc]|
(15) where n ∈ [1; 5].
The spectral estimation of stator currents is done using the Fast Fourier Transform (FFT) algorithm. On stator current spectrum, rotor slot harmonics are detected at |fs± Nefr|
frequencies, where Ne is the number of rotor slot, in order
to get the average mechanical rotating speed fr [24]. The
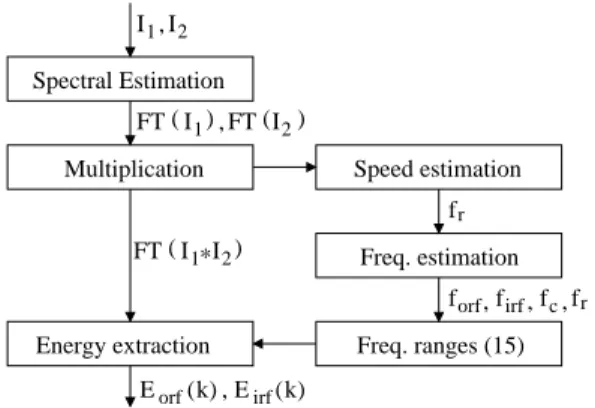
theoretical bearing frequencies are estimated using [16] and lead to the definition of frequency ranges given in (15). For each frequency range, the energy is integrated and normalized by the maximum value in the range. Fig. 6 depicts the principle of spectral energy extraction for bearing fault detection. Then, the proposed indicator SI uses the relative error of energy ∆E
between the current spectrum energy in the case under test and a healthy reference case in the specified frequency ranges. The relative errors of energy extracted from outer and inner race fault frequency ranges (∆Eorf and ∆Eirf respectively) are
added in order to get a single energy difference ∆Etot. Finally,
a cumulative sum of ∆Etot(k), where the index k refers to
frequency ranges, is used to build the indicator. Only the last value of the cumulative sum is considered as the detector value (see Fig. 7). It is understandable that the detector values have to be close to zero when a healthy case is compared to the healthy reference. In addition, the detector values have to be higher than zero when a faulty case is compared to a healthy reference.
B. Definition of spectral indicator SΩon estimated speed
The principle of the detector SΩ is the same as SI. The
speed spectral energy is extracted on frequency ranges (16)
fr forf,firf,fc,fr 2 I I1, I1 ( ) FT ,FT(I2) I1 I2 ( FT * ) (k) Eirf (k) Energy extraction Speed estimation Freq. estimation Multiplication Spectral Estimation Eorf , Freq. ranges (15)
Fig. 6. Principle of spectral stator current energy extraction for bearing faults detection (k) Eirf ∆ test−ref ref (k) Eirf Eirf(k) (k) (k) (k) (k) Reference Tested Cumsum 100 Indicator S Eorf , Eorf ∆ E ∆ tot Eorf ,
Fig. 7. Indicator computation
related to the characteristic frequency components at fdef
and the frequency ranges are extended to include possible harmonics linked to the mechanical speed and cage frequen-cies. In this case, the average rotating speed is estimated through the DC component of the estimated speed spectrum, suppressing the computing of stator current spectrum and rotor slot harmonic detection.
[nfdef− fc; nfdef+ fc]
[nfdef− fr− fc; nfdef− fr+ fc]
[nfdef+ fr− fc; nfdef+ fr+ fc]
(16) where n ∈ [1; 5].
As for SI, the proposed detector uses the relative energy
error in the specified frequency ranges between a faulty case and a healthy reference of estimated mechanical speed spectrum. A total relative error is computed and a cumulative sum is then applied. Finally, the last value of the cumulative sum is defined as the detector value SΩ.
VII. DETECTION OF NATURALLY WORN BEARING
A. Detection on stator current
The detector SI is applied in case of a naturally worn
bearing. The acquisition of the stator current is done during 80s using a 6400Hz sampling frequency. In order to use the first resonance point around 20Hz, the supply frequency has to be tuned to ensure that one of the characteristic frequencies
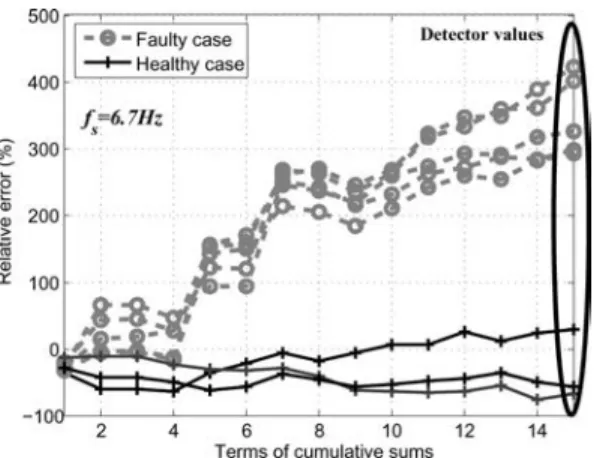
Fig. 8. firf≈ fres- Cumulative sums of relative error in % for SI
Fig. 9. fs= 50Hz - Cumulative sums of relative error in % for SΩ
of the bearing is close to the resonance frequency. In order to favor the detection of possible outer race fault (forf' fres1),
the supply frequency fsis tuned to 13.3Hz. In order to favor
the detection of possible inner race fault (firf ' fres1), the
supply frequency fs is tuned to 6.7Hz. Each case of the
de-tector computation uses a reference of energy obtained with a healthy bearing. Fig. 8 shows cumulative sums corresponding to the computation of detector SI for fs = 6.7Hz. Several
detector values are computed for the same operating point in order to ensure the reliability of the detection scheme. The faulty detectors are clearly higher than the healthy ones which are close to zero. These results could prove that an inner race fault affects the bearing. The vibration spectral analysis in section II-B confirms that an inner race fault does exist, due to the appearance of several fault harmonics related to inner race characteristic frequency. Moreover for
fs= 13.3Hz, the faulty detectors are close to zero, indicating
that no major fault affects the outer race of the bearing. Finally, the computing of SI at the nominal supply frequency
fs = 50Hz underlines that distinction between healthy and
faulty cases is not possible with this detector because the sideband components are strongly attenuated, according to the electromechanical gain diagrams depicted in Figs. 4 - 5.
B. Detection on estimated speed
To demonstrate that the detection is possible using estimated speed, the supply frequency fsis also tuned to ensure that one
TABLE II
MEAN AND STANDARD DEVIATION OF DETECTORS ON ESTIMATED SPEED
fs Healthy case detectors Faulty case detectors (Hz) (Mean; Standard deviation) (Mean; Standard deviation)
6.7 (16.8; 55.2) (1020; 116)
13.3 (4.9; 26.7) (454.7; 163.8)
25 (-28.9; 99.1) (378.3; 61.8)
50 (90; 171.7) (1464; 176.7)
TABLE III
DETECTOR ON ESTIMATED SPEED FOR ARTIFICIAL LOCALIZED FAULT
fs Outer race Inner race (Hz) localized fault localized fault
6.7 265.5 837.3
13.3 861 420.7
50 621.5 723.7
of the characteristic frequencies is close to the low frequency resonance point. The detection is ensured for fs = 6.7Hz,
as shown in table II. Consequently to the use of the low frequency resonance point existing on estimated speed and to the gain higher on estimated speed than on stator current (see Fig. 5), the results for the worn bearing given in Table II are higher than the ones in Fig. 8. It can be noticed that the bad performances of the Luenberger observer at low speed [25] do not affect the detection efficiency. More results can be found in [14].
For the nominal operating point, Fig. 9 depicts the cumu-lative sums for healthy and faulty operations for a supply frequency fs= 50Hz. Several detector values are computed
for the same operating point in order to ensure the reliability of the detection scheme. The detection of the faulty bearing on estimated speed is ensured for the nominal speed operating point (fr' 25Hz) as a contrary to stator current analysis due
to a higher gain on estimated speed than on stator current at high frequency. Table II indicates mean and standard deviation of detectors SΩfor several supply frequencies, for healthy and
faulty operations.
Moreover, to ensure that the detection using SΩ allows to
detect any fault type, artificially damaged 6208-type bearings are tested. The faults consist in a 3mm large hole in either the outer or inner raceway. Detector values are given in Table III for several supply frequencies. It can be seen than the detection of each fault location is ensured for each supply frequency due to a detector value clearly higher than 0. Moreover, the effects of the low frequency resonance at fres1 may be
noticed. Indeed, the fault whose characteristic frequency is in accordance with the resonance frequency is emphasized. For
fs = 6.7Hz (resp. fs = 13.3Hz), the detection of the inner
race (resp. outer race) localized fault is improved comparing to the detection of the outer race (resp. inner race) fault. Similar results are achieved using the stator current detector SI in [8].
TABLE IV
MEAN OF DETECTORS ON ESTIMATED SPEED FOR A NATURALLY WORN BEARING ON SHORT DATA SEQUENCES
fs= 25Hz fs= 50Hz Mean of 30 healthy case detectors 2.6 -38.6
Mean of 30 faulty case detectors 672.3 632.6
C. Study of the detectors on short data sequences
Previous detectors need signals acquired during 80s. In case of industrial systems and embedded applications, it is necessary to reduce the length of data sequences. The stator current detector is studied on short data sequences in [9]. Short data sequences induce the use of some statistical methods, that are introduced to improve the results, leading to a clear detection of bearing faults using stator current analysis.
A similar analysis is performed on the detector based on estimated speed analysis. The estimated speed is sampled at 2kHz frequency and the data sequences are limited to 8192 samples, corresponding to a signal of almost 4.1s. These characteristics are appropriated to industrial systems where the speed, especially the nominal one, may be almost constant during 4.1s. Table IV gives mean values of 30 detectors computed in healthy and faulty conditions for the nominal and half-nominal supply frequencies, fs= 50Hz and fs= 25Hz
respectively. In each case, a reference of energy is built using a healthy bearing. It can be clearly seen that the mean values of detectors are close to zero in healthy cases and that the distinction between healthy and faulty cases is ensured for these operating points.
D. Discussions on the proposed indicators
On the one hand, the proposed indicator on stator current uses the estimation of spectral energy and the differences of energy in specific frequency ranges between a reference and a measurement. The proposed indicator is principally restricted by the electromechanical behavior of the experimental setup [8], [9]. It has been shown that the specific gain diagram linking stator current sideband energy and load torque os-cillation frequency may include a resonance point even if the mechanical load is non resonant. This electromechanical resonance allows to amplify the effects of load torque oscil-lations on stator current and improve the detection efficiency. Consequently, the characteristic fault frequencies forfor firf,
depending on the rotating frequency and thus on the supply frequency of the induction machine, have to be close to the resonance frequency. This is achieved by tuning the supply frequency to ensure that one of the characteristic frequencies of the bearing equals the resonance point. Moreover, it means that the detection of bearing defects by the proposed indicator becomes underachiever for any supply frequency. Thus, the detection of bearing faults is necessarily determined by the electromechanical behavior of the system, that has to be previously estimated, and the ability in tuning the supply frequency of the induction motor, using a variable frequency inverter, to take into account the possible resonance points.
On the other hand, the efficiency of the detector on the estimated speed is better than the one on the stator current due to a detection ensured for a wider range of supply frequencies. The detector is able to detect several fault types and location. Indeed, the high frequency behavior of estimated speed regarding load torque oscillation frequency has a gain higher than stator current. Thus, bearing wear detection based on stator current analysis of the induction machine can be replaced in a favorable way on sensorless applications by the estimation of mechanical rotating speed, that only needs the knowledge of supply voltages of the induction machine as well as stator current measurements. Finally, the knowledge of the electromechanical behavior of the system is of less importance for estimated speed analysis than for stator current analysis, in general due to a higher gain and a lower high frequency filtering behavior.
VIII. CONCLUSION
In this paper, two different methods for an automatic detection of bearing faults in induction motors have been compared. The first one is based on stator current monitoring and the second one on estimated mechanical speed analysis. Some mechanical faults such as bearing defects induce load torque, mechanical speed oscillations and phase modulations on stator current. Thus, it was demonstrated that electrical and estimated mechanical variables can be used to detect faulty operating conditions. The frequency behavior regarding load torque oscillation frequency of variables used for the detection was particularly investigated on induction drives using measurements and simulations. This study emphasized the existence of resonance points on gain diagrams that can be used as amplifiers of load torque oscillations due to bearing defects on monitored variables. The knowledge of the specific resonance frequencies underlined by the gain diagrams is useful to analyze the detection scheme performances.
Consequently, detectors based on spectral energy extraction in frequency ranges that can be affected by harmonics due to bearing faults are defined on stator currents and estimated speed. This detectors take into account the stochastic ap-pearance of fault harmonics. The proposed detection schemes are used to detect a naturally worn bearing mounted in an asynchronous drive. The detection of bearing wear on stator currents is submissive to the frequency behavior of the system that has to be previously determined. In addition, to use this resonance point, the supply frequency has to be tuned to specified values using a variable frequency power supply. Finally, this detection scheme may be performed on-line but preferentially out of the industrial process. On estimated mechanical rotating speed, the detection is ensured on a wider range of supply frequencies due to the high frequency behavior of gain diagram between estimated speed and load toque oscillation harmonics. Thus, the dynamic of the observer can be used to improve the fault detection comparing to the same detector based on stator current analysis. Consequently, the detection based on estimated speed spectral energy extraction can be preferentially chosen to detect faulty operations induced by worn bearings with a restriction to sensorless applications
due to the need of the observer. It was shown that the detection is also ensured on short data sequences leading to an on-line use of the detector on estimated speed on industrial sensorless systems.
REFERENCES
[1] B. Raison, G. Rostaing, O. Butscher and C.-S. Maroni, Investigations of algorithms for bearing fault detection in induction drives, IEEE 28th Annual Conference of the Industrial Electronics Society, vol. 2, Nov. 2002, pp. 1696-1701.
[2] J. R. Stack, R. G. Harley and T. G. Habetler, An amplitude modulation detector for fault diagnosis in rolling element bearings, IEEE Transac-tions on Industrial Electronics, vol. 51, no. 5, Oct. 2004, pp. 1097-1102.
[3] S. Nandi and H. A. Toliyat, Condition monitoring and fault diagnosis of electrical machines - a review, IEEE Transactions on Energy Conversion, vol. 20, no. 4, Dec. 2005, pp. 719-729.
[4] J. R. Stack, T. G. Habetler and R. G. Harley, Fault classification and fault signature production for rolling element bearings in electric machines, IEEE Transactions on Industry Applications, vol. 40, no. 3, May-Jun. 2004, pp. 735-739.
[5] R. R. Obaid, T. G. Habetler and J. R. Stack, Stator current analysis for bearing damage detection in induction motors, International Symposium on Diagnostics for Electric Machines, Power Electronics and Drives (SDEMPED ’03), Aug. 2003, pp. 182-187.
[6] J. H. Jung, J. J. Lee and B. H. Kwon, Online Diagnosis of Induction Motors Using MCSA, IEEE Transactions on Industrial Electronics, vol. 53, no. 6, Dec. 2006, pp. 1842-1852.
[7] B. Akin, U. Orguner, H. A. Toliyat and M. Rayner, Phase-Sensitive Detection of Motor Fault Signatures in the Presence of Noise, IEEE Transactions on Industrial Electronics, vol. 55, no. 6, Jun. 2006, pp. 2539-2550.
[8] B. Trajin, J. Regnier, J. Faucher, Bearing Fault Indicator in Induction Machine Using Stator Current Spectral Analysis, Power Electronics Machine and Drives Conference (PEMD ’08), York, Apr. 2008, pp. 592-596.
[9] B. Trajin, J. Regnier, J. Faucher, Indicator for Bearing Fault Detection in Asynchronous Motors using Stator Current Spectral Analysis, IEEE In-ternational Symposium on Industrial Electronics (ISIE ’08), Cambridge, Jun-Jul. 2008, pp. 570-575.
[10] M. Cuibus, V. Bostan, S. Ambrosii, C. Ilas and R. Magureanu, Luen-berger, Kalman and Neural Network Observers for Sensorless Induction Motor Control, 3rd International Power Electronics and Motion Control Conference (IPEMC 2000), vol. 3, Aug. 2000, pp. 1256-1261.
[11] V. Bostan, M. Cuibus, C. Ilas and R. Magureanu, High Performance Sensorless Solutions for Induction Motor Control, Power Electronics Specialist Conference (PESC ’03), vol. 2, Jun. 2003, pp. 556-561.
[12] Y. Abdel-Rady Ibrahim Mohamed, Design and Implementation of a Robust Current-Control Scheme for a PMSM Vector Drive With a Simple Adaptive Disturbance Observer, IEEE Transactions on Industrial Electronics, vol. 54, no. 4, Aug. 2007, pp. 1981-1988.
[13] M. Blodt, P. Granjon, B. Raison and G. Rostaing, Models for bearing damage detection in induction motors using stator current monitoring, IEEE Transactions on Industrial Electronics, vol. 55, no. 4, Apr. 2008, pp. 1813-1822.
[14] B. Trajin, J. Regnier, J. Faucher, Detection of Bearing Faults in Asyn-chronous Motors using Luenberger Speed Observer, IEEE Industrial Electronics Society Conference (IECON ’08), Orlando (FL.), Nov. 2008, pp. 3073-3078.
[15] R. R. Schoen, T. G. Habetler, F. Kamran and R. G. Bartheld, Motor bearing damage detection using stator current monitoring, IEEE Trans-actions on Industry Applications, vol. 31, no. 6, Nov-Dec. 1995, pp. 1274-1279.
[16] T. A. Harris, Rolling bearing analysis, Wiley, New-York, 3rd ed., 1991.
[17] S. M. Kay, Modern Spectral Estimation: Theory and Application, Prentice Hall, Englewood Cliffs, New Jersey, 1988.
[18] M. Blodt, J. Faucher, B. Dagues and M. Chabert, Mechanical load fault detection in induction motors by stator current time-frequency analysis, IEEE International Conference on Electric Machines and Drives, May 2005, pp. 1881-1888.
[19] R. R. Schoen and T. G. Habetler, Effects of time-varying loads on rotor fault detection in induction machines, IEEE Transactions on Industry Applications, vol. 31, no. 4, Jul-Aug. 1995, pp. 900-906.
[20] D. C. White, H. H. Woodson, Electromechanical energy conversion, Wiley, New-York, 1959.
[21] P. Vas, Electrical Machines and Drives - A space-vector theory ap-proach, Oxford Science Publications, Oxford, 1992.
[22] M. Abramowitz, I. A. Stegun, Handbook of Mathematical functions with Formulas, Graphs and Mathematical Tables, Dover Publications, New-York, nineth ed., 1964.
[23] A. Bellini, F. Immovilli, R. Rubini and C. Tassoni, Diagnosis of Bearing Faults of Induction Machines by Vibration or Current Signals: A Critical Comparison, IEEE 2008 Industry Applications Society Annual Meeting (IAS ’08), Oct. 2008, pp. 1-8.
[24] S. Nandi, S. Ahmed and H. A. Toliyat, Detection of Rotor Slot and Other Eccentricity Related Harmonics in a Three Phase Induction Motor with Different Rotor Cages, IEEE Transactions on Energy Conversion, vol. 16, no. 3, Sep. 2001, pp. 253-260.
[25] R. Zhou and J. S. Lai, Low-Speed Performance Comparison of Induction Motor Sensorless Control Methods, 7th Workshop on Computers in Power Electronics (COMPEL 2000), Jul. 2000, pp. 247-252.
Baptiste Trajin (S’08) was born in Rouen (France) on September 4, 1982. He received the engineering degree in electrotechnology and automation from the Ecole Nationale Superieure d’Electrotechnique, d’Electronique, d’Informatique, d’Hydraulique et des Telecommunications (ENSEEIHT), Toulouse and the Master degree in electrical engineering from the Institut National Polytechnique de Toulouse, Toulouse, France, in 2006. He is now a PhD stu-dent with the LAboratoire PLAsmas et Conversion d’Energie (LAPLACE), Toulouse. Parts of his work have been published in conference proceedings such as Power Electronic Machines and Drives 2008, Industrial Symposium on Industrial Electronics 2008 or IEEE Industrial Electronics Society Conference 2008.
Jeremi Regnier (M’08) was born on April 24, 1975. He received the Ph.D. degree in electrical engineering from the Institut National Polytechnique de Toulouse (INPT), Toulouse, France, in 2003. Since 2004, he has been working as an Assistant Pro-fessor with the Electrical Engineering and Control Systems Department. He is also a researcher with the LAboratoire PLAsmas et Conversion d’Energie (LAPLACE), Toulouse. His research interests in-clude modeling and simulation of faulty electrical machines and drives as well as the development of monitoring techniques using signal processing methods.
Jean Faucher (M’08) received the diploma degree in electrical engineering from the Institut National Polytechnique (INP) de Toulouse, Toulouse, France, in 1967, and the Docteur-Ingenieur (Ph.D.) and Docteur es Sciences degrees on switched reluctance machines, in 1969 and 1981, respectively. Since 1985, he has been a Full University Professor with INP Toulouse, teaching in electrical and control engineering. He is a researcher with the LAboratoire PLAsmas et Conversion d’Energie (LAPLACE), Toulouse. His research interests include information processing and modeling of electrical machines and static converters for fault diagnosis, monitoring, and simulation. Pr. Faucher was in charge of international relationships for INP Toulouse from 2005 to 2008.