Published in : Neurology (2004), vol. 63, issue 5, pp. 853-857 DOI: 10.1212/01.WNL.0000137015.04054.2C
Status : Postprint (Author’s version)
Regional cerebral glucose metabolism in epilepsies with
continuous spikes and waves during sleep
X. De Tiègea,b,h, S. Goldmana, S. Laureysa, d, D. Verheulpenb, MD; C. Chirone, C. Wetzburgerb, P. Paquierc, D.
Chaignef, N. Poznanskib,I. Jambaquée, E. Hirschg, O. Dulace, P. Van Bogaertb
aPET/Biomedical Cyclotron Unit, Hôpital Erasme, Université Libre de Bruxelles, Brussels, Belgium bDepartment of Pediatric Neurology, Hôpital Erasme, Université Libre de Bruxelles, Brussels, Belgium cDepartment of Neuropsychology, Hôpital Erasme, Université Libre de Bruxelles, Brussels, Belgium
dCyclotron Research Centre, Department of Neurology, University of Liège, Belgium eDepartment of Pediatric Neurology, Hôpital Saint Vincent de Paul, Paris, France fDepartment of Pediatric Neurology, Clinique Sainte Odile, France
gDepartment of Neurology, CHU Strasbourg, France
hPET/Biomedical Cyclotron Unit, ULB-Hôpital Erasme, 808 route de Lennik, 1070 Brussels, Belgium
ABSTRACT
Background: Epileptic syndromes with continuous spikes and waves during sleep (CSWS) represent a wide spectrum of epileptic conditions associated with cognitive dysfunctions that have the EEG pattern of CSWS as a common feature. Reported are the results of voxel-based analyses of brain glucose metabolism performed in a group of 18 children with CSWS.
Methods: Voxel-based analyses of cerebral glucose metabolism were performed using statistical parametric mapping (SPM). First, each patient was compared with a control group and the influence of age, epileptic activity, and corticosteroid treatment on metabolic abnormalities was studied. Also, disease-related changes in the contribution of a brain area to the level of metabolic activity in another brain area were investigated using pathophysiologic interactions in groups of patients compared with the control group.
Results: Individual SPM analyses identified three metabolic patterns: association of hypermetabolic and hypometabolic areas, hypometabolic areas only, and normal pattern. Age and intensity of awake interictal spiking did not significantly differ in patients showing focal hypermetabolism compared with the other ones. Treatment with corticosteroids was associated with absence of focal hypermetabolism. In the group of patients with hypermetabolic areas, analyses of pathophysiologic interactions showed disease-related altered functional connectivity between the parietal and frontal cortices.
Conclusions: Cerebral metabolic patterns are heterogeneous among patients with CSWS. This metabolic heterogeneity could be related to the use of corticosteroid treatment before PET. The parietofrontal altered connectivity observed in patients with hypermetabolism is interpreted as a phenomenon of
remote inhibition of the frontal lobes induced by highly epileptogenic and hypermetabolic posterior cortex.
Epileptic syndromes with continuous spikes and waves during slow sleep (CSWS) represent a wide spectrum of epileptic conditions associated with various cognitive dysfunctions that have the EEG pat-tern of CSWS as a common feature.1 This EEG pattern is defined by the presence of spike and wave
discharges during at least 85% of non-REM (NREM) sleep.1-2 The cognitive deficits associated with CSWS
include auditive agnosia or Landau-Kleffner syndrome (LKS),3 dysfunctions of the frontal lobe,4-5
pseudo-bulbar palsy,6,7 global mental deterioration,8 apraxia and heminegligence,8 psychotic states,1
and visual agnosia.9
Several PET studies with [18F]fluorodeoxyglucose (FDG) have been performed in epileptic syndromes
with CSWS and have identified focal cerebral abnormalities in most patients.6-8-10-11 However, results of
these studies are heterogeneous. Indeed, some authors found a predominance of focal or multifocal
hypermetabolism,6,8 whereas others found a predominance of focal or multifocal hypometabolism.7,10
These metabolic changes predominantly involved associative cortices and were, in most cases, anatomically related with the EEG foci and with the type of neuropsychological deterioration observed.6,8,10,11
To better determine factors that might cause either hypermetabolic or hypometabolic areas to be associated with CSWS, we specifically studied the influence of age, epileptic activity when awake, and corticosteroid treatment on metabolic abnormalities found in a large population of epileptic children with the EEG pattern of CSWS. PET data were analyzed using a voxel-based method, statistical parametric mapping (SPM). This method provided a way to characterize metabolic patterns in single individuals as well as groups of patients. It also offers the opportunity to study functional connectivity between brain areas showing metabolic dysfunctions.
Methods
PATIENTS AND CONTROL SUBJECTS.
Among the population of patients studied by FDG-PET in the context of a presurgical evaluation for focal epilepsy between January 1996 and January 2003 at the PET/Biomedical Cyclotron Unit of Erasme Hospital, a group of 18 children was retrospectively selected based on the following criteria: 1) age above 5 years, 2) presence of >85% of spikes and waves during NREM sleep on an EEG recorded within 7 days before PET, 3) absence of structural lesion on cerebral MRI, 4) absence of suspected genetic or chromosomic syndrome, and 5) focal EEG abnormalities. Patients with only generalized epileptiform abnormalities were excluded because our PET methodology did not include quantification of regional cerebral glucose metabolism precluding the identification of global metabolic changes.
The patients, 13 boys and 5 girls (sex ratio: 2.6), aged 5 to 11 years, were referred from different centers in Belgium and France. All of them underwent neurologic examination, neuropsychological evaluation adapted to the patient’s age and collaboration, cerebral MRI, and awake and sleep scalp EEG using 21 electrodes placed according to the 10-20 International System. Ictal events were recorded in only a few patients because most patients had rare seizures or no clinical seizures at all. According to the neurologic and neuropsychological abnormalities, five syndromes classified the patients: 1) frontal syndrome,4,5 six patients; 2) LKS,3 five patients; 3) global mental deterioration,8 four patients; 4) left
apraxia and heminegligence syndrome,8 two patients; and 5) opercular syndrome,7 one patient. The
clinical data of each patient are summarized in table E-1 in the supplementary material on the Neurology Web site (go to www.neurology.org).
A group of 26 healthy volunteers, 10 men and 16 women, aged 18 to 42 years (mean age 28 years), was used as control population. The Ethics Committee of ULB-Erasme Hospital gave approval for this group examination. Written informed consent was obtained from all control subjects.
PET IMAGING.
PET scans were obtained using a CTI-Siemens ECAT 962 (HR+) tomograph (Erlangen, Germany), the characteristics of which have been previously described.12 All patients were awake at the time of FDG
injection, fasted for at least 4 hours, and received an IV bolus injection of 2 to 3 mCi (74 to 111 MBq) of FDG before PET acquisition in three-dimensional mode. Patients were not sedated for PET data acquisition. The current antiepileptic treatment was unchanged. EEG was monitored during each PET procedure. All patients were seizure-free for at least 72 hours.
PET DATA ANALYSES.
SPM analyses were performed on a SPARC workstation (Sun Microsystems, Surrey, UK) using SPM99 software (Wellcome Department of Cognitive Neurology, London, UK) implemented in MATLAB (Mathworks, Sherborn, MA). The PET images were spatially normalized into the standard Talairach space using a template provided by the Montreal Neurologic Institute (Quebec, Canada). The scans were then smoothed using a 16-mm full width at half-maximum isotropic kernel. Global activity normalization was performed by proportional scaling.
Individual analyses compared each individual patient with the control group.13-15 The design matrix
included the patient’s scan and the scans of the 26 control subjects. For each patient, separate analysis identified brain regions where glucose metabolism was significantly lower or higher than in the control population. The resulting set of voxel values for each contrast constituting a map of t statistics, SPM(T), was transformed in a normal distribution, SPM(Z), and thresholded at p < 0.001 (Z = 3.09).
Patients were classified into two groups based on the presence (Group 1) or the absence (Group 2) of at least one significant hypermetabolic brain area in individual SPM analyses. Differences in metabolic abnormalities between these two groups were assessed by exclusive masking analysis of comparisons with the control group.
We also searched for factors that could influence the metabolic pattern. Unpaired t-test was used to search for differences in age between the two groups of patients. The influence of epileptic activity on cerebral glucose metabolism was assessed by counting the number of spikes occurring in each epileptic focus within the 15-minute period after FDG injection, the patient being awake. This allowed determining a spike index (number of spikes per minute) for each epileptic focus. Unpaired t-test was used to search for differences between the spike index of epileptic foci anatomically related to hypermetabolic areas and those related to normometabolic or hypometabolic areas.
We also searched for an association between hypermetabolism in individual metabolic patterns and use of corticosteroid treatment before PET using the Fisher exact test.
Finally, based on the results of group analyses, we elaborated an a priori hypothesis of altered functional connectivity between hyper- and hypometabolic brain areas. To test this hypothesis, we
searched for “pathophysiologic interactions” between these brain areas in groups of patients compared with the control group. Pathophysiologic interactions are here defined as disease-related changes in the contribution of a brain area to the level of metabolic activity in another brain area. As such, this analysis is an application to pathologic conditions of the psychophysiologic interaction analysis developed previously.16 More specifically, the pathophysiologic interaction analyses here conducted
searched for disease-related differences in modulation between a hypermetabolic brain area and the rest of the brain in groups of patients compared with the control group. For pathophysiologic interaction analyses, we selected the peak voxel value in the considered hypermetabolic area, which was used as a covariate centered around condition means and interacting with each condition.
All results of subtractive SPM analyses were considered significant at p < 0.05 corrected for multiple comparisons over the entire brain volume for the voxel level and the cluster level. Exclusive masking analyses were performed using an uncorrected mask p value and a height threshold at 0.001. For connectivity studies, as we had an a priori hypothesis concerning the brain areas presenting altered functional connectivity with the considered hyper- metabolic area, results were considered significant at small volume-corrected p < 0.05 using a 20-mm radius spherical volume of interest on our predetermined regions. For unpaired t-test and Fisher exact tests, the significance level was set at p < 0.05.
As brain metabolism of children aged 5 to 11 years was compared with that of a population of young adults, regional cerebral metabolic changes that could be attributed to physiologic age- related changes (i.e., thalami and anterior cingulate cortices) were not considered in Results.17
Results.
INDIVIDUAL PATTERNS OF CEREBRAL METABOLISM.
The individual patterns of region cerebral glucose metabolism are summarized in table E-1 on the Neurology Web site. Three metabolic patterns were found: hypermetabolic areas associated with distinct hypometabolic areas (10 patients), hypo- metabolic areas only (5 patients), and absence of any significant metabolic abnormality (3 patients). Metabolic patterns among patients exhibiting the same neuropsychological profile were heterogeneous (see table E-1 on the Neurology Web site).
Hypermetabolic cerebral regions were associated with an EEG focus in all patients. By contrast, there was no strong anatomic association between hypometabolic areas and EEG foci in most of the 15 patients presenting at least one hypometabolic area. We did not find significant differences in spike index between epileptic foci anatomically related with hypermetabolic areas and those related to normometabolic or hypometabolic areas (p = 0.6). The number of spikes per minute for each epileptic focus is shown in table E-1 on the Neurology Web site.
Based on individual metabolic patterns, patients were divided into two groups according to the presence (Group 1, 10 patients) or the absence (Group 2, 8 patients) of at least one significant hypermetabolic area. These groups did not differ for age (p = 0.19).
Six of the 18 patients had received steroids before PET. Patient 10 had received a 5-month hydrocortisone course, which was stopped 3 months before PET. At the time of PET, Patient 4 had been treated by hydrocortisone for 6 years, Patient 6 for 2 years, and Patient 15 for 11 months and Patient 5 by prednisone for 2 months. Patient 14 had received prednisolone for 3 months; this treatment was
interrupted 15 days before PET. Overall, among the 10 patients included in Group 1, only 1 had received corticosteroids before PET vs 5 of the 8 patients included in Group 2. The association between the absence of hyper- metabolic abnormalities and the use of steroids before PET evaluation was significant (p < 0.05).
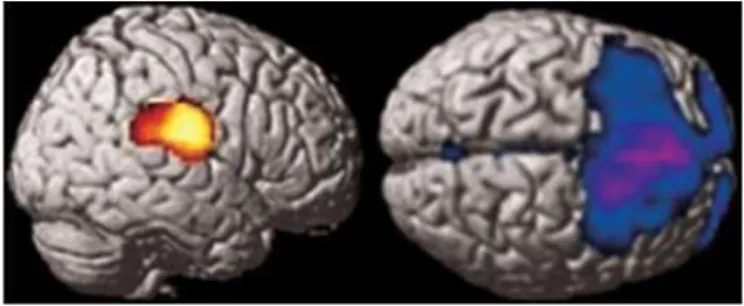
Figure 1. The comparison of Group 1 with the control group using exclusive masking by Group 2 statistical parametric mapping analyses shows a hypermetabolic area involving the right postcentral gyrus and the right parietotemporal junction (left) and hypometabolism in the frontal lobes (right). This figure illustrates the metabolic abnormalities found in Group 1 and not in Group 2.
GROUP ANALYSES.
Differences between metabolic abnormalities found in Group 1 and Group 2 were assessed by exclusive masking analyses of comparisons with the control group. In Group 1, these analyses localized a common hypermetabolic area involving the right postcentral gyrus and the right parietotemporal junction (cluster-level pcorrected = 0.001, cluster size: 2,301, voxel-level pcorrected = 0.034, Zscore = 4.3,
coordinates: [64, —16, 18]), which was not present in Group 2 (figure 1). These analyses also showed the presence of a large hypometabolic area including the superior and medial frontal gyri and the right inferior frontal gyrus in Group 1 but not in Group 2 (see figure 1). In Group 2, exclusive masking using Group 1 SPM analyses did not reveal any significant differences.
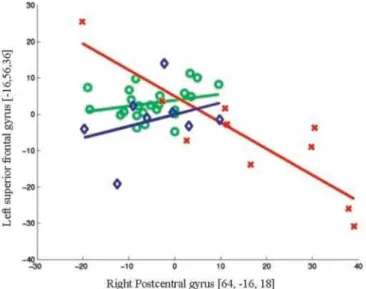
Pathophysiologic interaction studies were conducted on the basis of these group analyses to better understand the relationships between brain areas that exhibited metabolic abnormalities. Right parietal hypermetabolism and bilateral frontal hypometabolism were found to be specific to Group 1. Altered modulation between these regions was therefore hypothesized in this group, and pathophysiologic interaction studies were performed to test this a priori hypothesis. When considering the peak voxel value in the right postcentral gyrus (64, —16, 18), significant modifications in interactions with the cerebral glucose metabolism in the left superior frontal gyrus (—16, 56, 36; —16, 58, 32) were found in Group 1 compared with the control group (figure 2; see also table E-2 on the Neurology Web site). These frontal voxels were included in the large hypometabolic area involving the lateral frontal cortex in patients of Group 1. No significant change in interaction between the above considered brain areas was found in Group 2 compared with the control group.
Discussion
Voxel-based analyses of cerebral glucose metabolism in a population of 18 patients presenting the EEG pattern of CSWS led to the following original findings: 1) A group of patients presents hypermetabolic cerebral areas that are related to epileptic foci and are associated with distinct hypometabolic areas; 2) hypometabolism can be related to altered functional connectivity with these hypermetabolic areas.
Figure 2. Regression plot of metabolic activity in the right postcentral gyrus and the left superior frontal gyrus in Group 1 (red crosses), Group 2 (blue diamonds), and control subjects (green circles). This plot illustrates the disease-related changes in the contribution of the right parietal lobe to the level of metabolic activity in the left frontal lobe observed in the group of patient with hypermetabolic areas (Group 1) compared with the control group. The group of patients without hypermetabolic area (Group 2) does not differ from control subjects.
Spatial normalization may fail for brains of small size when using an adult template.18 However, this risk
is negligible for the population studied here. Indeed, the brain volume does not change substantially
from age 5 to adulthood.18 This assumption has been confirmed by a study that specifically addressed
this question in children above age 6.19
Individual analyses identified three types of metabolic patterns: the association of hypermetabolic and hypometabolic areas (10 patients), the presence of one or multiple areas of hypometabolism (5 pa-tients), and the absence of significant abnormality (3 patients). We did not find any specific metabolic pattern characterizing the different types of epileptic syndromes considered in this study. Indeed, the maps of cortical metabolic changes were heterogeneous among patients exhibiting the same type of neuropsychological profile. It was previously suggested that temporal lobe dysfunctions were important in the pathophysiology of LKS.10 We found that temporal lobe dysfunction was not specific to
this syndrome. The results obtained in this study suggest that altered glucose metabolism of specific cerebral areas is not the key to the neuropsychological differentiation among different epileptic syndromes with CSWS. Dissociation between cognitive deficit and dysfunction in related neuronal networks has been repeatedly observed in functional neuroimaging studies. This phenomenon raises the question of which brain area is necessarily required to support a specific function.20 Cerebral
activation studies using specific paradigms could explore these aspects.20
Focal hypermetabolism was found in 10 patients. This type of metabolic abnormality has already been reported in other cases of epilepsy with CSWS and is likely to reflect intense epileptic activity.6,8,11 This is
supported by the fact that, in the current study, areas of hypermetabolism were anatomically related to the epileptic foci in all patients. Local rise in glucose consumption as a sign of high neuronal activity
induced by interictal spiking has been shown in animal models of epilepsy,21 but enhanced inhibition
could also contribute to the increased glucose metabolism in this situation.22 In eight patients, we did
not find any significant hypermetabolic area. In these patients, the neuronal activity associated with interictal spiking was probably not intense enough to be associated with substantial rise in glucose consumption. As PET studies were performed during wakefulness, the hypothesis can be raised of a relationship between focal interictal spiking activity and glucose metabolism in anatomically related brain areas. Yet, spike indexes were not statistically different in epileptic foci associated or not with hypermetabolic areas. Still, the simple count of spikes recorded on scalp EEG may not be a good marker of the synaptic activity associated with an epileptic focus. Other parameters like the power of the electrical dipole or the importance of the GABAergic inhibition need to be considered in further studies. Presence or absence of focal hypermetabolism may also reflect different stages of the disease. This hypothesis is supported by a previous study that showed that hypermetabolism during the acute phase of the epileptic disease may evolve to hypometabolism or normal metabolic pattern during the recovery
phase.8 Preliminary data on the follow-up of some patients studied in the current work confirm these
findings.23 We did not find any age difference between patients with and without hypermetabolism. We
found, however, a significant association between the absence of hypermetabolic cerebral area and corticosteroid treatment before PET. The metabolic heterogeneity found in this population could therefore be related, in part, to this treatment. A direct effect of steroids on cerebral glucose metabolism needs to be considered. Indeed, several studies have shown that steroids reduce global cerebral glucose metabolism and cerebral blood flow and to a greater extent hippocampal metabolism.24-26 The existence
of a steroid-induced reduction of cerebral glucose metabolism is further supported by the increased glucose utilization throughout the brain observed in adrenalectomized rats.27 However, our SPM
method included normalization for the global cerebral activity, which allowed detection of focal metabolic changes only. Moreover, focal mesiotemporal metabolic abnormalities were not observed in any of our patients. Therefore, other mechanisms than a direct action of corticosteroids on cerebral glucose metabolism should be considered to explain our results.
These mechanisms could be an acceleration of brain maturation or a modulation of various neurotransmitter systems involved in epilepsy.28 Corticosteroids are the treatment of choice of epileptic
syndromes with CSWS, having favorable and long-lasting effects on CSWS and neuropsychological deficits in most cases.29,30 Therefore, it could be hypothesized that the absence of hypermetabolism in
some patients previously treated by corticosteroids might reflect an evolution toward the recovery phase of the disease.
Hypometabolic areas were found in 15 of 18 patients. Several hypotheses may be raised to explain this regional hypometabolism. It could relate to cerebral lesions not visible on MRI. This hypothesis is unlikely as results of longitudinal studies have shown a trend to normalization of the hyper- and hypometabolic abnormalities with the resolution of the epileptic disorder.8,23 Another hypothesis to
consider is a phenomenon of “postictal depression” induced by electrical status epilepticus occurring during slow-wave sleep. This mechanism could explain why other authors found metabolic differences
between scans performed during wakefulness and sleep in the same patient.8,11 Such a mechanism
can-not be excluded in our population as patients were studied only during wakefulness. A third hypothesis is that hypometabolic areas could be induced by surrounding inhibition. Surrounding inhibition is defined as a strong inhibition of neurons surrounding a group of neurons that display epileptiform dis-charges and is viewed as a mechanism of protection from seizure propagation.31 This hypothesis is
supported by PET studies performed in children with refractory epilepsy showing reduction of glucose metabolism measured in the interictal state in the cortex surrounding an isometabolic epileptogenic area.32
To better understand the relationship between brain areas that exhibit metabolic abnormalities, we searched for disease-related changes in the functional connectivity between these brain areas. Group analyses showed that the metabolic pattern that actually characterized patients with hypermetabolic areas (Group 1) was an association of right parietal hypermetabolism and bilateral frontal hypometabolism. Pathophysiologic interactions were then used to search for disease-related changes in the contribution of the right parietal lobe to the level of metabolic activity in the frontal lobes.16 When
searching for significant differences in modulation between the peak voxel value of the right parietal hypermetabolic area and the rest of the brain, altered interactions between this brain area and the left frontal lobe were found in patients with hypermetabolic areas (Group 1). We did not find altered modulation between the right parietal lobe and the ipsilateral frontal lobe. This is somewhat surprising as one would expect that ipsilateral frontoparietal connectivity is stronger than those between contralateral areas. This discrepancy is probably due to metabolic heterogeneity in terms of lateralization of hypermetabolic areas. In particular, individual analyses revealed hypermetabolic areas, which were bilateral in six patients, left-sided in one, and right-sided in three. In our opinion, a mechanism of “remote inhibition” would best explain our findings. We here define “remote inhibition” as a strong inhibition of distant brain areas induced by the epileptic focus. This phenomenon has been well documented in animal models of epilepsy.31 In particular, parietal hypermetabolism associated
with frontal hypometabolism has been observed in rats after injection of penicillin in the primary somatosensory cortex, which induced acute epileptic activity at the site of injection.33 The occurrence
of such a mechanism in human epilepsies has been previously suspected in patients with hippocampal sclerosis. In an ictal SPECT study performed in patients with mesiotemporal lobe epilepsy, unilateral hippocampal hyperperfusion was associated with transient hypoperfusion in both frontal lobes.34
Remote inhibition could also explain the presence of extratemporal (frontal or thalamic) interictal dysfunction in patients with temporal lobe epilepsy.14-35-36 Indeed, distant regional hypometabolism
may be reversible after the surgical cure of epilepsy.37 Remote functional inhibition may be related to
either direct intracortical connections from the epileptic focus to the hypometabolic area or polysynaptic pathways involving subcortical structures.33-38 In our population, both types of connection
between the parietal and frontal lobes may be considered in view of the existence of numerous projections from the parietal lobes to the ipsilateral and contralateral frontal lobes. These anatomic links are corticocortical or polysynaptic via subcortical structures.39 Taken together, these data support
the possible existence of frontal lobe inhibition induced by more posterior epileptic brain regions. From a clinical point of view, decreased metabolic activity in the frontal lobes could explain some characteristic neuropsychological features observed in children with the EEG pattern of CSWS, such as attention deficit disorder or executive dysfunctions.
References
1. Tassinari CA, Rubboli G, Volpi L, et al. Encephalopathy with electrical status epilepticus during slow sleep or
ESES syndrome including the acquired aphasia. Clin Neurophysiol 2000;111(suppl 2):94-102.
slow-wave sleep: syndrome or EEG pattern? Epilepsia 1999;40:1593-1601.
3. Commission on Classification and Terminology of the International League Against Epilepsy. Proposal for
revised classification of epilepsies and epileptic syndromes. Epilepsia 1989;30:389 -399.
4. Roulet Perez E, Davidoff V, Despland PA, Deonna T. Mental and behavioural deterioration of children with
epilepsy and CSWS: acquired epileptic frontal syndrome. Dev Med Child Neurol 1993;35:661- 674.
5. Veggiotti P, Bova S, Granocchio E, Papalia G, Termine C, Lanzi G. Acquired epileptic frontal syndrome as
long-term outcome in two children with CSWS. Neurophysiol Clin 2001;31:387-397.
6. de Saint-Martin A, Petiau C, Massa R, et al. Idiopathic rolandic epilepsy with interictal facial myoclonia and
oromotor deficit: a longitudinal EEG and PET study. Epilepsia 1999;40:614-620.
7. Shafrir Y, Prensky AL. Acquired epileptiform opercular syndrome: a second case report, review of the
literature, and comparison to the Landau-Kleffner syndrome. Epilepsia 1995;36:1050-1057.
8. Maquet P, Hirsch E, Metz-Lutz MN, et al. Regional cerebral glucose metabolism in children with deterioration
of one or more cognitive functions and continuous spike-and-wave discharges during sleep. Brain 1995;118:1497-1520.
9. Eriksson K, Kylliainen A, Hirvonen K, Nieminen P, Koivikko M. Visual agnosia in a child with non-lesional
occipito-temporal CSWS. Brain Dev 2003;25:262-267.
10. da Silva EA, Chugani DC, Muzik O, Chugani HT. Landau-Kleffner syndrome: metabolic abnormalities in
temporal lobe are a common feature. J Child Neurol 1997;12:489-495.
11. Rintahaka PJ, Chugani HT, Sankar R. Landau-Kleffner syndrome with continuous spikes and waves during
slow-wave sleep. J Child Neurol 1995;10:127-133.
12. Brix G, Zaers J, Adam LE, et al. Performance evaluation of a wholebody PET scanner using the NEMA protocol.
National Electrical Manufacturers Association. J Nucl Med 1997;38:1614 -1623.
13. Van Bogaert P, David P, Gillain CA, et al. Perisylvian dysgenesis. Clinical, EEG, MRI and glucose metabolism
features in 10 patients. Brain 1998;121:2229 -2238.
14. Van Bogaert P, Massager N, Tugendhaft P, et al. Statistical parametric mapping of regional glucose
metabolism in mesial temporal lobe epilepsy. Neuroimage 2000;12:129 -138.
15. Signorini M, Paulesu E, Friston K, et al. Rapid assessment of regional cerebral metabolic abnormalities in
single subjects with quantitative and nonquantitative [18F]FDG PET: a clinical validation of statistical parametric mapping. Neuroimage 1999;9:63- 80.
16. Friston KJ, Buechel C, Fink GR, Morris J, Rolls E, Dolan RJ. Psychophysiological and modulatory interactions
in neuroimaging. Neuroimage 1997;6:218-229.
17. Van Bogaert P, Wikler D, Damhaut P, Szliwowski HB, Goldman S. Regional changes in glucose metabolism
during brain development from the age of 6 years. Neuroimage 1998;8:62- 68.
18. Reiss AL, Abrams MT, Singer HS, Ross JL, Denckla MB. Brain development, gender and IQ in children. A
volumetric imaging study. Brain 1996;119:1763-1774.
19. Muzik O, Chugani DC, Juhasz C, Shen C, Chugani HT. Statistical parametric mapping: assessment of
application in children. Neuroimage 2000;12:538 -549.
20. Price CJ, Friston KJ. Functional imaging studies of neuropsychological patients: applications and limitations.
Neurocase 2002;8:345-354.
uptake and c-fos-like reactivity. Ann Neurol 1994;35:724-731.
22. Bruehl C, Witte OW. Cellular activity underlying altered brain metabolism during focal epileptic activity. Ann
Neurol 1995;38:414 - 420.
23. De Tiège X, Goldman S, Chaigne D, de Saint Martin A, Van Bogaert P. Longitudinal study of regional changes
in cerebral glucose metabolism in epileptic syndromes with continuous spikes and waves during slow sleep. Epilepsia 2002;43(suppl 8):161.
24. Brunetti A, Fulham MJ, Aloj L, et al. Decreased brain glucose utilization in patients with Cushing’s disease. J
Nucl Med 1998;39:786-790.
25. Chiron C, Dulac O, Bulteau C, et al. Study of regional cerebral blood flow in West syndrome. Epilepsia
1993;34:707-715.
26. de Leon MJ, McRae T, Rusinek H, et al. Cortisol reduces hippocampal glucose metabolism in normal elderly,
but not in Alzheimer’s disease. J Clin Endocrinol Metab 1997;82:3251-3259.
27. Freo U, Holloway HW, Kalogeras K, Rapoport SI, Soncrant TT. Adrenalectomy or metyrapone-pretreatment
abolishes cerebral metabolic responses to the serotonin agonist 1-(2,5-dimethoxy-4-iodophenyl)-2- aminopropane (DOI) in the hippocampus. Brain Res 1992;586:256 -264.
28. Hrachovy R. ACTH and steroids. In: Engel JJ, Pedley T, eds. Epilepsy, a comprehensive textbook. Philadelphia:
Lippincott-Raven, 1997:1463-1473.
29. Marescaux C, Hirsch E, Finck S, et al. Landau-Kleffner syndrome: a pharmacologic study of five cases.
Epilepsia 1990;31:768 -777.
30. Van Lierde A. Therapeutic data. In: Beaumanoir ABM, Deonna T, Mira L, Tassinari C, eds. Continuous spikes
and waves during slow sleep. London: Libbey, 1995:225-227.
31. Witte OW, Bruehl C. Distant functional and metabolic disturbances in focal epilepsy. Adv Neurol
1999;81:383-388.
32. Juhasz C, Chugani DC, Muzik O, et al. Is epileptogenic cortex truly hypometabolic on interictal positron
emission tomography? Ann Neurol 2000;48:88-96.
33. Redecker C, Bruehl C, Hagemann G, Binus O, Witte OW. Coupling of cortical and thalamic metabolism in
experimentally induced visual and somatosensory focal epilepsy. Epilepsy Res 1997;27:127-137.
34. Van Paesschen W, Dupont P, Van Driel G, Van Billoen H, Maes A. SPECT perfusion changes during complex
partial seizures in patients with hippocampal sclerosis. Brain 2003;123:1103-1111.
35. Henry TR, Babb TL, Engel J Jr, Mazziotta JC, Phelps ME, Crandall PH. Hippocampal neuronal loss and
regional hypometabolism in temporal lobe epilepsy. Ann Neurol 1994;36:925-927.
36. Jokeit H, Seitz RJ, Markowitsch HJ, Neumann N, Witte OW, Ebner A. Prefrontal asymmetric interictal glucose
hypometabolism and cognitive impairment in patients with temporal lobe epilepsy. Brain 1997;120: 2283-2294.
37. Hajek M, Wieser HG, Khan N, et al. Preoperative and postoperative glucose consumption in mesiobasal and
lateral temporal lobe epilepsy. Neurology 1994;44:2125-2132.
38. Bruehl C, Wagner U, Huston JP, Witte OW. Thalamocortical circuits causing remote hypometabolism during
focal interictal epilepsy. Epilepsy Res 1998;32:379 -387.