HAL Id: hal-02168943
https://hal.sorbonne-universite.fr/hal-02168943
Submitted on 23 Jul 2019
HAL is a multi-disciplinary open access
archive for the deposit and dissemination of
sci-entific research documents, whether they are
pub-lished or not. The documents may come from
teaching and research institutions in France or
abroad, or from public or private research centers.
L’archive ouverte pluridisciplinaire HAL, est
destinée au dépôt et à la diffusion de documents
scientifiques de niveau recherche, publiés ou non,
émanant des établissements d’enseignement et de
recherche français ou étrangers, des laboratoires
publics ou privés.
Oxide Nanocrystals and Their Magnetic Properties
Francisco Gonell, Naoual Alem, Peter Dunne, Guillaume Crochet , Patricia
Beaunier, Christophe Méthivier, David Montero , Christel Laberty, Bernard
Doudin, David Portehault
To cite this version:
Francisco Gonell, Naoual Alem, Peter Dunne, Guillaume Crochet , Patricia Beaunier, et al.. Versatile
Molten Salt Synthesis of Manganite Perovskite Oxide Nanocrystals and Their Magnetic Properties.
ChemNanoMat, Wiley, 2019, 5 (3), pp.358-363. �10.1002/cnma.201800632�. �hal-02168943�
Versatile molten salt synthesis of manganite perovskite oxide
nanocrystals and their magnetic properties
Francisco Gonell,
[a]Naoual Alem,
[a]Peter Dunne,
[b]Guillaume Crochet,
[a]Patricia Beaunier,
[c]Christophe Méthivier,
[c]David Montero,
[d]Christel Laberty-Robert,
[a]Bernard Doudin,
[b]and David
Portehault
[a]*
Abstract: Manganite perovskite oxides exhibit a wide range of
properties relevant for catalysis, energy conversion and spintronics. Such behaviors can be deeply modified at the nanoscale where confinement and surface effects may prevail. Interesting properties could then emerge from manganite perovskite nanocrystals, although their synthesis remains a challenge. The present study reports a versatile synthesis of manganite perovskite nanocrystals by using molten salts as high temperature liquids in the 600-750 °C range. Through X-ray diffraction, X-ray photoelectron spectroscopy, scanning and transmission electron microscopies, we show that many substitutions on the A perovskite site are within reach by applying the approach to La2/3Sr1/3MnO3, La2/3Ca1/3MnO3 and La1/3Pr1/3Ca1/3MnO3 cubic-shape nanocrystals with diameter of 20, 22 and 38 nm, respectively. The magnetic properties of these nanocrystals are then investigated at 5 K, highlighting the coexistence of a ferromagnetic phase typical of the bulk, with disordered and non-magnetic domains, which presumably arise from the nanoscale and surface effects.
Introduction
If halide perovskites experienced a burst of interest in the last years,[1–3] long-known perovskite oxides are highly regarded materials as they provide a versatile platform to design iono-covalent materials for various properties and applications, from piezoelectricity to catalysis.[4–6] Especially, manganite perovskites AMnO3 (A = alkaline earth metals, rare earth metals) are relevant
catalysts for the conversion of NOx gases[7] and the oxidation of
volatile organic compounds.[8] They are also active
electrocatalysts for the reduction of dioxygen at the cathode of fuel cells.[9–11] Manganites further exhibit a complex magnetic and
magnetotransport behavior that can be tuned by appropriate substitution on the A site of the perovskite or by adjusting the size of the particles. This has translated into diverse studies in magnetism and magnetotransport in general.[12–16]
In order both to understand the impact of downscaling on the magnetotransport properties and the catalytic performances of manganite perovskites, surface effects must be exacerbated. Nanoparticles enable maximizing the surface-to-volume ratio and are then ideally suited for these studies. Unfortunately, designing high crystallinity manganites with narrow size distribution is a strong challenge. These iono-covalent solids form only above 240 °C.[17–19] contrary to ionic halide perovskites.[1–3] Organic solvents usually react with Mn4+ species so that they are not
suitable to reach mixed valence manganites. On the opposite, some hydrothermal syntheses yield manganites, but only at the microscale. Sol-gel approaches combined to thermal treatments have been used to synthesize manganites.[20–22] They produce nanoparticles with a high density of crystal defects that are detrimental to magnetotransport and complicate the interpretation of catalytic properties. Some teams reported the use of molten inorganic salts as high temperature liquid media where manganite nanoparticles.[8,23–27] The particles were nevertheless poorly faceted and still exhibited crystal defects. Faceted cobaltite particles were obtained the same way but at the submicronic scale.[28] Our team reinvestigated recently the molten salt
approach, by setting conditions for narrow size distribution and low density of crystal defects through a burst of nucleation triggered by large heating rates (Scheme 1).[15] As a result, highly
crystalline and faceted 20 nm nanocrystals of La2/3Sr1/3MnO3
(LSMO) could be designed. LSMO is however only one of the numerous members of the manganite perovskite family.
Scheme 1. Schematic description of the molten salt-mediated synthesis of
manganite perovskites.
Overall, the versatility of the molten salt approach is still to be demonstrated for this strategy to become viable in the design of manganite nanocrystals and then to pave the way towards intensive study of catalytic and magnetotransport properties. The
[a] Dr. F. Gonell, Ms. N. Alem, Mr. G. Crochet, Prof. C. Laberty-Robert, Dr. D. Portehault
Sorbonne Université, CNRS, Laboratoire Chimie de la Matière Condensée de Paris, LCMCP, 4 Place Jussieu, F-75005 Paris, France
E-mail: david.portehault@sorbonne-universite.fr [b] Dr. P. Dunne, Prof. B. Doudin
Institut de Physique et Chimie des Matériaux de Strasbourg, Université de Strasbourg, CNRS UMR 7504, 23 rue du Loess, BP 43, F-67034 Strasbourg Cedex 2, France
[c] Dr. P. Beaunier, Dr. C. Méthivier
Sorbonne Université, CNRS, Laboratoire de Réactivité de Surface, LRS, 4 Place Jussieu, F-75005 Paris, France
[d] D. Montero
Sorbonne Université, CNRS, Institut des Matériaux de Paris Centre, IMPC, 4 Place Jussieu, F-75005 Paris, France
Supporting information for this article is given at the end of the document
aim of the present report is to assess the suitability of the molten salt approach for designing several manganite perovskite nanocrystals. We especially address La2/3Sr1/3MnO3 (LSMO),
La2/3Ca1/3MnO3 (LCMO) and La1/3Pr1/3Ca1/3MnO3 (LPCMO)
nanocrystals to demonstrate versatility in available substitutions on the A site of perovskite nanocrystals. The magnetization curves of these samples at low temperature hint at a strong effect of the substitution and of nanoscaling on the magnetic properties of these nanomaterials.
Results and Discussion
Manganite perovskite nanocrystals were synthesized by adapting a previously reported procedure that was dedicated to LSMO particles.[15] The approach consists in triggering the reaction
between nitrate salts of manganese (II) and La, Pr, Sr or Ca into molten potassium nitrate (Tfus = 334 °C). In order to decrease the
particle size and enable relatively narrow size distribution without using organic surface ligands, nucleation events were favored by applying a large heating rate. This was achieved by introducing the powdered mixture initially at room temperature into an oven pre-heated at the set point between 600 and 800 °C. To avoid extensive growth, the reaction medium was also quenched by transferring the reaction crucible from the hot oven to room temperature, enabling solidification of the salt within ca. 5 min. X-ray powder diffraction (XRD) shows that LSMO nanoparticles were obtained at 600 °C according to our previous report (Figure 1).[15] In the same conditions, substituting Sr with Ca to
obtain LCMO and/or partially substituting La with Pr to obtain LPCMO do not yield pure phases but impurities of birnessite potassium manganese oxide K0.2MnO2·xH2O, CaMnO3 perovskite
and La(OH)3 (Figure S1 and Figure S2). In order to achieve
complete reaction, the temperature was increased to 750 °C (Figure S1 and Figure S2). However, incomplete reactivity was still observed, as the CaMnO3 phase could still be observed. To
avoid this side product, Ca was introduced with a 10 mol. % default. According to XRD (Figure 1), LCMO and LPCMO are obtained as pure phases. Elemental analysis by ICP-OES yields compositions of La0.6Sr0.4MnO3, La0.6Ca0.4MnO3 and
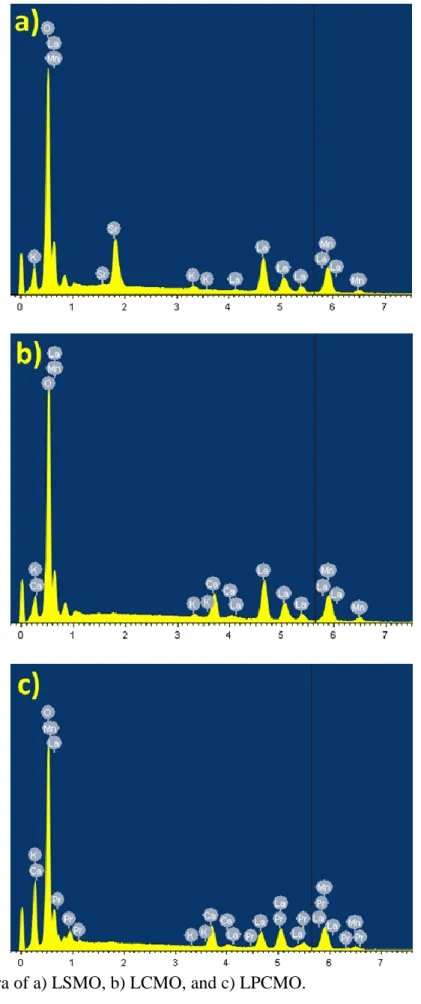
La0.4Pr0.3Ca0.3MnO3, close to the expected values. The K/Mn
molar ratio was evaluated by Energy Dispersive X-ray analysis (EDX, Figure S3) to 0.05, and 0.04 for LSMO and LCMO, respectively. For LPCMO, the K content was below the detection threshold. According to previous data of atom-scale chemical mapping, which could not detect K substitution into the LSMO nanocrystals,[15] the most probable origin of the K content in
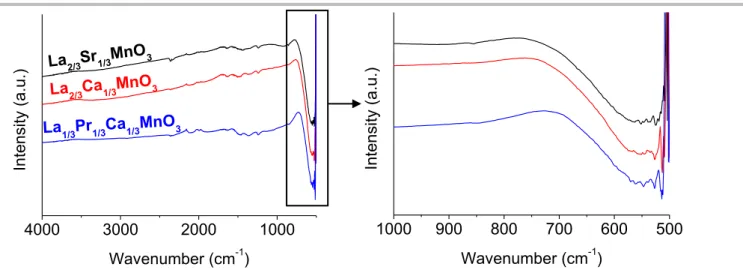
LSMO and LCMO is surface contamination from the synthesis medium. Fast Fourier Transform Infrared spectroscopy (FTIR,
Figure S4) shows for the three samples a broad band centered
at 550 cm-1, which corresponds to the stretching vibration of
Mn-O in MnMn-O6 octahedra. No trace of carbonates could be detected.
Figure 1. XRD patterns of LSMO, LCMO and LPCMO samples obtained at 600,
750 and 750 °C, respectively.
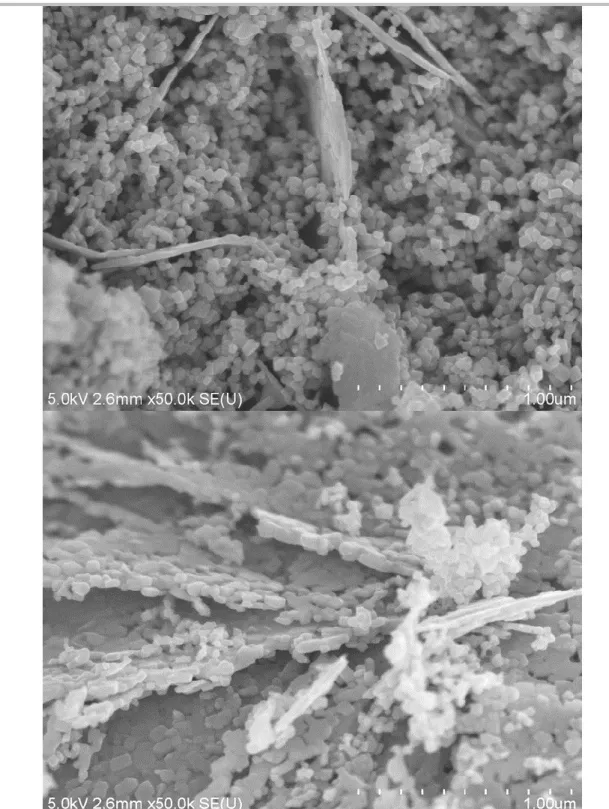
Figure 2. SEM images of (a, b) LSMO, (c, d) LCMO and (e, f) LPCMO samples
obtained at 600, 750 and 750 °C, respectively.
Scanning electron microscopy (SEM, Figure 2) shows that LSMO, LCMO and LPCMO samples are homogeneously formed of ca. 20, 20 and 40 nm nanoparticles. The LPCMO sample also comprises some sheets apparently made of the assembly of nanoparticles (Figure S5). According to EDX, they correspond to a Ca-poor perovskite phase La0.6Pr0.3Ca0.1MnO3.
Transmission electron microscopy (TEM, Figure 3a-c) highlights cubic nanoparticles of ca. 20, 22 and 38 nm for LSMO, LCMO and LPCMO, respectively. The size distributions are relatively narrow (Figure 3d-f) if one considers the absence of
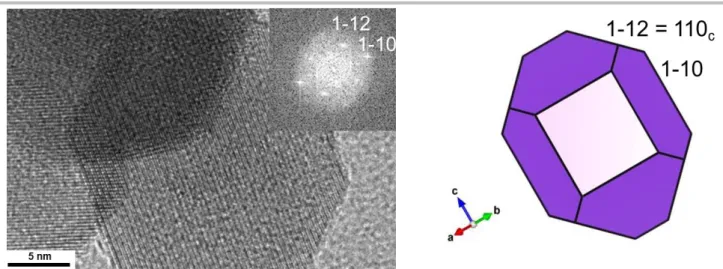
any surface stabilizing ligand, which distinguishes the molten salt approach compared to colloidal syntheses in organic solvents. HRTEM images and the corresponding Fast Fourier transforms are fully consistent with the expected distorted perovskite structures, with space groups R-3c, Pbnm and Pnma for LSMO, LCMO and LPCMO, respectively. HRTEM also allows identifying facets and deciphering the 3D crystal shapes (Figure 3g-i). For all compounds, the cube-like nanocrystals exhibit main facets along the {001}c planes of the perfect cubic perovskite structure
(Figure 3j-n). They also show minor facets along the {111}c and
{011}c planes of the cubic structure, leading to nanocubes
truncated on each edge and corner (Figure 3j-n). Noteworthy, the nanocrystals do not show any evidence of extended crystal defects. We have shown in a previous report that LSMO nanocrystals are single crystals and show only few crystal defects. According to HRTEM, LCMO and LPCMO behave in the same way. No amorphous surface layer was detected. Noteworthy, the LCMO sample also exhibits a minor population of nanocrystals which show overexpressed 110c facets (Figure S6). The
composition homogeneity was confirmed by scanning TEM-Energy Dispersive X-ray Spectroscopy (STEM-EDS) mapping (Figures 4-6).
Figure 3. (a-c) TEM images, (d-f) corresponding diameter distributions, (g-i) HRTEM images and (j-l) corresponding projections of nanocrystals of (a, d, g, j) LSMO,
(b, e, h, k) LCMO and (c, f, i, l) LPCMO. (m) 3D model of nanocrystals with indexation of the facets along the ideal cubic perovskite structure. (n) Similar model where the crystal structure is shown, in the case of LSMO.
Figure 4. (a) TEM and (b) STEM-HAADF images of LSMO. STEM-EDX (c) O,
(d) La, (e) Mn, (f) Sr maps.
Figure 5. (a) TEM and (b) STEM-HAADF images of LCMO. STEM-EDX (c) O,
Figure 6. (a) TEM and (b) STEM-HAADF images of LPCMO. STEM-EDX (c) Pr,
(d) La, (e) Mn, (f) Ca maps.
The Mn oxidation states were probed by X-ray photoelectron spectroscopy (XPS), with a probed depth of ca. 10 nm. The Mn 2p3/2 signal can be well described through two
quintuplets (Figures 7 and S7) characteristic of Mn3+ and Mn4+ in
oxide environments, respectively.[29,30] The average Mn oxidation
states were then roughly evaluated from the area ratio of these two species, yielding Mn3.3+, Mn3.2+ and Mn3.2+ in average for
LSMO, LCMO and LPCMO, respectively. These values are in agreement with the measured compositions. They are also consistent with previous data recorded for LSMO nanocubes,[15]
for which STEM coupled to electron energy loss spectroscopy showed reduction of Mn cations in a ~1 nm surface layer. The O 1s signal (Figure S8) shows the characteristic contributions of lattice oxygen O2-, but also of hydroxyl HO- and aquo H
2O groups
adsorbed on the surface of the nanocrystals exposed to air and water during the washing step.
Figure 7. Mn 2p3/2 region of the XPS spectra for LSMO, LCMO and LPCMO. The deconvolution is made by using a Mn3+ (red) and a Mn4+ (blue) quintuplets.
Strongly correlated systems such as manganites are known to exhibit spatial separation between regions of different magnetic ordering.[12,31] Most commonly, phase separation is observed
between an insulating antiferromagnetic charge-ordered (CO) phase and a metallic ferromagnetic (FM) phase. Charge ordering is the result of a periodic arrangement of cations with different oxidation states in the crystal lattice. LSMO has a relatively simple magnetic-electric phase diagram, being a paramagnetic (PM) insulator above its Curie temperature, and a ferromagnetic (FM) metal below,[12], with no significant CO phase. LCMO on the other
hand contains not only a FM metal-to-PM insulator transition, but there is also evidence for the coexistence of an insulating antiferromagnetic charge-ordered (CO) phase close to the Curie temperature for our composition.[12] Finally, LPCMO has a
complex phase diagram,[32–35] with the co-existence of both an antiferromagnetic CO phase and a metallic FM phase over a range of temperatures.
Isothermal magnetization curves at 5 K of the three samples, LSMO, LCMO, and LPCMO (Figure 8a) reveal a mixed magnetic response consisting of both FM and PM signals. Field cooled and zero field cooled measurements, shown here for LSMO (Figure 8b), reveal a commonly observed Curie temperature,Tc = 310 K, using a Curie-Weiss approximation at high temperatures. (Tc = 279 K, 152 K for LCMO and LPCMO respectively). The blocking temperatures exhibit a broad distribution with maxima in the ZFC curves at around 83, 114 and 64 K for LSMO, LCMO and LPCMO respectively. After extrapolation of the high field paramagnetic slopes, the saturation magnetization for all three powders is significantly less than the ideal value of 3.67 µB/f.u. for
the bulk phases (Table 1). Less than half the volume is ferromagnetic (VFM). with the rest behaving as a disordered magnetic state.[15] Furthermore, from the high field slopes, one
can estimate an effective paramagnetic moment assuming a Curie Law dependence, hence a volume fraction (VPM) of the paramagnetic-like phase. The high field error in using such a Curie model compared to a Langevin or Brillouin function is ~10%. The residue corresponds to a fraction VNM of the materials with no contribution to the particle magnetization. The volume fractions
VPM and VNM can be translated into thicknesses tPM and tNM (Table 1) of paramagnetic and non-magnetic shells in two simple models: FM-PM-NM (FPN) and FM-NM-PM (FNP) core-shell-shell models. Our previous observations on LSMO already suggested a FM-PM core-shell model.[15] Interestingly, the shell
thicknesses are of the order of few Mn-O-Mn bond lengths (corresponding to the ideal perovskite unit cell (001)c lattice
Figure 8. a) Magnetization curves of LSMO, LCMO, and LPCMO at 5 K, and b) field cooled (FC), zero field cooled (ZFC) magnetization curves of LSMO Table 1. Magnetic properties of LSMO, LCMO and LPCMO obtained after decomposition of the magnetization curves. d is the particles diameter evaluated by TEM;
mFM, mPM and mNM are the saturation magnetization of the ferromagnetic (FM) component, the magnetic moments of the paramagnetic (PM) and non-magnetic
(NM) phases, respectively. VFM, VPM and VNM are the volume fractions of the ferromagnetic (FM), paramagnetic-like (PM) and non-magnetic (NM) components,
respectively. dFM is the diameter of the FM core. tPMFPN and tNMFPN are the thicknesses of the PM and NM components assuming a core-shell-shell FM-PM-NM model. tPMFNP and tNMFNP are the thicknesses of the PM and NM components assuming a core-shell-shell FM-NM-PM model.
d mFM mPM mNM VFM VPM VNM dFM tPMFPN tNMFPN tPMFNP tNMFNP
nm µB/f.u. µB/f.u. µB/f.u. % % % nm nm nm nm nm
LSMO 20 1.05 1.34 1.28 29 37 34 13.2 2.1 1.3 1.4 2.0
LCMO 22 1.69 1.26 0.72 46 34 20 17.0 1.7 0.8 1.4 1.1
LPCMO 38 1.71 1.59 0.37 47 43 10 29.5 3.6 0.7 3.3 1.0
Electronic phase separation (EPS), is a signature phenomenon of LSMO, LCMO and LPCMO, where both ferromagnetic-metal and paramagnetic-insulator phases can coexist.[12] Depending on the composition, EPS typically occurs at
the mesoscale (500 – 800 nm),[16] but nanoscale EPS is also
reported, arising from the interplay between cation
inhomogeneities and long-range Coulomb interactions.[36] For a
uniform cation distribution, the EPS length scale is of the order of 5-10 ideal perovskite unit cell parameters ((001)c lattice
spacing),[36] in agreement with our observations of ca. 3-5 (001) c
lattice spacing thicknesses for the paramagnetic layers in LSMO and LCMO for both core-shell-shell models. The PM layer for LPCMO appears thicker with ca. 9 (001)c lattice spacings. These
values emphasize the importance of the high crystallinity and low density of crystal defects achieved in these molten salt-derived nanocrystals.
Conclusions
In this report we have successfully designed manganite perovskite oxide nanocrystals of La2/3Sr1/3MnO3, La2/3Ca1/3MnO3
and La1/3Pr1/3Ca1/3MnO3, hence demonstrating the versatility of
syntheses in molten salts to reach a range of high crystallinity manganite perovskites and then of magnetic properties. This original synthetic approach enables now to foresee numerous studies addressing the impact of the nanoscale on properties of these materials, by drawing on the abundant data available for bulk manganites or thin films and their properties tunable by cationic substitutions. Indeed, the first magnetic measurements we report highlight magnetic behaviors for the nanocrystals that are strongly different from the bulk phases.
Experimental Section
Nanocrystals synthesis. The LSMO nanoparticles synthesis was carried
out as follows, according to a previously described procedure.[15] First, potassium nitrate (65 mmol), strontium nitrate (2.65 mmol), manganese nitrate tetrahydrate (6.5 mmol), lanthanum nitrate hexahydrate (3.86 mmol) were ball milled for 2 min and then dried at 40 °C under vacuum overnight. The powder was then put into an alumina crucible and heated at 600 °C for 2 h. After cooling at room temperature the product was redispersed with deionized water and stirred for 10 min. The suspension was then separated by centrifugation (20 000 rpm, 10 min) 8 times, washed with deionized water until a conductance around 10 μS/cm was reached. The product was dried under vacuum at 40 °C overnight. The LCMO nanoparticles were obtained by a similar procedure except that instead of strontium nitrate, calcium nitrate tetrahydrate was used (1.79 mmol), and the heating dwell step was performed at 750 °C for 1 h. Likewise, the LPCMO particles were obtained by using lanthanum nitrate hexahydrate (1.99 mmol), praseodinium nitrate hexahydrate (1.99 mmol) and calcium nitrate tetrahydrate (1.79 mmol), at 750 °C for 1 h. For all syntheses, the yield was ca. 95 %.
Powder XRD patterns were recorded on a Bruker D8 advance
diffractometer operating at the Cu-Kα wavelength. ICSD references used for indexation were 50717, 82820, 96909 for LSMO, LCMO and LPCMO respectively.
SEM was performed on a Hitachi SU-70 microscope equipped with a field
emission gun, at 5 kV accelerating voltage and without coating.the samples.
TEM, HRTEM, STEM images and STEM-EDX maps were recorded on a
JEM 2100Plus UHR microscope operating at 200 kV, interfaced to a Oxford Instruments AZtex EDS system with an XMax T large area
(80 mm2) SDD detector. The powders were dispersed in ethanol, then drop-casted on carbon-coated copper grids. The ICSD references cited in the XRD section were used for indexation of the HRTEM images.
XP spectra were collected on a Omicron Argus X-ray photoelectron
spectrometer, using a monochromated AlK (h = 1486.6 eV) radiation source with a 300 W electron beam power. The emission of photoelectrons from the sample was analyzed at a takeoff angle of 45° under ultra-high vacuum conditions (10-8 Pa). High resolution XP spectra were collected at pass energy of 20 eV. The peak areas were determined after subtraction of a Shirley background. Spectrum processing was carried out using the Casa XPS software package.
Magnetisation loops were measured at 5 K using a commercial Quantum
Design Magnetic Properties Measurement System (MPMS) with a vibrating sample magnetometer.
Acknowledgements
This work was supported by the French national agency for research (ANR) under the project SALTYSPIN ANR-17-CE09-0005. FG and DP also acknowledge support from region Ile de France through the Domaine d’Intérêt Majeur DIM Nano-K with the project COSMOS. The FEG-SEM facility of Institut des Matériaux de Paris Centre was funded by Sorbonne Université, CNRS and by C'Nano - Ile-de-France. Support of the Région Grand-Est (PD) is also acknowledged.
Keywords: nanocrystals • manganite • perovskites • molten salts • magnetism
[1] Z. Xia, K. R. Poeppelmeier, Acc. Chem. Res. 2017, 50, 1222. [2] H. Huang, M. Bodnarchuk, S. V Kershaw, M. V. Kovalenko, A. L.
Rogach, ACS Energy Lett. 2017, 2, 2071.
[3] H. Huang, H. Yuan, K. P. F. Janssen, G. Solís-Fernández, Y. Wang, C. Y. X. Tan, D. Jonckheere, E. Debroye, J. Long, J. Hendrix, J. Hofkens, J. A. Steele, M. B. J. Roeffaers, ACS Energy Lett. 2018, 3, 755.
[4] M. A. Peña, J. L. G. Fierro, Chem. Rev. 2001, 101, 1981. [5] Y. Zhu, W. Zhou, Z. Shao, Small 2017, 13, 1.
[6] J. Hwang, R. R. Rao, L. Giordano, Y. Katayama, Y. Yu, Y. Shao-Horn, Science (80-. ). 2017, 358, 751.
[7] M. Gaudon, C. Laberty-Robert, F. Ansart, P. Stevens, A. Rousset, Solid State Sci. 2002, 4, 125.
[8] Y. Tian, W. Liu, Y. Lu, S. Sun, Nano 2016, 11, 1650059. [9] A. Grimaud, K. J. May, C. E. Carlton, Y.-L. Lee, M. Risch, W. T.
Hong, J. Zhou, Y. Shao-Horn, Nat. Commun. 2013, 4, 2439. [10] K. a. Stoerzinger, W. Lü, C. Li, Ariando, T. Venkatesan, Y.
Shao-Horn, J. Phys. Chem. Lett. 2015, 6, 1435.
[11] J. Suntivich, H. a Gasteiger, N. Yabuuchi, H. Nakanishi, J. B. Goodenough, Y. Shao-Horn, Nat. Chem. 2011, 3, 546. [12] J. M. D. Coey, M. Viret, S. von Molnár, Adv. Phys. 1999, 48, 167. [13] J. Shao, H. Liu, K. Zhang, Y. Yu, W. Yu, H. Lin, J. Niu, K. Du, Y.
Kou, W. Wei, F. Lan, Y. Zhu, W. Wang, J. Xiao, L. Yin, E. W. Plummer, J. Shen, Proc. Natl. Acad. Sci. 2016, 113, 9228. [14] Y. Zhu, K. Du, J. Niu, L. Lin, W. Wei, H. Liu, H. Lin, K. Zhang, T.
Yang, Y. Kou, J. Shao, X. Gao, X. Xu, X. Wu, S. Dong, L. Yin, J. Shen, Nat. Commun. 2016, 7, 11260.
[15] H. Le Thi N’Goc, L. D. N. Mouafo, C. Etrillard, A. Torres-Pardo, J.-F. Dayen, S. Rano, G. Rousse, C. Laberty-Robert, J. G. Calbet, M. Drillon, C. Sanchez, B. Doudin, D. Portehault, Adv. Mater. 2017, 29,
1604745.
[16] G. Iniama, P. De La Presa, J. M. Alonso, M. Multigner, B. I. Ita, R. Cortés-Gil, M. L. Ruiz-González, A. Hernando, J. M. Gonzalez-Calbet, J. Appl. Phys. 2014, 116, 0.
[17] D. Portehault, S. Delacroix, G. Gouget, R. Grosjean, T.-H.-C. Chan-Chang, Acc. Chem. Res. 2018, 51, 930.
[18] K. Huang, W. Feng, L. Yuan, J. Zhang, X. Chu, C. Hou, X. Wu, S. Feng, CrystEngComm 2014, 16, 9842.
[19] K. Huang, L. Yuan, S. Feng, Inorg. Chem. Front. 2015, 2, 965. [20] R. Epherre, E. Duguet, S. Mornet, E. Pollert, S. Louguet, S.
Lecommandoux, C. Schatz, G. Goglio, J. Mater. Chem. 2011, 21, 4393.
[21] Z. Duan, M. Xu, T. Li, Y. Zhang, H. Zou, Sensors Actuators, B Chem. 2018, 258, 527.
[22] T. Kinoshita, T. Furuyabu, M. Adachi, Jpn. J. Appl. Phys. 2014, 53, 105001.
[23] Y. Tian, D. Chen, X. Jiao, Chem. Mater. 2006, 3, 6088. [24] M. Kačenka, O. Kaman, Z. Jirák, M. Maryško, P. Veverka, M.
Veverka, S. Vratislav, J. Solid State Chem. 2014, 221, 364. [25] M. Kačenka, O. Kaman, S. Kikerlová, B. Pavlů, Z. Jirák, D. Jirák, V.
Herynek, J. Černý, F. Chaput, S. Laurent, I. Lukeš, J. Colloid Interface Sci. 2015, 447, 97.
[26] N. Belozerova, S. Kichanov, D. Kozlenko, O. Kaman, Z. Jirak, IEEE Trans. Magn. 2017, 1.
[27] O. Kaman, V. Herynek, P. Veverka, L. Kubickova, M. Pashchenko, J. Kulickova, Z. Jirak, IEEE Trans. Magn. 2018, 1.
[28] X. Wang, K. Huang, L. Yuan, S. Li, W. Ma, Z. Liu, S. Feng, ACS Appl. Mater. Interfaces 2018, 10, 28219.
[29] M. C. Biesinger, L. W. M. Lau, A. R. Gerson, R. S. C. Smart, Appl. Surf. Sci. 2010, 257, 887.
[30] M. C. Biesinger, B. P. Payne, A. P. Grosvenor, L. W. M. Lau, A. R. Gerson, R. S. C. Smart, Appl. Surf. Sci. 2011, 257, 2717. [31] V. B. Shenoy, C. N. R. Rao, Philos. Trans. A. Math. Phys. Eng. Sci.
2008, 366, 63.
[32] M. Uehara, S. Mori, C. H. Chen, S. W. Cheong, Nature 1999, 399, 560.
[33] M. Quintero, A. G. Leyva, P. Levy, F. Parisi, O. Agüero, I. Torriani, M. G. das Virgens, L. Ghivelder, Phys. B Condens. Matter 2004, 354, 63.
[34] P. Levy, F. Parisi, M. Quintero, L. Granja, J. Curiale, J. Sacanell, G. Leyva, G. Polla, R. S. Freitas, L. Ghivelder, Phys. Rev. B 2002, 65, 140401.
[35] C. Şen, G. Alvarez, E. Dagotto, Phys. Rev. Lett. 2007, 98, 127202. [36] V. B. Shenoy, H. R. Krishnamurthy, T. V. Ramakrishnan, Phys. Rev.
Manganese oxide perovskites are
obtained for the first time as highly crystalline, well-faceted nanocrystals. High temperature liquid phase syntheses in molten salts thus offer a nice playground to assess the impact of the nanoscale on the properties of these materials, as exemplified by the magnetic properties of three different manganites.
Francisco Gonell, Naoual Alem, Peter Dunne, Guillaume Crochet, Patricia Beaunier, Christophe Méthivier, David Montero, Christel Laberty-Robert, Bernard Doudin, and David Portehault* Page No. – Page No.
Versatile molten salt synthesis of manganite perovskite oxide nanocrystals and their magnetic properties
Supplementary information
Versatile molten salt synthesis of manganite perovskite oxide
nanocrystals and their magnetic properties
Francisco Gonell,
[a]Naoual Alem,
[a]Peter Dunne,
[b]Guillaume Crochet,
[a]Patricia Beaunier,
[c]Christophe Méthivier,
[c]David Montero,
[d]Christel Laberty-Robert,
[a]Bernard Doudin,
[b]and David
Portehault
[a]*
[a] Dr. F. Gonell, Ms. N. Alem, Mr. G. Crochet, Prof. C. Laberty-Robert, Dr. D. Portehault
Sorbonne Université, CNRS, Laboratoire Chimie de la Matière Condensée de Paris, LCMCP, 4 Place Jussieu, F-75005 Paris, France E-mail: david.portehault@sorbonne-universite.fr
[b] Dr. P. Dunne, Prof. B. Doudin
Institut de Physique et Chimie des Matériaux de Strasbourg, Université de Strasbourg, CNRS UMR 7504, 23 rue du Loess, BP 43, F-67034 Strasbourg Cedex 2, France
[c] Dr. P. Beaunier, Dr. C. Méthivier
Sorbonne Université, CNRS, Laboratoire de Réactivité de Surface, LRS, 4 Place Jussieu, F-75005 Paris, France [d] D. Montero
Figure S1. XRD diagrams of the powders obtained at different temperatures and heating time of 1 h for
the synthesis of LCMO nanoparticles.
Figure S2. XRD diagrams of the powders obtained at different temperatures and heating time of 1 h for
Figure S4. FTIR spectra of LSMO, LCMO and LPCMO: overall spectra on the left, zoom-in on the
right.
4000
3000
2000
1000
La
1/3Pr
1/3Ca
1/3MnO
3La
2/3Sr
1/3MnO
3La
2/3Ca
1/3MnO
3Inte
nsity (
a.u
.)
Wavenumber (cm
-1)
1000
900
800
700
600
500
Inte
nsity (
a.u
.)
Wavenumber (cm
-1)
Figure S5. SEM images of the LPCMO sample showing minor amounts of sheets among the LPCMO
nanocubes. EDX performed on the sheets isolated by sedimentation yields a composition of
La
0.6Pr
0.3Ca
0.1MnO
3.
Figure S6. HRTEM image indexed along the LCMO structure (FFT in inset) and corresponding
Figure S7. Mn 2p (top) and Mn 2p3/2
(bottom) areas of the XPS spectra of LSMO, LCMO and LPCMO
samples, with the corresponding deconvolutions into a Mn
3+(red) and a Mn
4+(blue) quintuplets.
665 660 655 650 645 640 635 Mn4+ 3 kcps Mn2p Mn3+ LPCMO LCMO LSMO
Binding Energy (eV)
650 645 640 635 Mn4+ 3 kcps Mn2p3/2 Mn3+ LPCMO LCMO LSMO
Figure S8. O 1s areas of the XPS spectra of LSMO, LCMO and LPCMO samples, with the
corresponding deconvolutions into oxo, hydroxo and aquo groups.
540 538 536 534 532 530 528 526