A threshold-based weather model for predicting stripe rust infection in winter wheat
11
0
0
Texte intégral
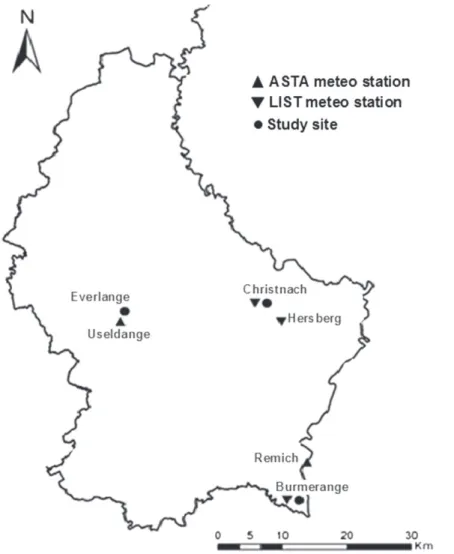
(2) Junk et al. 2016) indicate that its development requires at least 12 uninterrupted hours with conditions of 8 < T < 16°C, associated with RH >60% (optimal values being T = 12 to 16°C, RH = 80%) and rainfall (R) <1 mm. Although the conditions fostering WSR development have been extensively studied and discussed (e.g., de Vallavieille-Pope et al. 1995, 2000; Geagea et al. 1999; Sache and de Vallavieille-Pope 1993), the combined effect of weather variables conducive to infection by P. striiformis and subsequent progress of WSR in the field has not been fully established. The overall objective of this study was to develop a weather-based infection risk model for WSR. Specific objectives were to (i) characterize the optimum set of weather variables conducive to the development of WSR in commercial winter wheat fields, and (ii) develop and evaluate the performance of a threshold-based model to predict infection events by P. striiformis in the field.. Materials and Methods Experimental fields and disease monitoring. Field experiments were established at three sites in Luxembourg (Burmerange, Christnach, and Everlange; Fig. 1) during the 1999 to 2015 cropping seasons. All the sites were located in the Gutland region, which is one of the main cereal production areas in Luxembourg: Burmerange and Christnach are in the Grevenmacher district; and Everlange is in the Diekirch district (Larue 2012; MAVPC 2015; STATEC 2000). To ensure the representability of wheat growing areas, the fields were selected based on two criteria: firstly their location on a plateau (since winter wheat is cultivated primarily on plateaus in Luxembourg), and secondly the climatic region (MAVCP 2016).. The experiment sites at Burmerange and Christnach were located in a commercial wheat field (selected in collaboration with the Administration des Services Techniques de l’Agriculture du Luxembourg); while the experimental plots at Everlange were part of a large experimental site of the Lyc´ee Technique Agricole d’Ettelbr¨uck. All crop management practices at the latter site were similar to those in commercial fields, except the fungicide treatment. The study sites were planted with several wheat cultivars showing a range of susceptibility to WSR (Table 1), and trials were designed in a randomized block with four replicates (one replicate plot size = 8.0 × 1.5 m). No fungicide was applied on plots monitored during this study. Sowing and harvest methods, as well as crop practices, were typical of wheat production in Luxembourg (El Jarroudi et al. 2009; Larue 2012). Plant growth stages (GSs) were assessed according to the Zadoks decimal scale (Zadoks et al. 1974). Hourly weather data (T, RH, and R) were collected from nearby (<2 km) automatic weather stations (Fig. 1). Visual assessments of WSR (incidence and severity) were made on a weekly basis from GS 29-30 (stem elongation) to GS 85 (soft dough). WSR was identified on the basis of yellow to orange, round to ovoid, erumpent uredinia that were 1.0 to 1.5 mm in diameter, scattered on both the upper and the lower leaf surfaces (El Jarroudi et al. 2011). Disease incidence (proportion of symptomatic plants) and severity (percent leaf area diseased) were assessed on the same 10 plants in each plot throughout the growing season (these plants were marked at the beginning of the field experiment). To minimize errors, standard area diagrams for cereal diseases were presented to evaluators who assessed the severity in the field, and disease severity assessment training software (i.e., DISTRAIN, Tomerlin and Howell. Fig. 1. Location of the study sites (filled circles) and weather stations (triangles). Upward triangle: weather station managed by the Administration Des Services Techniques de l’Agriculture (ASTA). Downward triangle: weather station managed by the Luxembourg Institute of Science and Technology (LIST, former Centre de Recherche Public Gabriel Lippmann - CRP). Weather data used in the study were obtained from these locations. 694. Plant Disease / Vol. 101 No. 5.
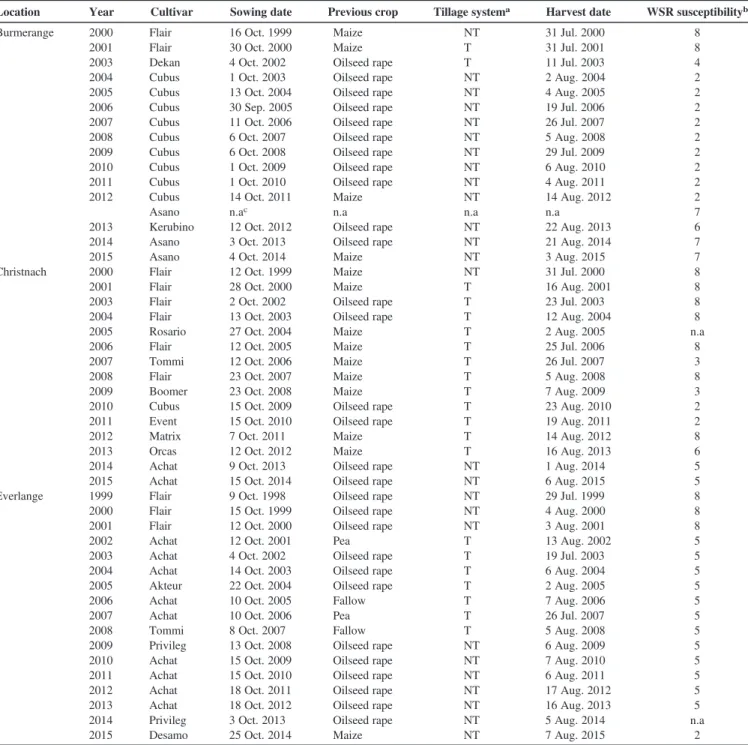
(3) 1988) was used by the evaluators. Both aids were used to ensure accuracy of estimates. Furthermore, the same evaluators assessed the same experimental sites in each season to minimize season-to-season rater-associated variability. Modeling weather and disease data. The modeling approach (Fig. 2) is a stepwise approach consisting of i) the determination of the potential range of weather conditions conducive to WSR in Luxembourg using a stochastic approach, and ii) the determination of optimum classes of combined weather variables (T, RH, and R) conducive to the disease and building of a weather threshold based model for predicting WSR infection events. These steps are detailed in the following sections. The stochastic approach: the Dennis model and Monte Carlo simulation. Several modeling approaches are used to develop WSR models, ranging from statistical relationships between meteorological variables and disease severity (Coakley et al. 1988; Magarey. et al. 2005), to mechanistic modeling (Krause and Massie 1975; Reinink 1986). To describe the infection of wheat by P. striiformis, Dennis (1987) proposed a multiple regression model based on air temperature and surface wetness period: I = − 355:14 + 0:99T + 1:64T 2 − 0:11T 3 + 292:99lnðWPÞ − 48:26ðlnðWPÞÞ2 − 1:55T × lnðWPÞ. (1). where I corresponds to percentage leaf area diseased (%); T is the air temperature (°C), and WP describes the wetness period (h). Negative values = 0. Monte Carlo simulation provides a means of modeling disease epidemics based on the generation of random dataset (Johansen 2010; L’Ecuyer 1996; Luo et al. 1993; Muralidhar 2003). Monte Carlo simulation was selected because a large number of input data can be. Table 1. Agronomic information for fields of winter wheat at three experimental sites in Luxembourg, 1999 to 2015. Experiments were conducted in 1998 and 1999 at Everlange. During the 2001–02 cropping season, there was no experiment at Burmerange or Christnach Location. Year. Cultivar. Sowing date. Previous crop. Tillage systema. Harvest date. WSR susceptibilityb. Burmerange. 2000 2001 2003 2004 2005 2006 2007 2008 2009 2010 2011 2012. Flair Flair Dekan Cubus Cubus Cubus Cubus Cubus Cubus Cubus Cubus Cubus Asano Kerubino Asano Asano Flair Flair Flair Flair Rosario Flair Tommi Flair Boomer Cubus Event Matrix Orcas Achat Achat Flair Flair Flair Achat Achat Achat Akteur Achat Achat Tommi Privileg Achat Achat Achat Achat Privileg Desamo. 16 Oct. 1999 30 Oct. 2000 4 Oct. 2002 1 Oct. 2003 13 Oct. 2004 30 Sep. 2005 11 Oct. 2006 6 Oct. 2007 6 Oct. 2008 1 Oct. 2009 1 Oct. 2010 14 Oct. 2011 n.ac 12 Oct. 2012 3 Oct. 2013 4 Oct. 2014 12 Oct. 1999 28 Oct. 2000 2 Oct. 2002 13 Oct. 2003 27 Oct. 2004 12 Oct. 2005 12 Oct. 2006 23 Oct. 2007 23 Oct. 2008 15 Oct. 2009 15 Oct. 2010 7 Oct. 2011 12 Oct. 2012 9 Oct. 2013 15 Oct. 2014 9 Oct. 1998 15 Oct. 1999 12 Oct. 2000 12 Oct. 2001 4 Oct. 2002 14 Oct. 2003 22 Oct. 2004 10 Oct. 2005 10 Oct. 2006 8 Oct. 2007 13 Oct. 2008 15 Oct. 2009 15 Oct. 2010 18 Oct. 2011 18 Oct. 2012 3 Oct. 2013 25 Oct. 2014. Maize Maize Oilseed rape Oilseed rape Oilseed rape Oilseed rape Oilseed rape Oilseed rape Oilseed rape Oilseed rape Oilseed rape Maize n.a Oilseed rape Oilseed rape Maize Maize Maize Oilseed rape Oilseed rape Maize Maize Maize Maize Maize Oilseed rape Oilseed rape Maize Maize Oilseed rape Oilseed rape Oilseed rape Oilseed rape Oilseed rape Pea Oilseed rape Oilseed rape Oilseed rape Fallow Pea Fallow Oilseed rape Oilseed rape Oilseed rape Oilseed rape Oilseed rape Oilseed rape Maize. NT T T NT NT NT NT NT NT NT NT NT n.a NT NT NT NT T T T T T T T T T T T T NT NT NT NT NT T T T T T T T NT NT NT NT NT NT NT. 31 Jul. 2000 31 Jul. 2001 11 Jul. 2003 2 Aug. 2004 4 Aug. 2005 19 Jul. 2006 26 Jul. 2007 5 Aug. 2008 29 Jul. 2009 6 Aug. 2010 4 Aug. 2011 14 Aug. 2012 n.a 22 Aug. 2013 21 Aug. 2014 3 Aug. 2015 31 Jul. 2000 16 Aug. 2001 23 Jul. 2003 12 Aug. 2004 2 Aug. 2005 25 Jul. 2006 26 Jul. 2007 5 Aug. 2008 7 Aug. 2009 23 Aug. 2010 19 Aug. 2011 14 Aug. 2012 16 Aug. 2013 1 Aug. 2014 6 Aug. 2015 29 Jul. 1999 4 Aug. 2000 3 Aug. 2001 13 Aug. 2002 19 Jul. 2003 6 Aug. 2004 2 Aug. 2005 7 Aug. 2006 26 Jul. 2007 5 Aug. 2008 6 Aug. 2009 7 Aug. 2010 6 Aug. 2011 17 Aug. 2012 16 Aug. 2013 5 Aug. 2014 7 Aug. 2015. 8 8 4 2 2 2 2 2 2 2 2 2 7 6 7 7 8 8 8 8 n.a 8 3 8 3 2 2 8 6 5 5 8 8 8 5 5 5 5 5 5 5 5 5 5 5 5 n.a 2. Christnach. Everlange. 2013 2014 2015 2000 2001 2003 2004 2005 2006 2007 2008 2009 2010 2011 2012 2013 2014 2015 1999 2000 2001 2002 2003 2004 2005 2006 2007 2008 2009 2010 2011 2012 2013 2014 2015. a. T: tillage; NT: no tillage. stripe rust (WSR) susceptibility: Scale 1 (low susceptibility) to 9 (high susceptibility) (BSA 2008, 2016). c Not available. b Wheat. Plant Disease / May 2017. 695.
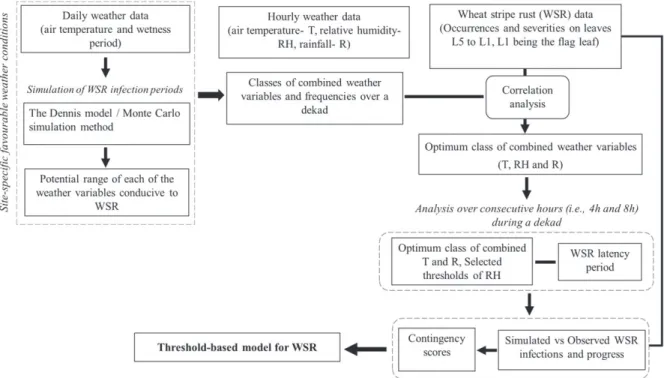
(4) Fig. 2. Descriptive flowchart of the modeling approach for predicting wheat stripe rust infection events.. Fig. 3. Boxplots of the severity of wheat stripe rust (WSR) (A); infection events by Puccinia striiformis as simulated by the model (B); relationships between simulated infection events by P. striiformis and severity of WSR (C) at the study sites in the Grand Duchy of Luxembourg during the 1999 to 2015 cropping seasons. The disease severity was the average value observed on the three upper leaves (L1 being the flag leaf) from GS 39 – GS75-85. In (A), the thick horizontal lines represent the median, the top and bottom of the box represent the 25th and 75th percentiles, and the whiskers indicate the extent of the highest and lowest data values. Closed circles are outliers and open rectangles inside the box are the mean value. The infection events in (B) are the total predicted infection events for the three upper leaves (L1-L3) during their development. 696. Plant Disease / Vol. 101 No. 5.
(5) generated to feed into the model and test various scenarios. In our study, for the calculation of each value of I according to the Dennis model, random values of T and WP were generated following a normal distribution. T and WP values were selected from the ranges 0 to 33°C, and 0 to 30 h, respectively. 10,000 random values were generated for each weather variable T and WP (i.e., 10,000 combinations of random values of T and WP were used for the calculations). Those values corresponded to the observed daily variation in weather conditions during 1999 to 2001 at the study sites during two key periods of the cropping season, i.e., spring (21 March to 21 June) and early summer (10 May to 10 July). These two periods were chosen because early infections during spring (21 March to 21 June) can foster the progress of WSR later in the growing season (if weather conditions are conducive). Determination of optimum classes of combined weather variables and model development. Subsequent to the determination of plausible weather conditions conducive to WSR, a detailed analysis was performed using hourly weather data in order to characterize the optimum class of combined weather variables conducive to WSR. This analysis was restricted to the most critical infection period (May-June). Indeed, because the development of the upper three leaves L1-L3 (L1 being the flag leaf) in winter wheat in Luxembourg generally takes place in May-June (representing approximately GS 33-37 to GS 77-85), infections by P. striiformis and resulting WSR can therefore potentially harm yield given the importance of these three leaves to wheat yield. Based on the Monte Carlo simulation outputs and the observed incidence of WSR, different intervals of hourly T, RH, and R were individually analyzed and ranked according to their frequency during each of the dekads (i.e., 10-day period) for the May-June period. Reported ranges of plausible weather conditions influencing WSR (Dennis 1987; de Vallavieille-Pope et al. 1995, 2000; Rapilly 1979) were also used for defining these intervals. The predominant interval of T and R thus determined was associated with each interval of RH and the latency period was calculated based on the class of combined weather variables. Two lengths of uninterrupted hours (minimum 4 h or minimum 8 h) when such weather conditions were met were also considered (Fig. 2). Given the difficulty of measuring WP in the field, the combination of such weather variables during uninterrupted hours is deemed to mimic leaf wetness conditions that would favor WSR epidemics (Junk et al. 2008; Huber and Gillespie 1992; Wilks and Shen 1991). Establishing such relationships aimed to determine the optimum combination of weather variables based on a given threshold frequency, i.e., frequency of this class over a dekad. At the completion of the latency period, an infection event was simulated. The latency period was calculated as follows (Zadoks 1971): P = ð1005 + 11:3TÞ=ð2:5 + 5:65TÞ. (2). where P is the latency period (days), and T is the average daily temperature (°C). We used data collected during the 2000–01 cropping seasons at all sites for model development (data from the 1999–00 season at Everlange was also included). These cropping seasons were selected because a WSR-susceptible cultivar (Flair) was sown at all sites (Table 1). Severities of WSR were expressed as area under the disease progress curve (AUDPC, Teng 1983) and was calculated for each dekad of the MayJune period (i.e., 1-10 May, 11-20 May, …). Model evaluation. The capability of the threshold-based weather model to correctly predict the infection events by P. striiformis at the end of the latency period was assessed over the testing period (1999 to 2001). The performance of the model was assessed based on a contingency table analysis of the probability of detecting (POD). infection by P. striiformis, the false alarm ratio (FAR), and the critical success index (CSI). They were calculated as follows: POD = a/(a+c); FAR = b/(a+b), and CSI = a/(a+b+c), where a, b, and c refer to infections both observed and simulated, infections simulated but not observed, and infections observed but not simulated, respectively (Crown 2012; El Jarroudi et al. 2009; Mahtour et al. 2011). An infection event was defined when a significant increase in disease severity (P < 0.05) was found between two successive field observations. When the severity was low (between 0 and 10% to 15%), a new infection was assumed to have occurred when there was >1% increase in severity between the two observations. When the severity was >15 to 20%, the increase was deemed to be >10% to be significant. Because there could be two or three latency periods between two field observations, additional field observations were made if the simulated infection events coincide with the development of leaves L3 to L1. A further evaluation of the model using the same approach was performed using data collected from experiments conducted during the 2002 to 2015 period (these data were not used in model building, and were thus solely for evaluation of the model). Although the experiment protocol was the same during the model testing and evaluation periods, differences rely on the year-to-year variability of meteorological conditions and the wheat cultivars grown (exceptions were at Christnach in 2003, 2004, 2006, and 2008 where the same cultivar, Flair, was sown; Table 1). The Monte Carlo simulation was performed using S-PLUS 2000 (TIBCO software Inc., Palo Alto, CA). Other analyses including correlation analysis and analysis of variance were performed in R (R Core Team 2015).. Results Incidence and severity of wheat stripe rust during the study period. First observation of WSR on wheat leaves during 1999 to 2015 varied according to site, year, and wheat cultivar (Supplementary Table S1). First symptoms of WSR were generally observed between mid-May and the beginning of June each year, with exceptions at Burmerange and Christnach, where the disease was first recorded as early as 22 April 2014 (both sites) and 27 April 2015 (Burmerange). During 1999 to 2015, the severity of WSR varied depending on the site and year. At Burmerange, the average severity of WSR on the three upper leaves was #6% (close to 0 in most cases) during 2000 to 2011, but in 2012 to 2015, WSR was as severe as 67% (in 2015) on some leaves (Fig. 3A). At Christnach, two WSR epidemics can be distinguished: the first during 2000 to 2001, and the second during 2012 to 2015, even though severity of WSR during the latter was relatively low compared with the severity in other years during the same period (Fig. 3A). However, at Everlange, WSR was observed regularly at moderate to high severity during the study period. Only in 2003 to 2005, 2008, and 2010 to 2012, was the average disease severity #2%; otherwise, it ranged from 2 to 19%. Less severe epidemics were observed in 1999 to 2002 and 2013 to 2014, although the average severity recorded in 2009 and 2015 was intermediate (Fig. 3A). A total of 22 to 42 infection events by P. striiformis were observed on the upper three leaves at Burmerange during 2012 to 2015 (Fig. 3B), while at Christnach and Everlange, the number of infection events ranged from 12 to 36 and 9 to 30, respectively, during the same period (at all sites, peak values were observed in 2013). Although a total of >30 P. striiformis infection events were recorded on the upper leaves throughout the cropping season, it did not always result in more severe WSR on these leaves (Fig. 3C). However, total infection events #20 were generally associated with relatively low severity of WSR (#7%).. Table 2. The intervals of air temperature (T), relative humidity (RH) and rainfall (R) considered with hourly data in the frequency analysis during minimum continuous 4-hour and 8-hour periods analyzed for each dekad during the May-June period Variable. Interval. Temperature (°C). 0<T<4. 4<T<8. 8 < T < 12. 12 < T < 16. 8 < T < 16. Relative humidity (%) Rainfall (mm). RH < 60 R=0. 60 < RH < 75 0<R#1. 75 < RH < 85 1<R<5. 85 < RH # 92 R>5. RH > 92. 4 < T < 16. 16 < T < 18. Plant Disease / May 2017. 697.
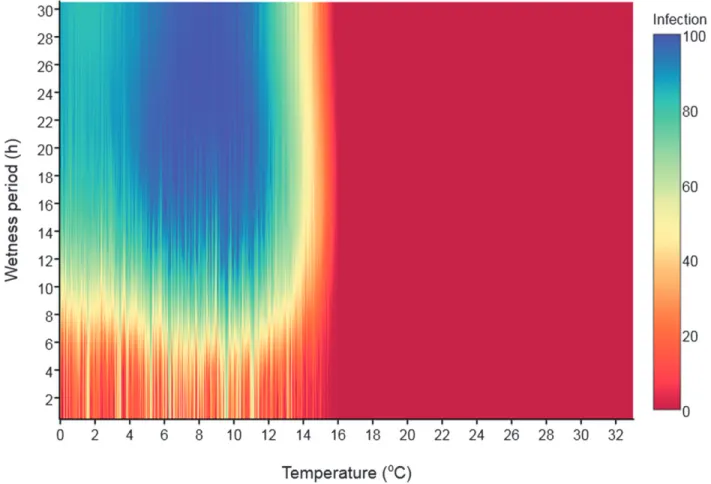
(6) Fig. 4. Sensitivity analysis of two weather variables (air temperature and wetness period) influencing infection by Puccinia striiformis resulting in wheat stripe rust. Calculations were performed with 10,000 random values generated using a Monte Carlo simulation and the Dennis model for wheat stem rust (Dennis 1987).. Fig. 5. Frequency of different classes of rainfall, relative humidity, and air temperature, as presented in Table 2, and the observed wheat stripe rust severity on the three upper leaves L1-L3 (L1 being the flag leaf) during the 1999 to 2001 period at the study sites. The severity of WSR is expressed as percentage leaf area diseased. 698. Plant Disease / Vol. 101 No. 5.
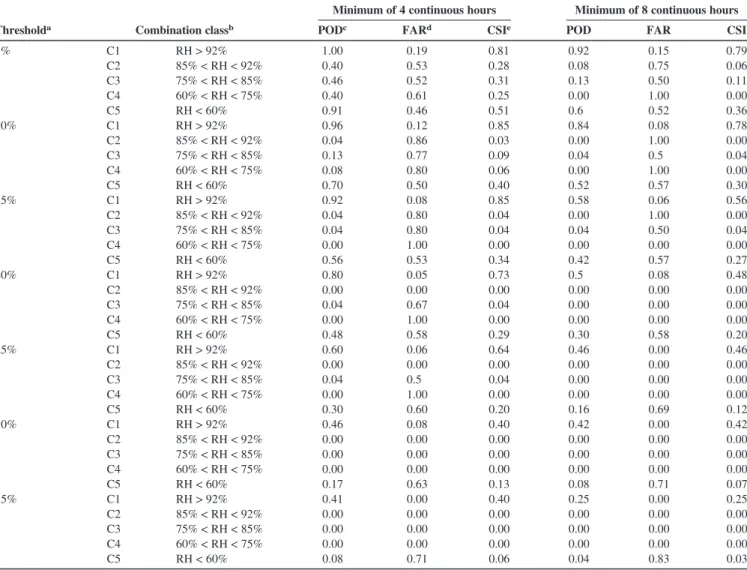
(7) Weather conditions conducive to infection by P. striiformis and wheat stripe rust in Luxembourg. The Monte Carlo simulation using daily weather data and the Dennis model showed that temperatures varying between 0 and 16°C associated with WP up to 30 h favored different severities of infection by P. striiformis (Fig. 4). Thus, although infection (percentage leaf area diseased) might generally be #20% when exposed to a WP #6 h, infection could be >60% with conditions of T < 14°C and a WP > 8 h, with the highest level of infection (>90%) occurring at 4°C < T < 12°C and a WP > 12 h (Fig. 4). The different classes of hourly T, RH, and R, which were then assessed and ranked over each dekad during the May-June period, are presented in Table 2. For Burmerange, the period was extended to April because summer-like conditions often occur early at that site. Figure 5 gives the frequencies of each class of meteorological variable based on hourly time data used for the modeling approach (1999 to 2001), along with the observed disease severity (percentage of leaf diseased). At all sites, the predominant temperature classes were 4°C < T < 16°C and 8°C < T < 16°C. Frequencies of the first class in 1999 to 2001 during the May-June dekads ranged from 27 to 90%, 37 to 92%, and 36 to 93% for Burmerange, Christnach, and Everlange, respectively (Fig. 5). The respective average values. were 59%, 65%, and 63% (average values for the second class were 45%, 54%, and 55%, for Burmerange, Christnach, and Everlange, respectively). At all sites, frequency of temperatures between 8°C and 12°C and T > 16°C did not exceed 47% and 36%, respectively (Fig. 5). Temperatures <4°C were rare during the May-June dekads (temperature <4°C were only recorded in April at Burmerange). The predominant RH class for the dekads in May-June was RH >80%, followed by RH >92% at Christnach and Everlange. The frequencies varied between 27 and 73%, and 2 and 47%, respectively (Fig. 5). At Burmerange, the prevailing RH were >80% and 60% < RH < 75% (average respective frequencies of 30% and 27%). The frequency of RH > 92% was not greater than 20% over the 1999 to 2001 period. In the dekads when WSR was observed at all sites, the frequencies of RH > 80% and RH > 92% were the highest. Irrespective of the site, periods without rain or rain # 0.1 mm were the most frequent during periods conducive to infection with P. striiformis (Fig. 5). Hence, from 1999 to 2001, weather conditions of 4°C < T < 16°C, RH > 92%, and R # 0.1 mm were most strongly associated with infection periods of P. striiformis at the dekadal scale. Test and evaluation of the threshold-based weather model for WSR (1999-2001). Results from the Monte Carlo simulation suggested that persisting favorable weather conditions over uninterrupted hours. Table 3. Probability of detection (POD), false alarm ratio (FAR), and critical success index (CSI) of prediction of infection of winter wheat by Puccinia striiformis during the 1999 to 2001 cropping seasons in Luxembourg. Data for occurrence of WSR for all three study sites were pooled Minimum of 4 continuous hours Thresholda 5%. 10%. 15%. 20%. 25%. 30%. 35%. PODc. FARd. CSIe. POD. FAR. CSI. RH > 92% 85% < RH < 92% 75% < RH < 85% 60% < RH < 75% RH < 60% RH > 92% 85% < RH < 92% 75% < RH < 85% 60% < RH < 75% RH < 60% RH > 92% 85% < RH < 92% 75% < RH < 85% 60% < RH < 75% RH < 60% RH > 92% 85% < RH < 92% 75% < RH < 85% 60% < RH < 75% RH < 60% RH > 92% 85% < RH < 92% 75% < RH < 85% 60% < RH < 75% RH < 60% RH > 92% 85% < RH < 92% 75% < RH < 85% 60% < RH < 75% RH < 60% RH > 92% 85% < RH < 92% 75% < RH < 85% 60% < RH < 75% RH < 60%. 1.00 0.40 0.46 0.40 0.91 0.96 0.04 0.13 0.08 0.70 0.92 0.04 0.04 0.00 0.56 0.80 0.00 0.04 0.00 0.48 0.60 0.00 0.04 0.00 0.30 0.46 0.00 0.00 0.00 0.17 0.41 0.00 0.00 0.00 0.08. 0.19 0.53 0.52 0.61 0.46 0.12 0.86 0.77 0.80 0.50 0.08 0.80 0.80 1.00 0.53 0.05 0.00 0.67 1.00 0.58 0.06 0.00 0.5 1.00 0.60 0.08 0.00 0.00 0.00 0.63 0.00 0.00 0.00 0.00 0.71. 0.81 0.28 0.31 0.25 0.51 0.85 0.03 0.09 0.06 0.40 0.85 0.04 0.04 0.00 0.34 0.73 0.00 0.04 0.00 0.29 0.64 0.00 0.04 0.00 0.20 0.40 0.00 0.00 0.00 0.13 0.40 0.00 0.00 0.00 0.06. 0.92 0.08 0.13 0.00 0.6 0.84 0.00 0.04 0.00 0.52 0.58 0.00 0.04 0.00 0.42 0.5 0.00 0.00 0.00 0.30 0.46 0.00 0.00 0.00 0.16 0.42 0.00 0.00 0.00 0.08 0.25 0.00 0.00 0.00 0.04. 0.15 0.75 0.50 1.00 0.52 0.08 1.00 0.5 1.00 0.57 0.06 1.00 0.50 0.00 0.57 0.08 0.00 0.00 0.00 0.58 0.00 0.00 0.00 0.00 0.69 0.00 0.00 0.00 0.00 0.71 0.00 0.00 0.00 0.00 0.83. 0.79 0.06 0.11 0.00 0.36 0.78 0.00 0.04 0.00 0.30 0.56 0.00 0.04 0.00 0.27 0.48 0.00 0.00 0.00 0.20 0.46 0.00 0.00 0.00 0.12 0.42 0.00 0.00 0.00 0.07 0.25 0.00 0.00 0.00 0.03. Combination C1 C2 C3 C4 C5 C1 C2 C3 C4 C5 C1 C2 C3 C4 C5 C1 C2 C3 C4 C5 C1 C2 C3 C4 C5 C1 C2 C3 C4 C5 C1 C2 C3 C4 C5. Minimum of 8 continuous hours. classb. a. The threshold refers to the frequency of each class of combined weather variables over a dekad during May-June. For example, for all cases where 5% of weather class C1 were observed during a given dekad of May-June, the predicted and observed disease infection events during that period were used to calculate the POD, FAR, and CSI values. b All the classes of combined weather variables are composed of 4°C < temperature < 16°C, rain #0.1 mm, and relative humidity (RH) as defined in the table. c POD, probability of detection, is the probability to forecast correctly the observed event. It ranges between 0 and 1. Perfect score = 1. d FAR, false alarm ratio, is the number of times an event is forecast but is not observed, divided by the total number of forecasts of that event. Perfect score = 0. e CSI, critical success index, takes into account both false alarms and missed events (ranged between 0 and 1). Perfect score = 1. Plant Disease / May 2017. 699.
(8) were important for development of WSR. Thus, the proportions of the optimum class of T (i.e., 4°C < T < 16°C) associated with each of the classes of RH (Table 2) and R # 0.1 mm during minimum consecutive 4 h or 8 h periods were analyzed along with the observed severity of WSR for each dekad during the May-June period (Supplementary Fig. S1). We denote C1-C5 as the class of combined weather variables 4°C < T < 16°C and R # 0.1 mm associated with, respectively, RH > 92% (C1), 85% < RH < 92% (C2), 75% < RH < 85% (C3), 60% < RH < 75% (C4), and RH < 60% (C5). Next, the frequency of each class of combined weather variables over the dekad. was determined and sorted according to different thresholds (i.e., 5 to 35%, in 5% steps). Scores of the contingency table were calculated and assessed according to these thresholds. For instance, for all cases where 5% of weather class C1 were observed during a given dekad of May-June, the predicted and observed infection events during that period were used to calculate the POD, FAR, and CSI values (Table 3). The best thresholds are those with POD and CSI values close to 1, and FAR values close to 0. Overall, lower CSI and POD values were obtained for all classes at thresholds >20% (compared with thresholds <20%), regardless of the category of consecutive hours. Conversely,. Fig. 6. Example of simulated wheat leaf rust (WSR) infection events, and observed green leaf area (GLA) and severity of WSR on the three upper leaves (L3 to L1, L1 being flag leaf) at Burmerange during the 2015 cropping season. The severity of WSR is expressed as percentage leaf area diseased. 700. Plant Disease / Vol. 101 No. 5.
(9) at thresholds <15%, all classes had the highest FAR values, except C5. At thresholds $20%, infection events by P. striiformis were poorly simulated based on weather conditions defined in the C2 to C4 classes (POD and CSI were very close to, or equal to 0; Table 3), irrespective of the category of consecutive hours. The class with the highest scores in both category of consecutive hours and for each of the thresholds was C1 (which is the optimum class found previously). This result confirms simulations of infection by P. striiformis based on the combined weather variables 4°C < T < 16°C, RH > 92%, and R # 0.1 mm, and resulted in the most accurate predictions. But even for C1, the values of FAR diminished as the threshold increased (0.19 to 0.00, and 0.15 to 0.00 at 5 to 35% thresholds for minimum periods of 4 h and 8 h, respectively; Table 3). The most accurate simulations based on infection periods for prediction of infection by P. striiformis and subsequent development of WSR using C1 were found at the 15% or 20% threshold during a minimum of 4 h consecutive period over the dekad. Model performance during the 2002 to 2015 cropping seasons. The threshold-based model for development of WSR was evaluated using the independent data from 2002 to 2015. Infection days and latency periods for P. striiformis were calculated based on periods when the combined favorable weather variables (4°C < T < 16°C, RH > 92%, and R # 0.1 mm) were met. An example of the development of the three upper leaves, along with the simulated WSR infection events and progress, is depicted in Figure 6. The performance of the model for predicting infection events by P. striiformis on L3 to L1 is presented (Table 4 and Supplementary Table S2). Overall, occurrence of WSR was predicted accurately by the model at all sites, with POD values ranging from 0.91 to 1.00 (Table 4). Relatively high FAR values (>0.25), associated with CSI # 0.70, were found in 2002 and 2010 at Burmerange, and 2007 and 2011 at Christnach (no FAR values >0.20 were found at Everlange). Interestingly in years when epidemics of WSR occurred (i.e., 2012 to 2015 at Burmerange and Christnach; 2002, 2009, and 2013 to 2015 at Everlange; Fig. 3), the weather threshold-based model provided excellent prediction on average, with POD and CSI values $0.90, and FAR values #0.10. Exceptions were the CSI and FAR values in 2013 and 2015 at Everlange (FAR = 0.20 and 0.15, CSI = 0.80 and 0.85, respectively, Table 4).. Discussion During plant disease development, interactions between weather variables and the pathogen and host determine whether infection process occurs successfully, and whether the disease develops to a destructive epidemic level that may cause significant economic loss. We explored a threshold-based weather modeling approach for predicting WSR on winter wheat in representative wheat-growing regions across Luxembourg. We emphasized the combined effect of T, RH, and R conducive to infection of wheat by P. striiformis during continuous hours over the critical period for development of WSR at selected sites. Over each dekad during May-June in each season, results showed that a combination of RH > 92% and 4°C < T < 16°C for a minimum of 4 continuous hours, associated with R # 0.1 mm (with the dekad having these conditions for 5 to 20% of the time), were optimum conditions conducive to development of WSR. This is consistent with previous findings where optimum T values ranging from 5 to 15°C, associated with the presence of free water on the leaf, were found necessary for the development of WSR (Dennis 1987; de Vallavieille-Pope et al. 1995, 2000; Rapilly 1979). Regarding the duration of such optimum weather conditions, Rapilly (1979) noted that the germination of P. striiformis spores require RH near saturation for at least 3 h. Dennis (1987) showed that WP from 3 h at 7 to 10°C to 6 h at 15°C were conducive to infection by the Australian race of P. striiformis 104E137A+. Likewise, de Vallavieille-Pope et al. (1995) found that a minimum continuous dew period necessary for P. striiformis penetration was 4 to 6 h. The conclusions of all these previous studies were based on experiments carried out in laboratory conditions (i.e., controlled). In the present study, experiments were conducted under field conditions (i.e., uncontrolled). The differences we found compared with these previously reported results can be explained by the uncontrolled field conditions (e.g., time. of inoculation, amount of inoculum, low infection efficiency, etc.). Indeed, in controlled conditions, the amount of light (intensity × duration) can enhance the infection efficiency of P. striiformis (de Vallavieille-Pope et al. 2000). Neither the infection efficiency of P. striiformis nor the impact of solar radiation on the development of WSR in field conditions were investigated in this study. As such, integrating information related to the quantity of inoculum of P. striiformis within the disease forecast area (with spore traps for instance) or information related to the infection efficiency in field conditions will improve the overall performance of the model. High inoculum loads of P. striiformis might increase the risk of severe epidemics during the cropping season, if weather conditions are conducive. Several wheat cultivars with low to relatively high susceptibility were sown during the study period, with a resulting range in incidence and severity of WSR. Although a single cultivar (Flair) was sown in 1999 to 2001 at all sites, the disease severity was significantly different between sites (P < 0.001) and years (P < 0.001). This confirms, in part, that the difference between sites was linked to weather conditions. During the 2012 to 2015 period, epidemics of WSR occurred at all sites. At Burmerange and Christnach (and to a lesser extent at Everlange), there were nine cropping seasons (2003 to 2011) with very low severity of WSR. The previously widespread low disease severity might be explained by presence of the existing pathotype (Yr17) during that time, which subsequently overcame the resistance to WSR in those wheat cultivars planted in Luxembourg and that were previously resistant (Yr17+) during the same period (El Jarroudi et al. 2011). During the 2012 to 2015 seasons, there were WSR epidemics in experiments involving Yr17 wheat cultivars. It is possible that a new race of P. striiformis could have caused more severe WSR epidemics on wheat cultivars with a range of susceptibility to the disease. Indeed, in 2011, a new race of P. striiformis, named ‘Warrior’, was detected in different European countries including France, Germany, and the U.K. (http://wheatrust.org/; Hovmøller et al. 2015). Since urediniospores of P. striiformis can spread over large distances (Hovmøller et al. 2002), the race Warrior is probably present in Luxembourg. Confirming the existence of Warrior in commercial Luxembourgish wheat fields was not part of this study. Nevertheless, our threshold-based weather model still accurately predicted infection events by the Warrior race of P. striiformis (if its occurrence in Luxembourg is confirmed) over the 2012 to 2015 period, with FAR # 0.20, and POD and CSI ranging from 0.91 to 1, and 0.85 to 1, respectively. The assessments of weather-based models for predicting infection by P. striiformis and WSR severity in wheat in North America Table 4. Performance of the threshold-based weather model to predict the development of WSR at the study sites during the 2002 to 2015 cropping seasons Burmerange. Christnach. Everlange. Year. PODa. FARb. CSIc. POD. FAR. CSI. POD. FAR. CSI. 2003 2004 2005 2006 2007 2008 2009 2010 2011 2012 2013 2014 2015. 1 1 1 1 1 1 1 1 1 1 1 0.94 0.91. 0.20 0.25 0.22 0.25 0.33 0.17 0.27 0.38 0.17 0.04 0.10 0 0. 0.80 0.75 0.78 0.75 0.67 0.83 0.73 0.63 0.83 0.95 0.90 0.94 0.91. 1 1 1 1 1 1 1 1 1 1 1 0.94 1. 0.18 0.14 0 0 0.27 0 0.25 0.13 0.33 0.06 0.08 0 0. 0.82 0.86 1 1 0.70 1 0.75 0.88 0.67 0.94 0.92 0.94 1. 1 1 1 1 1 1 1 1 1 1 1 1 1. 0.14 0.11 0.17 0.11 0.18 0.20 0.09 0.14 0.17 0.11 0.20 0.09 0.15. 0.86 0.89 0.83 0.89 0.82 0.80 0.91 0.86 0.83 0.89 0.80 0.91 0.85. a. POD, probability of detection, is the probability to forecast correctly the observed event. It ranges between 0 and 1. Perfect score = 1. b FAR, false alarm ratio, is the number of times an event is forecast but is not observed, divided by the total number of forecasts of that event. Perfect score = 0. c CSI, critical success index, takes into account both false alarms and missed events (ranged between 0 and 1). Perfect score = 1. Plant Disease / May 2017. 701.
(10) (Coakley et al. 1988; Eddy 2009) or China (Luo and Zeng 1995) showed that accuracy level ranged from 76 to 96%. Studies on risk of infections of wheat by P. triticina (causing leaf rust) in Luxembourg showed that the infection events were simulated with POD, FAR, and CSI values ranging from 0.95 to 1, 0.06 to 0.20, and 0.80 to 0.94, respectively, based on hourly weather data (El Jarroudi et al. 2014a, b). The overall performance of the threshold-based weather model developed in this study is quite similar to that developed for wheat leaf rust across the same geographical region. Although the findings are area-specific and may differ in other geographic locations, the underlying hypothesis and approach can be extended to different locations and/or explored for other economically important fungal diseases of other crops. In fields, disease progress depends on contrasting weather and topoclimatic factors that can influence prevalence of the disease and its impacts on final yield. Managing that disease progress with fungicides is required to mitigate adverse effects on yield. The thresholdbased weather model for WSR development evaluated in this study shows encouraging performance and is being adopted as part of a larger decision support system for managing the main fungal diseases in winter wheat across Luxembourg (El Jarroudi et al. 2012, 2015). Efforts are being taken to better define thresholds of disease severity for fungicide application. Disease impact on yield will aid definition of a threshold for fungicide application that is both economically and environmentally optimal. Integrated into a decision support or expert systems, such disease infection risk model, can be used to manage the disease and mitigate its adverse effects on yield.. Acknowledgments We are thankful to Guy Reiland (Lyc´ee Technique Agricole, Ettelbruck) for the valuable information about Luxembourgish cereals crop management. We are also grateful to Marco Beyer, Abdeslam Mahtour, Christophe Mackels, Virginie Schyns, Bertrand Martin, Bernard Tychon, Lucien Hoffmann, Guy Reiland, Farid Traor´e, Michel Noel, Fr´ed´eric Giraud, Carine Vrancken, Friederike Pogoda, Guy Mirgain, Marc Kails, and Alexandre Nuttens for their technical support in data collection. Any use of trade, firm, or product names is for descriptive purposes only and does not imply endorsement by the U.S. Government.. Literature Cited ¨ uchte, Leguminosen BSA. 2008. Beschreibende Sortenliste 2008. Getreide, Mais, Olfr¨ (großk¨ornig) Hackfr¨uchte (außer Kartoffeln). Deutscher Landwirtschaftsverlag GmbH., Hannover. ¨ uchte, Leguminosen BSA. 2016. Beschreibende Sortenliste 2016. Getreide, Mais, Olfr¨ (großk¨ornig) Hackfr¨uchte (außer Kartoffeln). Deutscher Landwirtschaftsverlag GmbH., Hannover. Coakley, S. M., Line, R. F., and McDaniel, L. R. 1988. Predicting stripe rust severity on winter wheat using an improved method for analyzing meteorological and rust data. Phytopathology 78:543-550. Crown, M. D. 2012. Validation of the NOAA Space Weather Prediction Center’s solar flare forecasting look-up table and forecaster-issued probabilities. Space Weather 10:S06006. de Vallavieille-Pope, C., Giosue, S., Munk, L., Newton, A. C., Niks, R. E., Østerg˚ard, H., Pons-k¨uhnemann, J., Rossi, V., and Sache, I. 2000. Assessment of epidemiological parameters and their use in epidemiological and forecasting models of cereal airborne diseases. Agron. Sustain. Dev. 20:715-727. de Vallavieille-Pope, C., Huber, L., Leconte, M., and Goyau, H. 1995. Comparative effects of temperature and interrupted wet periods on germination, penetration and infection of Puccinia recondita f.sp. tritici and P. striiformis on wheat seedlings. Phytopathology 85:409-415. Dennis, J. I. 1987. Temperature and wet-period conditions for infection by Puccinia striiformis f.sp. tritici race 104E137A +. Trans. Br. Mycol. Soc. 88: 119-121. Eddy, R. 2009. Logistic regression models to predict stripe rust infections on wheat and yield response to foliar fungicide application on wheat in Kansas. Master of Science Thesis, Kansas State University. El Jarroudi, M., Delfosse, P., Maraite, H., Hoffmann, L., and Tychon, B. 2009. Assessing the accuracy of simulation model for Septoria leaf blotch disease progress on winter wheat. Plant Dis. 93:983-992. El Jarroudi, M., Giraud, F., Tychon, B., Hoffmann, L., and Delfosse, P. 2011. First report of the breakdown of the Yr17 resistance gene to wheat stripe rust in the Grand-Duchy of Luxembourg. J. Plant Pathol. 93:243. El Jarroudi, M., Kouadio, L., Beyer, M., Junk, J., Hoffmann, L., Tychon, B., Maraite, H., Bock, C. H., and Delfosse, P. 2015. Economics of a decision–support system for managing the main fungal diseases of winter wheat in the Grand-Duchy of Luxembourg. Field Crops Res. 172:32-41. El Jarroudi, M., Kouadio, L., Delfosse, P., Giraud, F., Junk, J., Hoffmann, L., Maraite, H., and Tychon, B. 2012. Typology of the main fungal diseases. 702. Plant Disease / Vol. 101 No. 5. affecting winter wheat in the Grand Duchy of Luxembourg. J. Agric. Sci. Technol. A 2:1386-1399. El Jarroudi, M., Kouadio, L., Delfosse, P., and Tychon, B. 2014a. Brown rust disease control in winter wheat: I. Exploring an approach for disease progression based on night weather conditions. Environ. Sci. Pollut. Res. 21: 4797-4808. El Jarroudi, M., Kouadio, L., Giraud, F., Delfosse, P., and Tychon, B. 2014b. Brown rust disease control in winter wheat: II. Exploring the optimization of fungicide sprays through a decision support system. Environ. Sci. Pollut. Res. 21:4809-4818. Geagea, L., Huber, L., and Sache, I. 1999. Dry-dispersal and rain-splash of brown (Puccinia recondita f.sp. tritici) and yellow (P. striiformis) rust spores from infected wheat leaves exposed to simulated raindrops. Plant Pathol. 48:472-482. Geagea, L., Huber, L., Sache, I., Flura, D., McCartney, H. A., and Fitt, B. D. L. 2000. Influence of simulated rain on dispersal of rust spores from infected wheat seedlings. Agric. For. Meteorol. 101:53-66. Hovmøller, M. S., Justesen, A. F., and Brown, J. K. M. 2002. Clonality and longdistance migration of Puccinia striiformis f.sp. tritici in north-west Europe. Plant Pathol. 51:24-32. Hovmøller, M. S., Sørensen, C. K., Walter, S., and Justesen, A. F. 2011. Diversity of Puccinia striiformis on cereals and grasses. Annu. Rev. Phytopathol. 49: 197-217. Hovmøller, M. S., Walter, S., Bayles, R. A., Hubbard, A., Flath, K., Sommerfeldt, N., Leconte, M., Czembor, P., Rodriguez-Algaba, J., Thach, T., Hansen, J. G., Lassen, P., Justesen, A. F., Ali, S., and de Vallavieille-Pope, C. 2015. Replacement of the European wheat yellow rust population by new races from the centre of diversity in the near-Himalayan region. Plant Pathol. 65: 402-411. Huber, L., and Gillespie, T. J. 1992. Modeling leaf wetness in relation to plant disease epidemiology. Annu. Rev. Phytopathol. 30:553-577. Jin, Y., Szabo, L. J., and Carson, M. 2010. Century-old mystery of Puccinia striiformis life history solved with the identification of Berberis as an alternate host. Phytopathology 100:432-435. Johansen, A. M. 2010. Monte Carlo Methods. Pages 296-303 in: International Encyclopedia of Education (Third Edition). P. L. Peterson, E. L. Baker, and B. McGraw, eds. Elsevier, Oxford, U.K. Junk, J., G¨orgen, K., El Jarroudi, M., Delfosse, P., Pfister, L., and Hoffmann, L. 2008. Operational application and improvements of the disease risk forecast model PROCULTURE to optimize fungicides spray for the Septoria leaf blotch disease in winter wheat in Luxembourg. Adv. Sci. Res. 2:57-60. Junk, J., Kouadio, L., Delfosse, P., and Jarroudi, M. 2016. Effects of regional climate change on brown rust disease in winter wheat. Clim. Change 135: 439-451. Justesen, A. F., Ridout, C. J., and Hovmøller, M. S. 2002. The recent history of Puccinia striiformis f.sp. tritici in Denmark as revealed by disease incidence and AFLP markers. Plant Pathol. 51:13-23. Krause, R. A., and Massie, L. B. 1975. Predictive systems: Modern approaches to disease control. Annu. Rev. Phytopathol. 13:31-47. L’Ecuyer, P. 1996. Combined multiple recursive random number generators. Oper. Res. 44:816-822. Larue, S. 2012. Location of agricultural production in 1962 and 2009: a comparison of Luxembourgish “cantons”. STATEC, Institut national de la statistique et des e´ tudes e´ conomiques. Available: http://www.statistiques. public.lu/en/publications/series/luxembourg/2012/16-12/index.html. Accessed 1 August 2016. Lemaire, D., Huret, S., Calay, F., and Maraite, H. 2002. Understanding Puccinia striiformis West. epidemics on winter wheat. Meded Rijksuniv Gent Fak Landbouwkd Toegep Biol Wet 67:251-256. Line, R. F. 2002. Stripe rust of wheat and barley in North America: A retrospective historical review. Annu. Rev. Phytopathol. 40:75-118. Luo, Y., Shen, Z. R., and Zeng, S. M. 1993. Risk analysis of disease epidemics on wheat by simulation studies. Agric. Syst. 43:67-89. Luo, Y., and Zeng, S. M. 1995. Simulation studies on epidemics of wheat stripe rust (Puccinia striiformis) on slow-rusting cultivars and analysis of effects of resistance components. Plant Pathol. 44:340-349. Lupton, F. G. H. 1972. Further experiments on photosynthesis and translocation in wheat. Ann. Appl. Biol. 71:69-79. Magarey, R. D., Sutton, T. B., and Thayer, C. L. 2005. A simple generic infection model for foliar fungal plant pathogens. Phytopathology 95:92-100. Mahtour, A., El Jarroudi, M., Delobbe, L., Hoffmann, L., Maraite, H., and Tychon, B. 2011. Site-specific Septoria leaf blotch risk assessment in winter wheat using weather-radar rainfall estimates. Plant Dis. 95:384-393. MAVCP. 2016. Luxembourgish agriculture: Facts and figures 2016. Ministry of Service of rural economy, Ministry of Agriculture, Viticulture and Consumer Protection (MAVCP). Available: http://www.ser.public.lu/publikationen/ Landwirtschaft_in_Luxbg/lux_landw_zahl_en.pdf. Accessed 1 August 2016. MAVPC. 2015. Rapport d’activit´e 2015. Minist`ere de l’Agriculture, de la Viticulture et de la Protection des consommateurs (MAVPC). Available: http://www.ma.public.lu/ministere/rapport/Rapport-d_activite-2015-Min_AgricultureCTIE.pdf. Accessed 1 August 2016. Muralidhar, K. 2003. Pages 193-201 in: Monte Carlo Simulation. Encyclopedia of Information Systems. H. Bidgoli, ed. Elsevier, New York..
(11) Pasquali, M., Komjati, H., Lee, D., and Bayles, R. 2010. SRAP technique efficiently generates polymorphisms in Puccinia striiformis isolates. J. Phytopathol. 158:708-711. Paveley, N. D., Lockley, D., Vaughan, T. B., Thomas, J., and Schmidt, K. 2000. Predicting effective fungicide doses through observation of leaf emergence. Plant Pathol. 49:748-766. R Core Team. 2015. R: A language and environment for statistical computing. R Foundation for Statistical Computing, Vienna, Austria. http://www.R-project.org/. Rapilly, F. 1979. Yellow rust epidemiology. Annu. Rev. Phytopathol. 17:59-73. Reinink, K. 1986. Experimental verification and development of EPIPRE, a supervised disease and pest management system for wheat. Eur. J. Plant Pathol. 92:3-14. Rodriguez-Algaba, J., Walter, S., Sørensen, C. K., Hovmøller, M. S., and Justesen, A. F. 2014. Sexual structures and recombination of the wheat rust fungus Puccinia striiformis on Berberis vulgaris. Fungal Genet. Biol. 70:77-85. Rowlandson, T., Gleason, M., Sentelhas, P., Gillespie, T., Thomas, C., and Hornbuckle, B. 2015. Reconsidering leaf wetness duration determination for plant disease management. Plant Dis. 99:310-319. Sache, I. 2000. Short-distance dispersal of wheat rust spores. Agronomie 20: 757-767. Sache, I., and de Vallavieille-Pope, C. 1993. Comparison of the wheat brown and yellow rusts for monocyclic sporulation and infection processes, and their polycyclic consequences. J. Phytopathol. 138:55-65. STATEC. 2000. Bulletin du STATEC, N° 3/2001 Le recensement agricole 2000. Aspects de l’agriculture en 2000. STATEC, Statistics portal of the Grand-Duchy of Luxembourg. Available: http://www.statistiques.public.lu/en/publications/series/ bulletin-statec/2001/03-01-recens-agri/index.html. Accessed 1 August 2016. Teng, P. S. 1983. Estimating and interpreting disease intensity and loss in commercial fields. Phytopathology 73:1587-1590. Tian, Y., Zhan, G., Chen, X., Tungruentragoon, A., Lu, X., Zhao, J., Huang, L., and Kang, Z. 2016. Virulence and simple sequence repeat marker segregation. in a Puccinia striiformis f. sp. tritici population produced by selfing a Chinese isolate on Berberis shensiana. Phytopathology 106:185-191. Tomerlin, J. R., and Howell, A. 1988. DISTRAIN: a computer program for training people to estimate disease severity on cereal leaves. Plant Dis. 72:455-459. Van den Bosch, F., Frinking, H. D., Metz, J. A. J., and Zadoks, J. C. 1988. Focus expansion in plant disease III: Two experimental examples. Phytopathology 78: 919-925. Verreet, J. A., Klink, H., and Hoffmann, G. M. 2000. Regional monitoring for disease prediction and optimization of plant protection measuares: The IPM wheat model. Plant Dis. 84:816-826. Wellings, C. R., and McIntosh, R. A. 1990. Puccinia striiformis f.sp. tritici in Australasia: pathogenic changes during the first 10 years. Plant Pathol. 39: 316-325. Wilks, D. S., and Shen, K. W. 1991. Threshold relative humidity duration forecasts for plant disease prediction. J. Appl. Meteorol. 30:463-477. Young, C. S., Paveley, N. D., Vaughan, T. B., Thomas, J. M., and Lockley, K. D. 2003. Predicting epidemics of yellow rust (Puccinia striiformis) on the upper canopy of wheat from disease observations on lower leaves. Plant Pathol. 52: 338-349. Zadoks, J. C. 1971. Systems analysis and the dynamics of epidemics. Phytopathology 61:600-610. Zadoks, J. C. 1985. On the conceptual basis of crop loss assessment: The threshold theory. Annu. Rev. Phytopathol. 23:455-473. Zadoks, J. C., Chang, T. T., and Konzak, C. F. 1974. A decimal code for the growth stages of cereals. Weed Res. 14:415-421. Zhao, J., Wang, L., Wang, Z., Chen, X., Zhang, H., Yao, J., Zhan, G., Chen, W., Huang, L., and Kang, Z. 2013. Identification of eighteen Berberis species as alternate hosts of Puccinia striiformis f. sp. tritici and virulence variation in the pathogen isolates from natural infection of barberry plants in China. Phytopathology 103:927-934.. Plant Disease / May 2017. 703.
(12)
Figure

+5


Documents relatifs
The United Kingdom Cereal Pathogen Virulence Survey (UKCPVS) is funded by HGCA and Fera. If you wish to attend please contact Emily Bennett at HGCA by
Combining remote sensing applications and dynamic simulation models has been explored in several studies (Bouman, 1991; Van Leeuwen, 1996; Clevers et al., 2002; Prévot et al.,
Leaf area development Percentage of the leaf area covered by sporulating S.tritici (Pink: Primary infection, red: secondary infection). Logarithmic
France allows double voting rights for long-term investors, but their role is different and their impact limited, as our robustness results for double voting rights show (see
( ةداملا تصن 9 ماظنلا نم ) و ةاضقلا ىلع ةمكحملل يساسلأا نوكي ثيحب مهنييعت ا و درجتلا اتفص مهيف رفاوتت ةاضقل لخ ىلع اصاخشأ نوكي نأو ةهازنلا
Using a joint growth-mortality modeling framework, we show that water stress had a negative impact on growth rate, while the impact of logging was positive for the majority of
To possess a SCM behavior the molecular system must satisfy three key parameters: (i) its magnetic anisotropy must be uni-axial and large, (ii) efficient exchange
The author builds upon the merits of both top-down and bottom-up approaches and suggests an alternate KC flowdown method named process-to-and-from-design (PTFD). This
