Accuracy control risk management for modular submarine hull construction
Texte intégral
Figure
![Figure 1: KC Flowdown Diagram [Thornton 1999b]](https://thumb-eu.123doks.com/thumbv2/123doknet/13827076.443009/17.918.178.746.123.630/figure-kc-flowdown-diagram-thornton-b.webp)
![Figure 5: Process Capability Assessment [adapted from Liggett 1993]](https://thumb-eu.123doks.com/thumbv2/123doknet/13827076.443009/24.918.193.794.125.547/figure-process-capability-assessment-adapted-liggett.webp)
![Figure 6: KC Flowdown Diagram [Thornton 1999b]](https://thumb-eu.123doks.com/thumbv2/123doknet/13827076.443009/33.918.176.746.118.636/figure-kc-flowdown-diagram-thornton-b.webp)
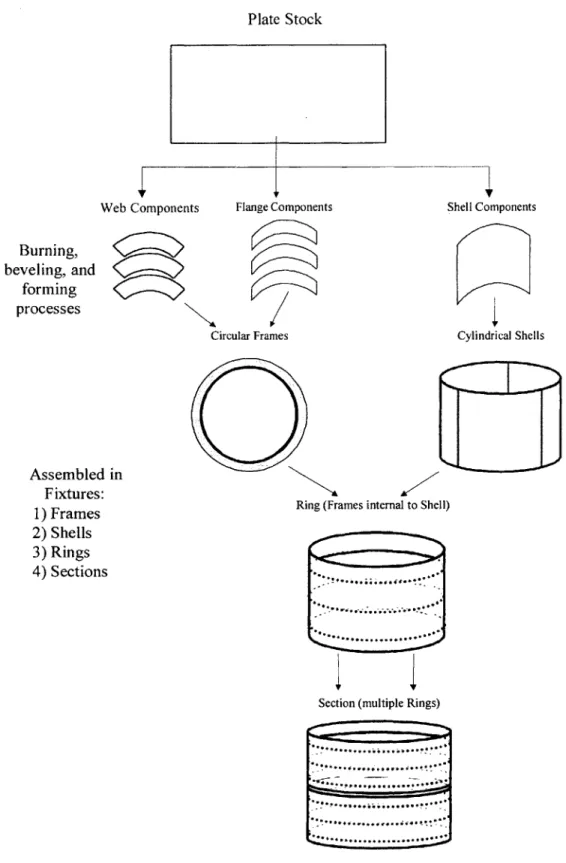
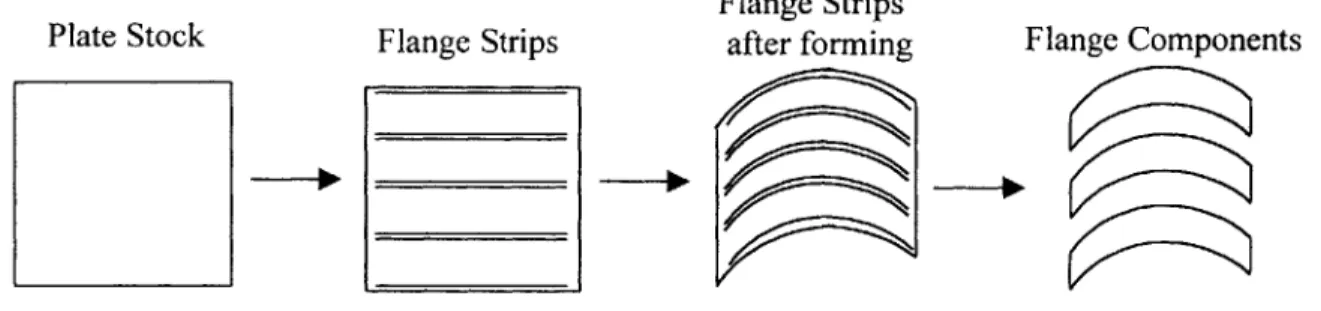
![Figure 7: Typical KC Process [Thornton 1999b]](https://thumb-eu.123doks.com/thumbv2/123doknet/13827076.443009/38.918.224.747.137.597/figure-typical-kc-process-thornton-b.webp)
Documents relatifs
Figure 7: Example word recognition results on challenging images from the SVT dataset [29] using the node-specific lexicon prior. Our method handles many different fonts,
In this study, we investigated whether: (i) the identity of fungal species would affect shredder consumption rates (bottom-up effects) and (ii) the preferences of shredders
Time-series of detrended annual NBP anom for the globe (a) and tropical regions (b), estimated as the residual sink by GCB2017 (black, globe only), CAMS v16r1 (blue),
We found that resource availability and predation risk, that is, the perceived presence of a predator based on chemical, visual and/or auditory cues, impacted emigration
Un signal GPS comporte trois composantes principales dont le message de navigation n(t) qui est un signal en bande de base contenant les informations nécessaires au récepteur pour
With added purification only small improvements in performance are obtained for the development and GE datasets (8% and 12% relative improve- ments respectively), indicating once
From ESI mass spectra of the ppD4 THF extract (25% w/w) it was found that plasma‐polymerization of D4 had produced cyclolinear polysiloxanes described as
Ex- perimental results confirm that clusters produced through top-down clustering are better normalized against phone variation than those produced through bottom-up clustering and
