To link to this article : DOI : 10.1145/2739051 Official URL: http://dx.doi.org/10.1145/2739051
To cite this version : Pellegrini, Thomas and Fontan, Lionel and Mauclair, Julie and Farinas, Jérôme and Alazard-Guiu, Charlotte and Robert, Marina and Gatignol, Peggy Automatic Assessment of Speech Capability Loss in Disordered Speech. (2015) ACM Transactions on Accessible Computing (TACCESS) - Special Issue on Speech and Language Processing for AT (Part 1), vol. 6 (n° 3). pp. 1-14. ISSN 1936-7228
O
pen
A
rchive
T
OULOUSE
A
rchive
O
uverte (
OATAO
)
OATAO is an open access repository that collects the work of Toulouse researchers and makes it freely available over the web where possible.This is an author-deposited version published in : http://oatao.univ-toulouse.fr/ Eprints ID : 15312
Any correspondence concerning this service should be sent to the repository administrator: staff-oatao@listes-diff.inp-toulouse.fr
Automatic Assessment of Speech Capability Loss
in Disordered Speech
THOMAS PELLEGRINI and LIONEL FONTAN, Universit´e de Toulouse; UPS; IRIT JULIE MAUCLAIR, Universit´e Paris Descartes; IRIT
J ´ER ˆOME FARINAS, Universit´e de Toulouse; UPS; IRIT
CHARLOTTE ALAZARD-GUIU, Universit´e de Toulouse; Octogone-Lordat MARINA ROBERT, Universit´e Paris Ouest, Paris, France
PEGGY GATIGNOL, Hˆopital de la Piti´e Salp´etri`ere
In this article, we report on the use of an automatic technique to assess pronunciation in the context of several types of speech disorders. Even if such tools already exist, they are more widely used in a different context, namely, Computer-Assisted Language Learning, in which the objective is to assess nonnative pronunciation by detecting learners’ mispronunciations at segmental and/or suprasegmental levels. In our work, we sought to determine if the Goodness of Pronunciation (GOP) algorithm, which aims to detect phone-level mispro-nunciations by means of automatic speech recognition, could also detect segmental deviances in disordered speech. Our main experiment is an analysis of speech from people with unilateral facial palsy. This pathology may impact the realization of certain phonemes such as bilabial plosives and sibilants. Speech read by 32 speakers at four different clinical severity grades was automatically aligned and GOP scores were computed for each phone realization. The highest scores, which indicate large dissimilarities with standard phone realizations, were obtained for the most severely impaired speakers. The corresponding speech subset was manually transcribed at phone level; 8.3% of the phones differed from standard pronunciations extracted from our lexicon. The GOP technique allowed the detection of 70.2% of mispronunciations with an equal rate of about 30% of false rejections and false acceptances. Finally, to broaden the scope of the study, we explored the correlation between GOP values and speech comprehensibility scores on a second corpus, composed of sentences recorded by six people with speech impairments due to cancer surgery or neurological disorders. Strong correlations were achieved between GOP scores and subjective comprehensibility scores (about 0.7 absolute). Results from both experiments tend to validate the use of GOP to measure speech capability loss, a dimension that could be used as a complement to physiological measures in pathologies causing speech disorders.
Authors’ addresses: T. Pellegrini, L. Fontan, J. Mauclair, and J. Farinas, Universit´e de Toulouse; UPS; IRIT, 118 Route de Narbonne, F-31062 Toulouse, France; emails: {thomas.pellegrini, lionel.fontan, julie.mauclair, jerome.farinas}@irit.fr; J. Mauclair, Universit´e Paris Descartes, Paris, France; C. Alazard-Guiu, Uni-versit´e de Toulouse; Octogone-Lordat, 5 all´ees Antonio-Machado, 31058 TOULOUSE Cedex 9; email: charlottealazard@gmail.com; M. Robert, Universit´e Paris Ouest, 200 Avenue R´epublique, 92001 Nanterre, France; email: marinarobert@gmail.com; P. Gatignol, Hˆopital de la Piti´e Salp´etri`ere, 47-83 boulevard de l’Hˆopital, 75651 Paris, France; email: peggy.gatignol@psl.aphp.fr.
1. INTRODUCTION
In speech disorders, an assessment of a person’s communication ability is often needed to complement clinical evaluations at the physiological level. However, assessment of speech abilities is very time-consuming, which does not necessarily fit clinical means for people’s evaluation. From this perspective, automatic tools constitute convenient solutions to gather information about each person’s speech impairments. Such tools have been developed and are broadly used in Computer-Assisted Language Learning (CALL) systems, with early works reported in the 1990s [Bernstein et al. 1990]. In order to evaluate nonnative pronunciation at the segmental level (individual error de-tection) and/or at the suprasegmental level (overall pronunciation assessment), these tools rely on Automatic Speech Recognition (ASR) techniques [Eskenazi 2009]. Con-cerning the individual error detection, several approaches are used to identify phoneme mispronunciations. They range from the analysis of raw recognition scores [Sevenster et al. 1998], likelihood ratios such as native-likeness, and Goodness of Pronunciation (GOP) to the definition of scores derived from classification methods such as linear dis-criminant analysis and the like [Strik et al. 2007]. Contrary to native-likeness scores, which rely on the comparison of speakers’ productions with nonnative acoustic models, the GOP algorithm makes use of only native phone models. The algorithm calculates a ratio representing the likelihood of a phone to be the realization of a specific phoneme in the target language [Witt 1999; Witt and Young 2000]. Since GOP scores solely rely on native phone models, their scope may not be limited to the assessment of foreign learner pronunciation skills, but rather to all kinds of nontypical speech productions, such as in speech disorders.
Within the past decade, a growing number of studies have shown that ASR-based measurement techniques could be used with success to assess the pronunciation skills in speakers with various impairments such as cleft lip and palate [Maier et al. 2009; Schuster et al. 2006], sequelae from head and neck surgery [Maier et al. 2010; Maier et al. 2009], or neurological disorders [Saz et al. 2009]. Within this framework, the techniques first developed for CALL applications may be of great interest [Popovici and Buic ˘a-Belciu 2012; Saz et al. 2010; Kitzin et al. 2009]. This work focuses on one of the most commonly encountered approaches in CALL, the GOP algorithm. Our first and main experiment deals with French speakers with unilateral facial palsy (UFP). UFP can result from trauma, infection, or tumors [Ljostad et al. 2005] and often causes artic-ulatory disorders that may greatly impact people’s communication abilities [Gatignol and Lamas 2004]. Despite this, in UFP, the severity of impairment is generally eval-uated through physical criteria only, such as with the House-Brackmann (H&B) scale [House and Brackmann 1985; Evans et al. 1989]. The H&B scale evaluates the degree to which people can activate their mouths, eyelids, and forehead muscles when exe-cuting voluntary or involuntary movements. It leads to a score ranging from grade I (normal facial activity) to grade VI (total palsy). The main questions that we addressed in this experiment were: Can the GOP algorithm be used to identify and characterize individual mispronunciations in the context of peripheral paralysis impairments? Are GOP scores consistent with clinical impairment grades as given by the H&B scale? If not, then a tool that computes pronunciation scores automatically would provide information complementary to the H&B grade of a person. One useful application, in our opinion, is the possibility to assess improvements in speech communication ability during rehabilitation.
To broaden the scope of the study, we explored the use of the GOP algorithm with other types of speech disorders. Indeed, as the nature of the speech signal may vary significantly from one pathology to another, the robustness of such an automatic tool should be studied by considering a set of cases as large and diversified as possible. We estimated correlations between mean GOP scores and speech comprehensibility scores on a second corpus, composed of sentences recorded by French speakers with speech disorders due to cancer surgery or to neurological disorders. Comprehensibility is centered on the “listener’s ability to interpret and understand the meaning of the speaker’s intended message” [Wilson and Spaulding 2010, p. 1544]. Since GOP scores bring information on how distinguishable a specific phone realization is, they may be strongly related to speech comprehensibility. The main hypothesis is that GOP scores will decrease, indicating better pronunciation at the phone level as a function of people’s comprehensibility.
In the present article, an overview of the GOP algorithm is given first. Sections 3 and 4 then describe the methodology and the UFP speech corpus used in this work, followed by a listening analysis of the corpus. Statistics on manual transcriptions at the phone level are then described. GOP experiments are reported and discussed in Section 7. Finally, the second exploratory study on GOP and disordered speech comprehensibility is reported in Section 8.
2. THE GOP ALGORITHM
To compute GOP scores on a given utterance, two phases are needed: (1) a free speech recognition phase and (2) a forced alignment phase. Without giving any information to the ASR system about the target sentence, the free speech recognition phase determines the most likely phone sequence matching the audio input (i.e., the output is that of a free phone loop recognizer). On the contrary, the forced alignment phase must provide the ASR system with the orthographic transcription of the input sentence. It then consists of forcing the system to align the speech signal with the expected phone sequence. For each phone realization aligned to the speech signal, a GOP score is calculated by taking the absolute value of the difference between the log-likelihood of the forced aligned phone and that of the phones freely recognized within the same time range.
In this work, we used the baseline implementation of the GOP algorithm, described in Witt [1999] and Witt and Young [2000]. For each phone realization p aligned to Op observations of a duration of NF( p), a GOP score is calculated as given in
Equation (1): by taking the absolute value of the ratio between the log-likelihood of the forced alignment phase p(Op|p) and the one of the free recognition phase
maxpath p(Op|path). Phone realizations vary in duration; hence, GOP is normalized by
the duration in number of observation frames NF( p). The forced aligned phone is taken as the reference in terms of phone boundaries. Several freely recognized phones often contribute to the denominator. When the freely recognized phone is the same as the ex-pected one, and when their boundaries also match, the GOP score is zero. Otherwise, the larger the GOP score is, the greater the probability of a mispronunciation. In order to de-cide whether a phone was mispronounced (“rejected”) or not (“accepted”), a global score threshold or several phone-specific thresholds need to be set on a development corpus.
GOP( p) = ¯ ¯ ¯ ¯ log µ p(Op|p)
maxpath p(Op|path)
¶ ∗ 1 NF( p) ¯ ¯ ¯ ¯ (1) 3. GENERAL PROCEDURE
As stated in the introduction, we report on two experiments. The first and main one consisted of applying and assessing the GOP algorithm on speech from speakers with UFP. First, a preliminary auditory analysis of the speech corpus was conducted in order
to identify pronunciation trends that could discriminate between speakers with several palsy severity grades. Second, the GOP algorithm was run over the corpus. The forced alignments were constrained by standard pronunciations taken from a lexicon of 62K French words. The aligned phone sequences were manually edited by two annotators with a solid background in phonetics and experience in transcribing speech in the context of French as a foreign language (FFL) teaching. Phones that were edited by the annotators differed from standard pronunciations and therefore were considered as mispronunciations. The resulting manual phone transcriptions were taken as ground-truth reference to quantify the pronunciation issues observed during the listening analysis, and also to assess the effectiveness of the GOP algorithm. In this study, we limited this manual effort to the group of most impaired speakers (grades V and VI UFP; cf. next section), since we expected more mispronunciations in this population. Furthermore, we made the assumption that all the phone sequences that aligned automatically for the control group (no pathology) were correct and then taken as phone realizations that the GOP algorithm should accept. We set phone-dependent GOP score thresholds by limiting the false rejection (FR) rate below 10% on the control group, as is common practice in CALL. We will also report results for the operating point where false rejection and acceptance rates are equal.
The second experiment is independent from the first one. Another speech corpus was used, composed of a variety of speech disorders different from UFP. Reaction times of listeners and speech comprehensibility scores were compared to GOP scores. Details on the procedure of this experiment are given in Section 8.
4. CORPUS DESCRIPTION
The experiments have been carried out on a subset of a read speech database recorded at the La Piti´e Salp´etri`ere Hospital in Paris, France. This database was used in previous studies [Robert et al. 2011; Mauclair et al. 2013]. It was collected from 32 French speakers with UFP at five different grades according to the House and Brackmann scale, namely, grades I, III, IV, V, and VI. Speakers were aged from 24 to 73 years (mean = 47; SD = 12.9). Because the speakers whose UFP grade had been rated as V or VI did not differ in terms of lip mobility, we regrouped them into a single group. As a result, four speaker groups were defined for this study. To simplify the notation in the remainder of the article, we will refer to the groups as G1 (control group), G2 (grade III), G3 (grade IV), and G4 (grades V and VI). The 32 speakers are evenly distributed into these four groups, with equal proportions of male and female speakers and a mean age of 45 years.
The participants were recorded in a soundproof booth with a supercardoid micro-phone on a numerical recorder using a 16 bit/44.1kHz linear PCM WAV audio reso-lution. They read aloud 17 declarative sentences, which included all standard French consonants and semiconsonants.1Each sentence was constructed in order to (1) include
different realizations of a target consonant (i.e., alliterations) or (2) lead the speaker to produce a specific phonetic contrast (e.g., voicing) several times. As an example, the sentence “Le moteur de ma moto n’a pas d´emarr´e” (The engine of my motorbike did not start) used an alliteration of the bilabial consonant /m/, and the sentence “Le catalogue de Paul est tomb´e” (Paul’s catalog fell down) relied on the production of voiced/voiceless stop pairs (/g/ vs. /k/, /d/ vs. /t/, and /b/ vs. /p/). More details about the speech corpus can be found in Robert et al. [2011].
1We will use the SAMPA phonetic alphabet throughout the article. The standard French phonological system
includes bilabial (/p/, /b/, /m/), labiodental (/f/, /v/), alveodental (/t/, /d/, /n/), alveolar (/s/, /z/, /l/), palatal (/S/, /Z/), velar (/k/, /g/), and uvular (/R/) consonants, as well as the three semiconsonants /w/, /H/, and /j/.
5. LISTENING ANALYSIS
For people with severe UFP (as indicated by a high H&B grade), an inability to control the lips hinders a proper control of air flow. As reported in the literature, phonemes most impacted are consonants: bilabials /p, b, and m/ may lose their burst phase, and labiodentals /f and v/ and fricatives /s and S/ are also impacted due to a unilateral stretching/closing of the lips [Robert et al. 2011]. A qualitative study showed that the most affected consonants are /p/ and /f/ [Albinhac and Rodier 2003]. To a lesser extent, vowels may also be affected, in particular vowels that imply a certain control of the lips’ movements such as /e, i, o, u, and y/ and nasal rounded vowels /o∼ and e∼/. Although former studies reported a clear correlation between the severity of impairment and the articulatory disorders, a large variability between speakers was observed when considering their pronunciation difficulties, even with speakers sharing the same palsy grade [Robert et al. 2011].
A listening analysis of our corpus was conducted in order to get an overall impression on pronunciation issues that could occur. In general, G3 speakers’ performance seemed less impacted than that of G2 speakers. Although differences with the control group were found for these two groups, the deviances for the eight G4 speakers were much more severe. A general impression was that these deviances strongly depend on the speaker, even among speakers in the same group.
Perceptively, bilabial and labiodental consonants /p, f, b/, and /v/ were identified as the most impacted phonemes. Voiced phonemes’ (/b, v/) realizations were judged very hard to perceive, and their voiceless counterparts’ (/p, f/) realizations were often perceived as too breathy. A lack of control of the air flow—often referred to as the breathiness factor in clinical tools for disordered speech evaluation—could explain this impression. Moreover, the participants’ difficulties moving their lips in order to produce explosions may explain why occlusive consonants (/p, b/) were sometimes perceived as constrictive ones (/f, v/). For example, the first name Paul (/pOl/) was sometimes perceived as [fOl]. For some speakers, /b/ realizations often sounded as [v], as in the word bu (/by/, drunk) perceived as [vy]. Concerning the fricative /v/ realizations, they were perceived as the semiconsonant /H/ in some speakers. More generally, exaggerated breathiness impacted all voiceless occlusive consonants (/p, t, k/), which were perceived with an aspiration such as in English realizations. A tendency to produce retroflex variants of phonemes /S/ and /d/ was also perceived for some speakers. This could be the result of a strategy to compensate for the lack of articulation possibilities in the mouth and lips by lifting the tongue toward the postalveolar area.
Quite unexpectedly, no peculiarities were identified for /m/ and /n/ realizations, al-though their place of articulation could have been al-thought of as problematic for speak-ers with UFP. This might be explained by the fact that these two nasal consonants generate much weaker bursts than their oral counterparts, and thus their intelligibil-ity may be less impacted by speakers’ lips’ hypokinesia.
6. MANUAL PHONE-LEVEL TRANSCRIPTION
Two annotators manually transcribed speech data from G4 speakers at the phone level. Interannotator agreement was very high as a 0.94 Cohen’s kappa coefficient value was achieved. Of the total 4K phones that were automatically aligned, 8.3% differ after manual corrections, with 3.6%, 2.5%, and 2.2% of substitutions, insertions, and deletions, respectively.
Insertions were mainly additions of schwas (1.3%). The lexicon comprises pronun-ciation alternates with and without schwas, whose realization is optional in French. Hence, the automatic recognizer seems to have the tendency to use pronunciations with elided schwas when aligning. The most frequent manual corrections were, in decreas-ing importance, deletions of voiced and unvoiced plosive closures (1.1%); substitutions
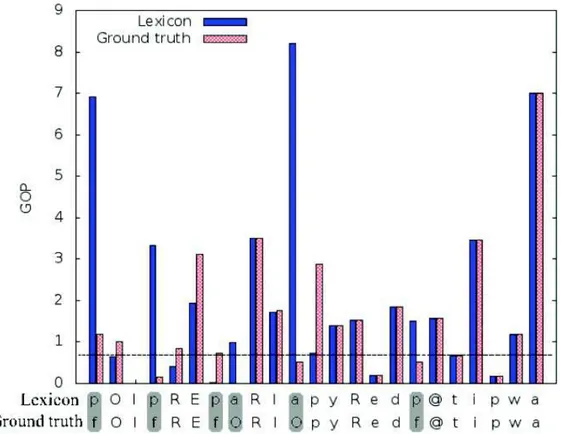
Fig. 1. Example of GOP scores for the utterance “Paul pr´epare la pur´ee de petits pois.” “Lexicon”: phones extracted from a French lexicon, “Ground truth”: phones identified by the annotators. Horizontal dashed line: rejection threshold for phone /p/ (0.7).
of [p] by [f] (0.7%), by [b] (0.1%), by [w] (0.05%), and by [v] (0.05%); deletions of [t] (0.6%); insertions of [Z] (0.2%) after a [d]; and substitutions of [b] by [v] (0.1%). These results confirmed most of the observations made during the listening analysis concerning both the impacted phonemes and the interspeaker variability. The frequent substitutions of [p] by [f] occurred with half of the speakers of G4. This observation tends to confirm our previous study, in which the presence of a burst for /p/ was a crucial feature used in automatically determining the UFP grade [Mauclair et al. 2013].
7. GOP EXPERIMENTS 7.1. Setup
The alignment and recognition setup consists of three state left-to-right HMMs with 32 Gaussian mixture components trained on the ESTER corpus [Galliano et al. 2005]. The training corpus is composed of 31 hours of broadcast news clean speech (no music overlaps and no telephone speech) from several French national radio programs. This corpus was manually transcribed. Feature vectors are extracted on a half-overlap 16ms window. The vector consists of 12 MFCCs, normalized energy, delta, and delta delta (39 parameters). Context-independent acoustic models (39 monophones) were used since they have been found to be more suitable for CALL applications than context-dependent units [Kawahara and Minematsu 2012]. Initialization of models was done with automatic alignment of the Phase I training corpus [Gravier 2005] using Baum-Welch re-estimation. This work was carried out with HTK [Young and Young 1994].
7.2. Illustration of GOP on a Sentence
Figure 1 illustrates an example of GOP scores obtained on the utterance “Paul pr´epare la pur´ee de petits pois” (Paul is preparing mashed peas) for a speaker of group G4 with difficulties producing /p/ consonants. This figure compares two sets of GOP
Fig. 2. Most frequent substitutions of the sibilant /s/ in percentages, as found by the phone recognizer. Average GOP values for /s/ are also indicated along with corresponding standard deviation values in the form of error bars.
Table I. Average and Standard Deviation (std) GOP Values Per Group
Group Average GOP (std) G1 1.62 (2.93) G2 1.92 (3.14) G3 1.67 (2.85) G4 2.24 (3.52)
scores computed with two different phone transcriptions given below the x-axis: one with standard pronunciations, indicated by the label “Lexicon,” and the manual one, indicated by the label “Ground truth.” Six differences between the two sequences were highlighted with a gray background color: four /p/ realizations and two /a/ realizations transcribed by [f] and [O], respectively. The horizontal dashed line of the equation GOP = 0.7 was added to indicate the threshold for phone [p]. As we shall explain hereafter, phone-specific threshold values are tuned with the control group speech be-forehand. Every Lexicon GOP score of [p] realizations above this line gives a rejection. As can be seen, all the mispronunciations of the phoneme /p/ were correctly rejected with this threshold, but one correct pronunciation—in the middle of the utterance— was incorrectly rejected (score = 0.72). Since Ground truth corresponds to phones that were actually pronounced, the corresponding GOP scores are expected to be smaller than the lexicon-based ones. Indeed, the GOP average values for the whole subcorpus were 2.03 and 2.11 for Ground truth and Lexicon, respectively.
7.3. Intergroup Results
Figure 2 shows the most frequent substitutions of the sibilant /s/ with other consonants, as found by the phone recognizer. Average GOP scores with standard deviations are also given for the four groups. As one can see, confusions with [f] and [S] increase with the impairment grade, such as the average GOP for this phone, except for G3. Nevertheless, the GOP score trend was not always that clear for other phones. An attempt to cluster the speakers according to their GOP values proved unsuccessful, confirming our impression gained during the listening analysis that the speakers of our database, even the most impaired ones, do not share the same pronunciation issues. In Table I, we report the average and standard deviations of GOP values for each speaker group. These values were calculated by considering the GOP scores of all the phone realizations. It appeared that means and standard deviations globally increased with the impairment grade, except for group G3. Group G3 showed a smaller GOP
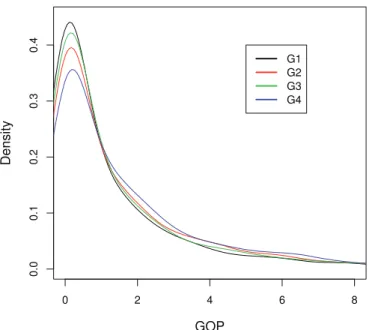
Fig. 3. Estimated densities of the GOP scores.
mean compared to G2, which confirmed our impression that speakers from this group sounded less impacted than G2 speakers. A Kruskal-Wallis test confirmed that the GOP score distributions of the four groups are not all identical (χ2 = 176.5, df = 3, p < .000). Further Wilcoxon rank sum tests confirmed that the distributions are dif-ferent from one group to another (p < .000 with Z = −6.89 (G1–G2), −3.06 (G1–G3), −12.51 (G1–G4), −3.90 (G2–G3), −5.65 (G2–G4), and −9.60 (G3–G4)). To further illus-trate differences between GOP scores, Figure 3 shows estimated densities for the GOP scores of the four groups. It can be observed that these densities have a maximum close to a zero score, which corresponds to phone realizations judged as correct. As expected, the black curve, from G1, has the highest peak, and G4 the smallest one. Peaks from G2 and G3 are interchanged, showing that a greater number of pronunciations were estimated correct for G3 speakers than for G2 speakers. The most noticeable differ-ences between the groups occur for scores close to zero. A few phones were scored with higher values (from 8 to 20), but all the distributions are similar within this range.
The H&B scale uses criteria related to the eyes, tongue, lips, cheeks, and facial muscles. For each of the five criteria clinicians give a score, and the combination of these scores leads to the final H&B grade. Since the eyes criterion is not directly related to speech production abilities, and since all the speakers had the highest score for the tongue mobility (UFP does not affect the tongue in general), we restricted our study to the comparison of GOP scores with the combination of H&B scores related to the lips’, cheeks’, and facial muscles’ mobility only. We computed an average of these scores to obtain a partial H&B score with a maximum value of 10. We compared this partial score to the mean GOP scores of each group. Figure 4 shows this score value (called LCFM for lips’, cheeks’, and facial muscles’ mobility) as a function of the mean GOP scores for the four speaker groups. A default LCFM score of 10 was given to G1. As expected, the LCFM score decreases with the H&B grade, but again, the G3 point was not expected to be on the left-hand side of the graph (low GOP score).
To conclude on these analyses, one can say that clear distinctions were observed in terms of GOP scores and, hence, pronunciation accuracy between the control group (G1) and the group of people with the highest H&B grade (G4). On the contrary, for average grades (G2 and G3), better GOP scores (closer to zero) were found for G3, showing that the relationship between GOP scores and the H&B scale is not
Fig. 4. Average lips, cheeks, and facial mobility (LCFM) score as a function of GOP for the four speaker groups.
monotonic. High variance in GOP scores within groups also indicates important vari-ability between speakers of the same grade. Hence, GOP scores and the H&B scale bring complementary information.
7.4. GOP Algorithm Accuracy
The GOP algorithm was evaluated in terms of Scoring Accuracy (SA), which is the percentage of Correct Acceptances (CAs) and Correct Rejections (CRs) divided by the total number of tokens (N): S A = 100% ∗ (C A+ C R)/N. Correct acceptances are phones that were correctly pronounced and whose GOP scores were below a given threshold. Correct rejections are phones that were pronounced incorrectly and whose GOP scores were above a given threshold. To give an idea of performance obtained in CALL appli-cations, SAs of about 80% obtained on Dutch nonnative speech, with 50% for CAs and 32% for CRs, were reported on a test set [Kanters et al. 2009].
In Section 6, we reported that 8.3% of the 4K phones aligned with speech of the G4 speakers were edited by the annotators, of which 2.5% were insertions. Insertions cannot be handled by the algorithm since no GOP scores are computed for them. Hence, the algorithm should detect at most 233 mispronunciations, which correspond to 5.8% of 4K realizations.
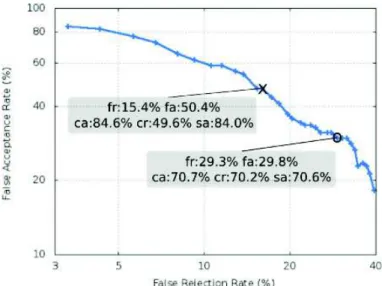
We set phone-specific thresholds based on the GOP scores obtained on the phone realizations from the control group speakers (G1). We considered all their realizations to be correct. As a consequence, rejections are only due to misrecognitions or misalign-ments made by the system. Thresholds were defined by carrying out an exhaustive search for each phone, starting from a zero value with a step size of 0.1. To illustrate the global detection performance, Figure 5 shows a Detection Error Tradeoff (DET) curve obtained on the G4 data. This curve represents the tradeoff between false rejec-tions (FRs) and false acceptances (FAs) when varying decision thresholds. We started from the best phone-specific thresholds obtained separately and measured the FR and FA rates when varying these thresholds. In Kanters et al. [2009], the use of an FR rate below 10% was justified by the fact that false rejections are more detrimental than false acceptances for a learner. With such a criterion applied on our data, we achieved SA, CA, and CR rates of 84.0%, 84.6%, and 49.6%, respectively. This operating point is indicated on the DET curve by a cross. The correct acceptance rate depends on the phones. The GOP threshold for /p/, for instance, was set to 0.7 with this configuration, and the most frequent mispronunciation, /p/ pronounced as an [f], was correctly de-tected in 60% of the cases. Another operating point is highlighted by a circle on the
Fig. 5. DET curve for G4. Two special operating points are represented: “x” with FR = 10% on G1 data, and “o” with equal FR and FA on G4 data.
graph. It corresponds to the point with equal FR and FA rates (about 30%) obtained on the G4 test data. At this point, the system detected 70.2% mispronunciations, but the correct acceptance rate decreased to 70.7% compared to 84.6% obtained at the previous operating point.
8. TOWARD A BROADER USE OF GOP MEASURES TO ASSESS DISORDERED SPEECH COMPREHENSIBILITY: AN EXPLORATORY STUDY
Applying the GOP algorithm to assess UFP speakers’ performance proved to be effec-tive by correctly detecting 49.6% of mispronunciations (CR rate) and 84.6% of correct pronunciations when allowing a false rejection rate of only 10% in the control group. Another important finding was that UFP severity grades as estimated according to the H&B scale were not consistent with mean GOP scores, especially in participants whose severity was moderate (groups 2 and 3). This result might be due to the fact that the H&B scale relies exclusively on physiological aspects and does not take into account speech production criteria. In this sense, GOP measures could provide a dif-ferent and complementary insight into people’s abilities, that is, more oriented toward their comprehensibility.
Also, the extendability of these results to other kinds of speech disorders may be put to question, since the nature of the speech signal may vary significantly from one pathology to another. This second study aims at exploring these particular points by comparing GOP measures with objective comprehensibility measures and subjective assessments concerning six people with various speech disorders. The main hypothesis is that GOP scores will decrease as a function of participants’ comprehensibility.
8.1. Speech Stimuli
Speech stimuli were recorded from one female participant and five male participants, aged from 49 to 70 years (mean = 61; SD = 8.5): four participants with speech disorders due to oral or oropharyngeal cancer surgery (among which was one with total laryngec-tomy) and two participants with neurological speech disorders (spasmodic dysphonia and parkinsonian dysarthria). The six speakers were chosen in order to represent a wide range of severity. Each participant recorded 10 sentences. The sentences were imperative commands asking for moving objects or animals such as “Mettez l’ours `a gauche du kangourou” (Move the bear to the left of the kangaroo).
8.2. Comprehensibility Scores
8.2.1. Objective Scores: Reaction Times to Oral Commands. Twenty-four listeners re-sponded to the 60 oral commands on a software set up for this purpose [Fontan et al. 2014]. For each sentence, six images were displayed on the screen and listeners were asked to move the target image as demanded in each command. The reaction times (RTs) were measured each time a listener was selecting an image in order to move it. For example, in the sentence asking the listener to move the bear to the left of the kangaroo, RT corresponded to the time that elapsed between the beginning of sentence play and the moment at which the listener clicked on the image representing a bear. This procedure prevented any influence of the distance between source and target posi-tions. Moreover, only cases in which the listeners selected the correct image were taken into account. The 24 listeners differed both in terms of age (mean = 32.5; SD = 13.4) and years of experience in listening to disordered speech (mean = 7.8; SD = 11.4). As these two variables were found to have an equal and opposite influence on RT [Fontan 2012], no attempt has been made to weight the scores as a function of listeners’ age and years of experience. Only mean RTs for each sentence have been considered.
8.2.2. Subjective Judgments of Speech Comprehensibility on a Rating Scale. To collect subjec-tive judgments of speech comprehensibility, two speech pathologists with more than 10 years of experience in listening and evaluating disordered speech were asked to rate each sentence comprehensibility on an interval scale. The scale consisted of 7 points, starting from 1 (very hard to understand) up to 7 (very easy to understand). In order to check the interrater agreement, a Kendall tau-b rank correlation was computed. Re-sults showed a highly significant and strong correlation between the two rater scores (t = 0.73; p < 0.001). Eventually, a mean comprehensibility score taking into account the two raters’ judgments was calculated for each sentence.
8.3. Procedure
In the previous case of UFP, mispronunciation impacted the realization of specific phonemes, such as bilabial plosives. Manual phonetic transcriptions reflecting these individual mispronunciations were relatively easy to produce, leading to a high in-terannotator agreement. On the contrary, manually transcribing speech from the most impacted participants among the six speakers of this new study—such as the laryngectomee—appeared to be very difficult. For this reason, in the experiments re-ported in this section, GOP scores were not computed by comparing free phone align-ments with manual phonetic transcriptions. Rather, for each sentence, the free phone alignment was compared to an expected standard pronunciation, that is, the pho-netic sequence expected by the ASR system with regards to the sentence orthographic transcription.
8.4. Results
8.4.1. Mean Scores. Table II shows mean and standard deviations of GOP scores, re-action times to oral commands, and comprehensibility scores for each of the six partic-ipants. These values suggest that mean RTs tend to increase with mean GOP scores, whereas mean comprehensibility appears to decrease as a function of GOP.
8.4.2. Correlation Between GOP Scores and Reaction Times. A Pearson product-moment
correlation was computed in order to investigate the strength and direction of the relation between GOP scores and reaction times to oral commands. The result reveals a highly significant and strong correlation between the two variables (r = 0.786; p < 0.001). The relation is positive, indicating that the RTs increase with GOP scores. The correlation plot is shown in the left-hand part of Figure 6.
Table II. Mean GOP Values, Reaction Time, and Comprehensibility Scores for the Six Speakers Mean Reaction Time Mean Comprehensibility Speaker Mean GOP Value to Oral Commands (s) Score
AP1 1.60 (0.56) 4.11 (0.77) 5.65 (0.45) NP1 2.32 (0.66) 4.63 (1.08) 5.30 (0.40) NP2 2.54 (0.48) 5.54 (1.17) 4.70 (0.40) AP2 2.86 (0.71) 5.50 (1.20) 4.05 (0.45) AP3 3.67 (0.46) 7.51 (1.15) 4.25 (0.35) AP4 4.15 (0.67) 9.64 (2.56) 1.65 (0.25)
AP: Participants with Structural (Anatomic) Disorders, NP: Participants with Neurological Disorders.
Fig. 6. Left: Reaction times to oral commands as a function of GOP. The red full line is regression fit of equation y = 1.55 ∗ GOP + 1.73. Right: Mean sentence comprehensibility as a function of GOP. The rating is between 1 and 7, with the minimum value of 1 corresponding to sentences that are very difficult to understand. The red full line is regression fit of equation y = −0.97 ∗ GOP + 7.04.
8.4.3. Correlation Between GOP Scores and Comprehensibility Judgments. A Pearson’s product-moment correlation calculation revealed a strong negative correlation between GOP scores and comprehensibility judgments (r = −0.684; p < 0.001), indicating that comprehensibility judgments tend to increase as GOP scores decrease. The correlation plot is shown in the right-hand part of Figure 6.
9. CONCLUSIONS
In this article, we first reported our findings from a detailed analysis of pronunciation at the phone level in speakers with UFP at different clinical severity grades. A read speech corpus recorded from 32 French native speakers was used for this purpose. Mis-pronunciations were identified automatically by using the GOP algorithm, originating from the CALL research area. It proved to be effective by correctly detecting 49.6% and 84.6% of mispronunciations (CR rate) and correct pronunciations, respectively, when allowing a false rejection rate of only 10% on the control group speech used to set the GOP phone-specific thresholds. The CR rate increased to 70.2% with equal FR and FA rates of about 30%. The highest average GOP scores, which indicate large deviances from standard phone realizations, were obtained with speech productions of the most impaired speakers.
Another interesting finding was the fact that average GOP values per speaker glob-ally increased with the clinical severity grades when considering the control group and the highest H&B grade group (G4). Nevertheless, for the intermediate grades, G2 speakers obtained worse pronunciation scores than G3 speakers. Hence, the relation-ship between GOP scores and H&B grades was not monotonic. This result was coher-ent with a listening analysis, in which G3 speakers were judged similar to the control
speakers in terms of pronunciation. This result indicates that GOP scores provide a different insight into people’s performance than the H&B scale, insight related to their pronunciation capabilities. It is important to capture this information if one wants to determine which phones are mispronounced in order to help a person to improve his or her pronunciation.
GOP scores can be thought of as indexes of speech comprehensibility. To check this hypothesis and to broaden the scope of this study to other types of speech disorders, we applied the GOP technique on a second corpus recorded with speakers with speech im-pairments due to cancer surgery or neurological disorders. The results obtained in this second study seem to confirm quite clearly our hypothesis, by showing that GOP scores globally decrease as a function of speakers’ comprehensibility—as measured through listeners’ reactions to oral commands and subjective comprehensibility judgments on a 7-point scale.
The experiments were conducted with speech data in French only. Nevertheless, the GOP algorithm is language independent, and pronunciation phenomena were ob-served on phones shared between many languages. Hence, it is expected that carry-ing out similar experiments on other languages would give similar results. Finally, speaker-independent acoustic models were used in this work. Phone recognition could be improved by adapting these models. Nevertheless, conventional speaker adapta-tion techniques such as maximum likelihood linear regression (MLLR) were shown to have the countereffect of recognizing mispronunciations as correct due to overadapta-tion. Variants to MLLR proposed in the literature will be considered to improve GOP accuracy [Luo et al. 2009, 2010].
As a conclusion, results from both experiments tend to validate the use of GOP to measure speech capability loss in the context of speech disorders. Nevertheless, as pointed out in the introduction, speech pathologies may lead to very different acoustic peculiarities in speech signals. Hence, the relevance of automatic measures based on speech signal processing such as GOP scores may strongly depend on the pathologies speakers have. As a consequence, future work will be conducted in order to survey the extendability of these results to a larger set of structural and neurological speech disorders.
ACKNOWLEDGMENTS
The authors would like to thank the Voice and Deglutition Unit (UVD) of the Hospital Larrey at Toulouse, with special regards to Virginie Woisard, Julie Bordenave, and Astrid Ros, who participated in collecting comprehensibility data used for the exploratory study reported in Section 8. They also are grateful to Laurent Risser and S´ebastien D´ejean from the Institut de math´ematiques de Toulouse for their valuable help with the statistical tests.
REFERENCES
A.-C. Albinhac and A. Rodier. 2003. Analyse quantitative et qualitative des troubles d’articulation dans les
paralysies faciales p´eriph´eriques. M´emoire pour l’obtention du CCO. Paris.
J. Bernstein, M. Cohen, H. Murveit, D. Rtischev, and M. Weintraub. 1990. Automatic evaluation and training in English pronunciation. In Proceedings of ICSLP. Kobe
M. Eskenazi. 2009. An overview of spoken language technology for education. Speech Communication 51, 10 (2009), 832–844.
R. Evans, M. Harries, D. Baguley, and D. Moffat. 1989. Reliability of the House and Brackmann grading system for facial palsy. Journal of Laryngology and Otology 103, 11 (1989), 1045–1046.
L. Fontan. 2012. De la mesure de l’intelligibilit´e `a l’´evaluation de la compr´ehension de la parole pathologique
en situation de communication. Ph.D. Dissertation. Universit´e de Toulouse.
L. Fontan, P. Gaillard, and V. Woisard. 2014. Comprendre et agir: Les tests pragmatiques de compr´ehension de la parole et EloKanz. In Travaux en phon´etique clinique, R. Sock, B. Vaxelaire, and C. Fauth (Eds.). 131–144.
S. Galliano, E. Geoffrois, D. Mostefa, K. Choukri, J.-F. Bonastre, and G. Gravier. 2005. The ESTER phase II evaluation campaign for the rich transcription of French broadcast news. In Proceedings Interspeech. Lisbon, 1149–1152.
P. Gatignol and G. Lamas. 2004. Paralysies faciales. Solal Editions.
G. Gravier. 2005. Alignements phonetique train Phase 1. (mars 2005). http://www.afcp-parole.org/camp_ eval_systemes_transcription/private/repository/IRENE/align-irisa-enst-phase1.tar.gz.
J. W. House and D. E. Brackmann. 1985. Facial nerve grading system. Otolaryngology-Head and Neck
Surgery 93 (1985), 146–147.
S. Kanters, C. Cucchiarini, and H. Strik. 2009. The goodness of pronunciation algorithm: A detailed per-formance study. In Proceedings of the 2009 ISCA Workshop on Speech and Language Technology in
Education (SLaTE ’09). Warwickshire, 2–5.
T. Kawahara and N. Minematsu. 2012. Tutorial on CALL Systems at Interspeech. Portland.
P. Kitzin, A. Maier, and V. L. Ahlander. 2009. Automatic speech recognition (ASR) and its use as a tool for assessment or therapy of voice, speech, and language disorders. Logopedics, Phoniatrics, Vocology 34, 2 (2009), 91–96.
U. Ljostad, S. Okstad, T. Topstad, A. Mygland, and P. Monstad. 2005. Acute peripheral facial palsy in adults.
Journal of Neurology 252, 6 (2005), 672–676.
D. Luo, Y. Qiao, N. Minematsu, Y. Yamauchi, and K. Hirose. 2009. Analysis and utilization of MLLR speaker adaptation technique for learners’ pronunciation evaluation. In Proceedings of Interspeech. Brighton, 608–611.
D. Luo, Y. Qiao, N. Minematsu, Y. Yamauchi, and K. Hirose. 2010. Regularized-MLLR speaker adaptation for computer-assisted language learning system. In Proceedings of Interspeech. 594–597.
A. Maier, T. Haderlein, U. Eysholdt, F. Rosanowski, A. Batliner, M. Schuster, and E. N¨oth. 2009. PEAKS - A system for the automatic evaluation of voice and speech disorders. Speech Communication 51, 5 (2009), 425–437.
A. Maier, T. Haderlein, F. Stelzle, E. N¨oth, E. Nkenke, F. Rosanowski, A. Sch ¨utzenberger, and M. Schuster. 2010. Automatic speech recognition systems for the evaluation of voice and speech disorders in head and neck cancer. EURASIP Journal on Audio, Speech, and Music Processing 2010 (2010), 1–8.
J. Mauclair, L. Koenig, M. Robert, and P. Gatignol. 2013. Burst-based features for the classification of pathological voices. In Proceedings of Interspeech. Lyon, 2167–2171.
D.-V. Popovici and C. Buic ˘a-Belciu. 2012. Professional challenges in computer-assisted speech therapy.
Pro-cedia - Social and Behavioral Sciences 33 (2012), 518–522.
M. Robert, J. Mauclair, E. Lannadere, F. Tank´er´e, G. Lamas, and P. Gatignol. 2011. Analyse des troubles articulatoires au cours des paralysies faciales p´eriph´eriques. LXVII Congr`es de la Soci´et´e Fran¸caise de
Phoniatrie (2011).
O. Saz, E. Lleida, C. Vaquero, and W.-R. Rodr´ıguez. 2010. The alborada-I3A corpus of disordered speech. In
Proceedings of the 7th International Conference on Language Resources and Evaluation (LREC’10)
(19-21), N. Calzolari, K. Choukri, B. Maegaard, J. Mariani, J. Odijk, S. Piperidis, M. Rosner, and D. Tapias (Eds.). ELRA, Valletta, Malta.
O. Saz, S.-C. Yin, E. Lleida, R. Rose, C. Vaquero, and W.-R. Rodr´ıguez. 2009. Tools and technologies for computer-aided speech and language therapy. Speech Communication 51, 10 (2009), 948–967.
M. Schuster, A. Maier, T. Haderlein, E. Nkenke, U. Wohlleben, F. Rosanowski, U. Eysholdt, and E. N¨oth. 2006. Evaluation of speech intelligibility for children with cleft lip and palate by means of automatic speech recognition. International Journal of Pediatric Otorhinolaryngology 70, 10 (Oct. 2006), 1741–1747. B. Sevenster, G. de Krom, and G. Bloothooft. 1998. Evaluation and training of second-language learners’
pronunciation using phoneme-based HMMs. In Proceedings of STiLL. Marholmen, 91–94.
H. Strik, Khiet P. Truong, F. de Wet, and C. Cucchiarini. 2007. Comparing classifiers for pronunciation error detection. In Proceedings of Interspeech. Antwerp, 1837–1840.
E. Wilson and T. Spaulding. 2010. Effects of noise and speech intelligibility on listener comprehension and processing time of korean-accented english. Journal of Speech, Language and Hearing Research 53, 6 (2010), 1543–1554.
S. M. Witt. 1999. Use of Speech Recognition in Computer-Assisted Language Learning. Ph.D. Dissertation. University of Cambridge, Dept. of Engineering.
S. M. Witt and S. Young. 2000. Phone-level pronunciation scoring and assessment for interactive language learning. Speech Communication 30 (2000), 95–108.
S. J. Young and S. J. Young. 1994. The HTK hidden Markov model toolkit: Design and philosophy. Entropic