HAL Id: cirad-00925933
http://hal.cirad.fr/cirad-00925933
Submitted on 8 Jan 2014HAL is a multi-disciplinary open access archive for the deposit and dissemination of sci-entific research documents, whether they are pub-lished or not. The documents may come from teaching and research institutions in France or abroad, or from public or private research centers.
L’archive ouverte pluridisciplinaire HAL, est destinée au dépôt et à la diffusion de documents scientifiques de niveau recherche, publiés ou non, émanant des établissements d’enseignement et de recherche français ou étrangers, des laboratoires publics ou privés.
into REDD+ projects: Lessons from Indonesia and the
Philippines
Emilia Pramova, Bruno Locatelli
To cite this version:
Emilia Pramova, Bruno Locatelli. Guidebook on integrating community-based adaptation into REDD+ projects: Lessons from Indonesia and the Philippines. CIFOR, Indonesia, pp.72, 2013, 978-602-1504-24-6. �cirad-00925933�
Emilia Pramova and Bruno Locatelli
Guidebook on integrating
community-based adaptation into REDD+ projects
Lessons from Indonesia and the Philippines
Emilia P ramo va and Bruno L ocat elli teg ra ting c ommunit y-based adapta tion in to REDD+ pr ojec ts: L essons fr om I
ndonesia and the P
community-based adaptation
into REDD+ projects
Lessons from Indonesia and the Philippines
Emilia Pramova and Bruno Locatelli
NoDerivs 3.0 Unported License http://creativecommons.org/licenses/by-nc-nd/3.0/ ISBN 978-602-1504-24-6
Pramova E and Locatelli B. 2013 Guidebook on integrating community-based adaptation into
REDD+ projects: Lessons from Indonesia and the Philippines. Bogor, Indonesia: CIFOR.
Cover photo by Bruno Locatelli Coast and mountains in Indonesia.
This study was conducted by CIFOR in collaboration with the Deutsche Gesellschaft für Internationale Zusammenarbeit (GIZ) GmbH with a grant from the German Federal Ministry for Economic Cooperation and Development (BMZ).
CIFOR
Jl. CIFOR, Situ Gede Bogor Barat 16115 Indonesia T +62 (251) 8622-622 F +62 (251) 8622-100 E [email protected] cifor.org
We would like to thank all donors who supported this research through their contributions to the CGIAR Fund. For a list of Fund donors please see: https://www.cgiarfund.org/FundDonors Any views expressed in this publication are those of the authors. They do not necessarily represent the views of CIFOR, the authors’ institutions or the financial sponsors of this publication.
Abbreviations v Acknowledgments vi
Part 1: Concepts and tools 1
Introduction 1 Forests and climate change: Merging adaptation and mitigation 2 Social return on investment: Methodology and key concepts 4
Part 2 : Application of methods to integrate adaptation into REDD+ projects 6
Step 1: Vulnerability analysis 6
Step 2: Participatory workshops 15
Step 3: Analysis of adaptation interventions and REDD+ objectives 27 Step 4: Impact mapping and cost–benefit analysis 35 Step 5: Communication of results back to stakeholders 41
Part 3: Concluding remarks 42
References 43 Annexes 48
1. Semistructured interview guide for district-level stakeholders in Malinau 48 2. Adaptation strategies and linkages with REDD+ in Sogod 50
Figures
1. Five steps to integrate community-based adaptation into REDD+ 1
2. Vulnerability framework 6
3. Climate stations close to Sogod (PH) 8
4. Predicted monthly precipitation in Sogod (PH) for 2080 9 5. Map of the barangay showing important resources, challenges and
hazards, and coping mechanisms 20
6. Priority voting on adaptation aspirations in Setulang (ID) 25
Tables
1. Differences between mitigation and adaptation 3 2. Examples of financial proxies for outcomes relevant to adaptation
and REDD+ 38
Boxes
1. Current climate trends and future concerns in Malinau (ID) and
Sogod (PH) 11
2. Sensitivity in Sogod (PH) 13
3. Adaptive capacity in Sogod (PH) 16
4. Selecting workshop participants in Malinau (ID) and Sogod (PH) 19 5. Activities in initial participatory workshop 20 6. Questions and steps for value and hazard mapping 21 7. Resources and challenges in Setulang (ID) 22 8. Questions and steps for future visioning and adaptation planning 24 9. Priority adaptation interventions and aspirations in Setulang (ID) 25 10. Contribution of provincial-level stakeholders to adaptation and
interventions in Sogod (PH) 30
11. Viability of rubber agroforestry interventions against major climate
threats in Setulang (ID) 33
12. Questions to explore when considering the linkages with REDD+ 34
BMU Federal Ministry for the Environment, Nature Conservation and Nuclear Safety (Germany)
BMZ Federal Ministry for Economic Cooperation and Development (Germany)
CBA Community-based adaptation
CBFMA Community-based Forest Management Agreement
CIP Climate Information Portal
CRU Tyndall Centre’s Climate Research Unit
DENR Department of Environment and Natural Resources (Philippines)
FIDA Fiber Industry Development Authority
FLUP Forest land-use plan
GCM General circulation model
GHG Greenhouse gas
GIZ Deutsche Gesellschaft für Internationale Zusammenarbeit GmbH
ID Indonesia
IPCC Intergovernmental Panel on Climate Change NTFP Non-timber forest products
PH Philippines PO People’s Organization RCM Regional circulation model
REDD+ Reduced emissions from deforestation and forest degradation SROI Social return on investment
This guidebook was made possible by the financial contribution of the German Federal Ministry for Economic Cooperation and Development (BMZ) and the technical and logistical assistance of the Deutsche Gesellschaft für Internationale Zusammenarbeit (GIZ).
The case study in Indonesia was conducted as part of Forests and Climate Change (FORCLIME), which supports the Government of Indonesia in its endeavor to mitigate the effects of climate change through forestry sector reform, capacity development and implementation of sustainable forest management and biodiversity conservation. FORCLIME is funded by the BMZ and implemented by GIZ and the German Development Bank KfW, with the Indonesian Ministry of Forestry as the Program Executing Agency.
We would particularly like to thank the GIZ FORCLIME team based in Kalimantan, especially Mr. Andreas Mench, Ms. Karlina Kartika, Bapak Edy Marbyanto, Bapak Budi Susanto, Bapak Alie Mustofa and Mr. Timo Beiermann for their invaluable assistance in organizing and conducting the community workshop and for facilitating our contact with district-level organizations and stakeholders. We are also very grateful to the people of Setulang for actively participating and sharing their immense knowledge with us, and to the
representatives of the Malinau district organizations and government agencies who took time out of their busy schedules to speak to us.
The case study in Southern Leyte was conducted as part of the project Climate-relevant Modernization of Forest Policy and Piloting of REDD in the Philippines, funded under the International Climate Initiative of the German Federal Ministry for the Environment, Nature Conservation and Nuclear Safety (BMU), which is implemented jointly by GIZ and the Philippines Department of Environment and Natural Resources (DENR) Forest Management Bureau (FMB) in cooperation with local government units and local communities.
We would particularly like to thank the GIZ-Philippines REDD+ team, especially Dr. Bernd-Markus Liss for his guiding support, Mr. Gordon Bernard Ignacio, Ms. Emma Ruth Ramos, Mr. Celso Versoza, Mr. Eufenio Caňete, and Ms.
Bulak Maglinte for their invaluable assistance in organizing and conducting the community and province-level workshops, facilitating all necessary contacts with stakeholders, and providing expertise and resources throughout all of the activities. We are very grateful to Mrs. Aileen Estrera for making sure everything ran smoothly during the community workshop, inviting the community members and special guests, and organizing the hotel and facilities, and for offering her expertise and resources in her capacity as a member of the local government of Sogod. We are similarly grateful to Mrs. Maylyn Villamor, Mr. Vivencio Sumaylo and Ms. Jungie Amacanin from AFFIRE for facilitating and reporting on both workshops.
A very special thank you is extended to the community participants from barangays Benit, Hipantag, Kahupian, Kauswagan, Santa Maria, San Vicente and San Juan, for their participation and enthusiasm and for sharing their knowledge, and to the representatives of all the municipal and provincial organizations who took the time to actively take part in our workshop.
Introduction
Efforts to tackle climate change are often divided into mitigation approaches and adaptation approaches. Given that mitigation is usually a global priority and adaptation a local priority, practitioners and planners may find it difficult to bridge the scales and ensure that mitigation projects address adaptation concerns and vice versa.
This guidebook demonstrates how community-based adaptation (CBA) can be integrated into mitigation activities, such as reduced emissions from deforestation and forest degradation (REDD+) projects, by incorporating such methods as vulnerability analysis, participatory research and cost–benefit analysis. The use of multiple methods makes it possible not only to link scales but also to integrate adaptation priorities into REDD+ projects.
Part 1 of this guidebook reviews the central concepts in addressing climate change, such as mitigation and adaptation, as well as concepts in the social return on investment (SROI) framework. SROI comprises a combination of methods that includes participatory research, visioning and cost–benefit analysis.
In Part 2, the guidebook sets out a five-step approach to integrating CBA into REDD+ projects (Figure 1). The first step is to conduct a vulnerability analysis.
Figure 1. Five steps to integrate community-based adaptation into REDD+.
Step 1 : Vulnerability
analysis
Step 4 : Cost– benefit analysis and impact map
Step 2 : Participatory workshop Step 5 : Communication of results Step 3 : Analysis of adaptation interventions and REDD+ objectives
In the second step, which is part of SROI, participatory research is conducted, using workshops to gather and analyze information from multiple stakeholders and visioning exercises. Step 3 is to discuss adaptation interventions and REDD+ objectives to assess how to merge CBA into REDD+ projects. Step 4 involves conducting a cost–benefit analysis and developing an impact map, which are also part of the SROI framework. In Step 5, the results of the first four steps are communicated to those who participated and other involved stakeholders. This guidebook is intended for development, conservation and climate change planners and practitioners who have some experience in conducting research and/or implementing projects at the community level using community-based frameworks, participatory research methods and cost–benefit analysis. The aim of the guidebook is to enable users to better integrate adaptation and mitigation activities.
Examples from Indonesia and the Philippines are included to demonstrate how the steps set out in this guidebook were followed. In Indonesia, activities took place in the community forest (hutan desa) REDD+ project area in Setulang Village, Malinau District. This project was implemented by the FORCLIME program of GIZ and funded by the German Federal Ministry for Economic Cooperation and Development (BMZ). In the Philippines, the municipality of Sogod was selected for the case studies. Sogod is one of five target municipalities in Southern Leyte Province for the project Climate-relevant
Modernization of the National Forest Policy and Piloting of REDD Measures in the Philippines. The project is being carried out by GIZ in collaboration with
the Philippine Department of Environment and Natural Resources (DENR) and local government units, with funding from the German Federal Ministry for the Environment, Nature Conservation and Nuclear Safety (BMU) under the International Climate Initiative. Activities in the case study areas and the production of this guidebook were made possible by financial contributions from BMZ and the collaboration of GIZ teams in Germany, Indonesia and the Philippines.
Forests and climate change: Merging adaptation
and mitigation
(a) Adaptation and mitigation: Two strategies for dealing with climate change
Forests play an important role in both adaptation and mitigation.
Adaptation is an ‘adjustment’ in natural and human systems in response to climatic stimuli. Forests contribute to the adaptation of people and economic
sectors by providing ecosystem services that reduce vulnerability. Examples of such services include the provision of goods that act as safety nets when crops fail because of drought (e.g. non-timber forest products (NTFPs) and fuelwood to supplement nutrition and income) and the regulation of water flows and sedimentation during heavy rainfall events.
Mitigation is an intervention that reduces greenhouse gas (GHG) emissions or enhances carbon sinks (IPCC 2001). Forests contribute to mitigation through their capacity to remove carbon from the atmosphere and to store it. REDD+ is a mitigation strategy aimed at achieving the conservation and sustainable management of forests and/or the enhancement of forest carbon stocks. Adaptation and mitigation strategies differ in their objectives and spatial and temporal scales (Table 1).
Table 1. Differences between mitigation and adaptation
Mitigation Adaptation Spatial scale Primarily an international issue,
as mitigation provides global benefits
Primarily a local issue, as adaptation mostly provides benefits at the local scale
Time scale Mitigation has a long-term effect because of the inertia of the climatic system
Adaptation can have a short-term effect on the reduction of vulnerability
Sectors Mitigation is a priority in the energy, transportation, industry and waste management sectors
Adaptation is a priority in the water and health sectors and in coastal or low-lying areas Both mitigation and adaptation are relevant to the agriculture and forestry sectors
Source: Locatelli (2011).
(b) Linking adaptation and mitigation through forests
REDD+ interventions can contribute to the adaptation of both people and forests by conserving or enhancing biodiversity and forest ecosystem services (e.g. through the reduction of anthropogenic pressures such as deforestation and forest degradation). However, additional adaptation measures might be needed, such as the protection of agriculture and livelihoods or the development of fire management strategies. Such measures can support the sustainability of REDD+ interventions and the permanence of carbon stocks by preventing activity displacement and induced deforestation, and by limiting or avoiding damage to the ecosystem from extreme weather events. Integrating adaptation into a REDD+ project can also increase the local legitimacy of the project because adaptation focuses on local needs. In turn, adaptation projects can benefit from carbon
funding and capacity building from international mechanisms, such as REDD+, as well as from being linked to mitigation with its global benefits. This link opens up possibilities to bridge the scales between climate change activities. Adopting an integrated approach to climate change by maximizing the synergies between adaptation and mitigation and by minimizing any potential trade-offs can be not only very cost effective but also highly beneficial for ecosystems and people. Drawing on the principles of SROI, a multistakeholder approach is adopted to analyze the potential impacts of implementing selected CBA interventions within REDD+ case study areas. Special emphasis is placed on forest resources and forest management to examine the potential costs and benefits of adaptation interventions for effective REDD+ implementation.
Further reading and resources
Locatelli B. 2011. Synergies between Adaptation and Mitigation in a Nutshell. Bogor, Indonesia: Center for International Forestry Research. http://www.cifor.org/fileadmin/fileupload/cobam/ ENGLISH-Definitions%26ConceptualFramework.pdf
Pramova E, Locatelli B, Djoudi H and Somorin OA. 2012. Forests and trees for social adaptation to climate variability and change. Wiley Interdisciplinary Reviews: Climate Change 3(6):581–96. http://www.cifor.org/online-library/browse/view-publication/publication/3938.html
Graham K. 2011. REDD+ and Adaptation: Will REDD+ Contribute to Adaptive Capacity at the Local Level? London: Overseas Development Institute. http://www.odi.org.uk/ publications/6147-redd-adaptation-local-adaptive-capacity
Social return on investment: Methodology and key concepts
Social return on investment (SROI), pioneered by The Roberts Enterprise Development Fund in early 2000, is a framework for stakeholder participation in the valuation of the social, environmental and economic outcomes (both positive and negative) of an intervention (Sova et al. 2012). In contrast to traditional cost–benefit analysis, SROI analyzes change in a way that is relevant to the people or organizations that experience or contribute to it. The framework is inspired by the principles of economic cost–benefit analysis, impact assessment and social accounting, which seek to understand and manage the value created by an activity or an organization in a holistic manner. Sova et al. (2012) enhances the SROI framework and its applicability to adaptation planning and costing by adding core principles and practical components from CBA, participatory rural appraisal and strength-based approaches to development, allowing for communities, through
participatory workshops, to design their own adaptation interventions based on their values and capacities.
Although the SROI framework combines various methods for assessing social, environmental and economic values, it is based on theory of change. Theory of change takes into account the chain of events and outcomes connected to a specific intervention. It identifies where and how value is being created and by whom, and who benefits from it and how, across time and space.
The SROI process draws on the principles and methods mentioned above to review components of theory of change, such as the inputs, outputs, outcomes and impact of an intervention or organization through an impact map. Wherever possible, outcomes are given a monetary value to conduct the economic cost– benefit analysis within the impact map, using prevailing market prices for traded goods and financial proxies for intangible and nonmarketable outcomes (e.g. more free time for women).
An SROI analysis can be evaluative, that is, conducted retrospectively and based on actual outcomes that have already taken place. It can also be used to forecast and predict the likely impact and social value created if given activities achieve their intended outcomes. Forecast SROI analyses are especially useful when planning an activity because they can help show how investment can maximize impact, the barriers that need to be overcome, and what should be monitored and evaluated once the project or program is up and running. Forecast SROI is the focus of this guidebook.
Further reading and resources
Nicholls J, Lawlor E, Neitzert E and Goodspeed T. 2012. A Guide to Social Return on Investment. Haddington, UK: The SROI Network. http://www.thesroinetwork.org/sroi-analysis/the-sroi-guide
Sova C, Chaudhury A, Helfgott A and Corner-Dolloff C. 2012. Community-Based Adaptation Costing: An Integrated Framework for the Participatory Costing of Community-Based Adaptations to Climate Change in Agriculture. Working Paper No. 16. Cali, Colombia: CGIAR Research Program on Climate Change, Agriculture and Food Security (CCAFS). http://ccafs.cgiar.org/ sites/default/files/assets/docs/ccafs-wp-16-psroi.pdf
integrate adaptation into REDD+
projects
Step 1: Vulnerability analysis
A desktop vulnerability analysis is important for gathering existing data and background information, and it contributes to a baseline of vulnerabilities. The desktop climate and vulnerability analysis can cover the entire district or province in which the REDD+ project is being conducted. It can be guided by the vulnerability framework, where vulnerability is considered as a function of exposure, sensitivity and adaptive capacity (Figure 2). This type of analysis should be viewed as ‘preliminary’, as stakeholder consultations at both community and broader levels will be needed to validate and supplement findings. Attempts should be made to discuss and verify findings of the desktop vulnerability analysis with stakeholders in the participatory activities (Step 2) to make sure the analysis is as robust as possible.
Vulnerability
Potential impacts
Impacts that may occur, without considering
adaptation
Sensitivity
Degree to which a system is attached, either adversely or beneficially, by
climate-related stimuli
Adaptive capacity
Ability of a system to adjust for moderating damages, taking advantage of opportunities, or
coping with consequences
Exposure Nature and degree to which a system is exposed to significant climatic variations
Figure 2. Vulnerability framework. From Locatelli (2011).
(a) Analyzing exposure
Different types of exposure to climate hazards can occur along different temporal scales. Exposure can relate to the frequency and intensity of abnormal or extreme events (e.g. stronger and more frequent storms), the frequency and intensity of
climate variability (e.g. alterations in wet and dry months or years, fluctuations in daily minimum and maximum temperatures), the shifting of seasonality in time and space (e.g. long rainy periods in the dry season) or long-term incremental trends and slow-onset changes (e.g. increase of 1 °C in the annual mean temperature by 2050).
Looking at past data
It is important to analyze both past and current climate data, as well as future projections. Past data from meteorological stations can reveal important trends that are occurring now, which are likely to become more intense in the future as climate change progresses. Useful data for analysis include the observed monthly rainfall and temperature and monthly means of daily maximum and minimum temperatures throughout the years, all of which provide valuable information about the seasonal cycles in a location and any changes that might be occurring. Observed station records are a critical component for this analysis. However, in many parts of the world, observed data dating back more than 10 years are lacking, and data that are available are not always of good quality. The Climate Information Portal (CIP) of the Climate Systems Analysis Group in the University of Cape Town encompasses observational climate data from meteorological stations in Africa and Asia. These data can be easily accessed by all interested users through a simple web interface (see list of tools and resources at the end of this section), which also includes guidance on how to interpret and analyze monthly climate data. The data presented in CIP are quality controlled and only stations with more than 10 years of valid records are included.
If no stations in the proximity of the target location for analysis have good climate records, other solutions must be sought. In the case study area of Sogod, for example, the closest stations are in Tacloban and Maasin city, which are not in the proximity of the municipality and do not present similar geographic or climatological characteristics (see yellow and red dots on the map in Figure 3). For this reason, for both Sogod and Malinau, interpolated datasets were used. Interpolated datasets use measurements from numerous weather stations around the world and apply tested algorithms to infer climatic data for any point in a global grid. For the two case study sites, the WorldClim dataset (Hijmans et al. 2005; www.worldclim.org) was used to look at the mean climate, and the datasets of Tyndall Centre’s Climate Research Unit (CRU; Mitchell and Jones 2005; www. cru.uea.ac.uk) were used for the analysis of past annual data and climate trends. WorldClim constitutes a set of global climate layers (climate grids) with a spatial resolution of about 1 km. Interpolations of observed data are representative of
the years 1950–2000. The CRU datasets include month-by-month variations in climate at a resolution of 0.5 arc-degree (around 50 km), based on climate archives from more than 4000 weather stations around the globe.
Figure 3. Climate stations close to Sogod (PH).
Source: Climate Information Portal (http://cip.csag.uct.ac.za/webclient/map).
Future projections
Projections of future climate result from global emission scenarios and general or regional circulation models (GCMs or RCMs; also known as global or regional climate models).The emission scenarios are used as the basis for simulations of the circulation models. They constitute narrative storylines for humankind’s development over the next 100 years, including the associated evolution in the volume of GHG emissions. A description of the emission scenarios is given in the Intergovernmental Panel on Climate Change’s Special Report on Emission Scenarios (IPCC 2000).
GCMs or climate models are mathematical representations of the climate system, with simulations of the physical and dynamic processes that determine the global climate. These computer models divide the Earth into horizontal and vertical grid
cells, where each cell represents a specific climatic state for a specific time based on a set of equations. Given the considerable degree of uncertainty associated with climate models and future emission scenarios, one has to assume that the entire set of model outputs represents equally likely future climates. Consequently, it is recommended that multiple models and scenarios be used to project future climate envelopes. Envelopes of temperature projections for the future will be typically much narrower than the equivalent rainfall envelopes because the uncertainty with precipitation is greater.
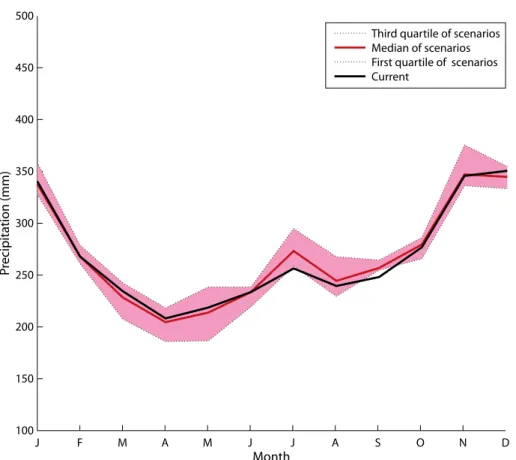
Combining the results of the various models and looking at the means or averages is, however, not recommended. Rather, a better approach is to consider all
possibilities or a few contrasting scenarios. Close attention should be paid to how climate scenarios agree or disagree. In Sogod, for example, most scenarios indicate that precipitation is likely to increase in July and September, whereas an increase or a decrease is possible for the other months (Figure 4).
J F Month Pr ecipita tion (mm) 100 150 200 250 300 350 400 450 500 M A M J J A S O N D Third quartile of scenarios Median of scenarios First quartile of scenarios Current
Figure 4. Predicted monthly precipitation in Sogod (PH) for 2080.
For the case study areas of Malinau and Sogod, future climate trends were retrieved from the TYN SC 2.0 dataset of CRU. The TYN SC 2.0 dataset comprises
monthly grids of modeled climate including cloud cover, diurnal temperature range, precipitation, temperature and vapor pressure for the period 2001–2100, and covering the global land surface at 0.5 degree resolution (50 km2). The outputs
of four GCMs combined with four emission scenarios were used (total of 16 projections). The four emission scenarios are A1FI (integrated world characterized by rapid economic growth and high use of fossil fuels), A2 (more divided world, regionally oriented economic development), B1 (world more integrated and more ecologically friendly) and B2 (world more divided and more ecologically friendly). The four GCMs are CGCM2, CSIRO mk 2 (CSIRO2), DOE PCM (PCM) and HadCM3 (HAD3). Data were retrieved for the years 2020, 2050 and 2080. Relevant secondary data from the literature were also used to supplement findings from the model projections.
Regional projections are of higher resolution than global models. Local climates are influenced by smaller-scale features and processes, such as topography, which are not represented well in global climate models.
There are two main types of regional climate projections depending on the downscaling methods used: statistical and dynamic. Statistically downscaled regional projections analyze empirical data from weather stations and extrapolate the results into the future by using climatic trends taken from the GCMs. The CIP platform uses statistical downscaling for areas where observational data are available. The main drawback of statistical downscaling is that empirical climate data are often not available for long periods without gaps because of a lack of observational coverage in many parts of the world.
By contrast, dynamic regional models work in a similar way to GCMs. They are nested into coarser GCMs and use the outputs of the global models to calculate the potential evolution of the climate in a particular area. However, these models require additional computational effort, as the simulation takes longer because additional processes are represented in more detail. Furthermore, they can be as prone to bias and error as GCMs. User-friendly software for generating high-resolution regional models is PRECIS (www.metoffice.gov.uk/precis/intro). Finally, it must be noted that no matter how advanced a computer model is, uncertainties will always remain when forecasting the carbon cycle and the sources and sinks of GHGs. In addition, current understanding of the very complex feedback processes in the climate system is incomplete (e.g. forests in neighboring regions can influence precipitation in another region of concern). Furthermore, gridded scenarios provide only an average change in climate for each grid box,
Malinau Sogod
Current
trends Mean climate has low seasonality with mean monthly temperature of 26.4 °C–27.3 °C and precipitation of 205–360 mm/month. Two rainfall peaks occur (around November and May).
Temperature: Normal interannual variability but significant warming trend during the past 50 years (increase of 0.2 °C per decade). Precipitation: Interannual variability is relatively normal. Drier and wetter years have occurred but these deviations cannot be considered exceptional. The 5 years with the lowest precipitation are: 1964, 1965, 1967, 1992 and 1997. Those with the highest precipitation are: 1962, 1974, 1980, 1988 and 1999. There is a notable, but not significant, trend of increasing precipitation.
Mean climate has low seasonality with monthly temperature of 23.6 °C–25.4 °C and precipitation of 147–351 mm/month. There is no dry season. The maximum rainfall occurs from November to January.
Temperature: Low interannual variability but significant warming trend during the past 50 years (increase of 0.13 °C per decade). Increase in the number of hot days and decrease in the number of cool days.
Precipitation: High interannual variability with significant trend of increasing annual precipitation (despite the occurrence of exceptionally dry years). Increase in the frequency of extreme daily rainfall.
Future
projections Temperature: All models show increase: from 0.45 °C (min.) to 0.87 °C (max.) by 2020; 0.76 °C to 2.08 °C by 2050; and 1.03 °C to 3.77 °C by 2080. Precipitation: Half of the scenarios show an increase and half a decrease. For 2020, the maximum increase projected is 38.18 mm/year and the maximum decrease is –62.80 mm/year. For 2050, the maximum increase is 83.19 mm/year, and decrease –154.76 mm/year. For 2080, the maximum increase is 152.00 mm/year, and decrease is –280.83 mm/year.
Concerns mostly arise with extremely wet or dry years (interannual
variability) and extreme events such as typhoons, heat waves and heavy rainfall events, none of which is simulated well by climate models.
Temperature: All models show increase: from 0.42 °C (min.) to 0.85 °C (max.) by 2020; 0.71 °C to 2.02 °C by 2050; and 0.96 °C to 3.66 °C by 2080. Medium-range emission scenario shows increases in the number of hot days (max. temperature >35 °C) by 2020 and further increases by 2050. Precipitation: High uncertainty. Four scenarios show an increase of >200 mm by 2080, two show a decrease of >200 mm, and 10 show little change. The highest decrease projected is 370 mm less rain by 2080, and the highest increase is 330 mm. Most models show an increase in precipitation from mid-June to mid-September.
Concerns mostly arise with extremely wet or dry years (interannual
variability) and extreme events such as typhoons, heat waves and heavy rainfall events, none of which is simulated well by climate models.
whereas climates can vary considerably in different parts of the area covered by the grid, and throughout any given decade.
(b) Sensitivity
The degree of sensitivity indicates how responsive a system is to certain climate variables or extremes: more sensitive systems will show larger changes in response to disturbance events. The sensitivity of key resources and sectors in the target area (e.g. specific crops and ecosystems, production systems, health, settlements) can be assessed by conducting a literature review and/or key informant interviews. In REDD+ project areas, forests are a key ecosystem for sensitivity analysis. A sensitivity analysis can also be performed for single species or resources of importance such as fish, rice, maize or water. Key questions include the following: 1. What are the temperature ranges for optimal productivity of the
resources species?
2. What is the required water input distributed in time and space for optimal productivity?
3. Beyond which temperature and water thresholds does the system become unproductive? When does the system reach a tipping point?
4. How well can the system tolerate and recuperate from climate extremes such as drought and heavy precipitation? What happens under repeated extreme events?
Tools and resources
Kropp J and Scholze M. 2009. Climate Change Information for Effective Adaptation: A Practitioner’s Manual. Eschborn, Germany: Deutsche Gesellschaft für Internationale Zusammenarbeit (GIZ) GmbH. http://www.giz.de/Themen/en/28938.htm
Climate Information Portal (CIP) by the Climate Systems Analysis Group, University of Cape Town, http://cip.csag.uct.ac.za/webclient/introduction. CIP maintains an extensive database encompassing observational climate data from Africa and Asia, as well as projections of future climate for all regions of the globe. All data are accessible through a user-friendly web interface.
WorldClim – Global Climate Data. http://www.worldclim.org/
Climatic Research Unit (CRU), University of East Anglia and Tyndall Centre for Climate Change Research. http://www.cru.uea.ac.uk/data; http://badc.nerc.ac.uk/view/badc.nerc.ac.uk__ ATOM__dataent_1256223773328276
PRECIS Regional Climate Modelling Software. Based on the Hadley Centre’s regional climate modeling system, it runs on a PC (under Linux) with a simple user interface, so that experiments can easily be set up over any region. http://www.metoffice.gov.uk/precis/intro
5. What other factors influence tolerance levels and sensitivity? What nonclimatic disturbances render the system/resource more sensitive?
These questions can be modified to examine the sensitivity of disease vectors and bacteria (e.g. malaria mosquitoes), the sensitivity of settlements to heavy precipitation (e.g. thresholds beyond which flood and disaster risks are augmented) and other issues that are of importance in a particular area. A sensitivity analysis can also be conducted for entire livelihood portfolios (e.g. livelihood sensitivity matrix). For certain resources or ecosystems, additional climate parameters such as relative humidity and solar radiation might be important (e.g. coconut production and its dependence on the number of hours of sunshine).
Sensitivity of key resources may be discussed during stakeholder consultations. It might be necessary to revisit this step after the consultations to explore the sensitivity of any other key resources or ecosystems that the stakeholders mention.
Box 2. Sensitivity in Sogod (PH)
Livelihoods in the upland barangays1 of Sogod largely depend on the production
of coconut, abaca, rice, root crops and vegetables and on forest resources. Both agricultural production and forests are sensitive to variability in climate, extremes and longer-term climate change. Rice is very sensitive to high temperatures, especially at critical development stages, and to both increases and decreases in precipitation. Abaca (Musa textilis) and banana need abundant rainfall with production decreasing at temperatures above 27 °C, whereas cassava thrives in drought conditions and at 32 °C. Sweet potato is drought resistant but cannot tolerate waterlogging. Coconut cannot tolerate prolonged cloud cover. Tropical rainforests are prone to drought-related mortality and fires during El Niño events. The degree of sensitivity is influenced by other destabilizing pressures and feedback loops. For example, forests are more sensitive to drought events and fires if they are degraded or logged. Crops are more sensitive to increases in temperature, precipitation, drought and pest outbreaks if they are produced through monocultures and in degraded soils, rather than in more complex systems or agroforestry. Poor sanitation, pollution, and riverbank and watershed degradation increase the severity of flooding events and the proliferation of bacteria and vectors during heavy precipitation. Enhanced and sustainable environmental management can decrease sensitivity, and ultimately impacts, in almost all sectors and systems.
1 A barangay is the lowest administrative level in the Philippines, comparable to villages in
other countries.
(c) Adaptive capacity
Adaptive capacity is generally associated with the robustness of a socioecological system to disturbance, and its capacity to adapt to actual or anticipated changes, whether exogenous or endogenous (Plummer and Armitage 2010). The adaptive capacity of social systems is determined by the suite of available resources and the social processes and structures through which they are employed and mediated. One of the most important factors shaping the adaptive capacity of individuals, households and communities is their access to and control over natural, human, social, physical and financial resources.
A preliminary analysis of adaptive capacity can be conducted through a literature review and assessment of relevant statistics (e.g. number of health centers in a particular area, number of people with primary and secondary education, etc.). This analysis can only be preliminary at this stage because it needs to be complemented by information from stakeholder consultations.
Resources affecting adaptive capacity include:
• irrigation infrastructure and weather stations (physical)
Tools and resources
weADAPT: Developing a livelihood sensitivity matrix. http://weadapt.org/knowledge-base/ vulnerability/appendix-a-developing-a-livelihood-sensitivity-matrix
CRiSTAL Community-based Risk Screening Tool – Adaptation and Livelihoods: CRiSTAL is a desktop tool for Windows that assesses the impacts of a project on local determinants of vulnerability and exposure so that it can better foster climate adaptation. It can be used for exploring the sensitivity of key livelihood resources. Under development is a new version of the tool – CRiSTAL Forests – that will address specific issues that are relevant for forest ecosystems and forest-dependent communities, including REDD+. http://www.iisd.org/cristaltool/download.aspx
Climate Change Sensitivity Database: This digital database summarizes inherent climate sensitivities for species and habitats of concern throughout the Pacific Northwest. Although the species and ecosystems included might not be relevant for tropical and subtropical countries, the database can provide useful guidance on important factors to consider when analyzing sensitivity. http://climatechangesensitivity.org/
Climate Impacts: Global and Regional Adaptation Support Platform (ci:grasp): Ci:grasp is a web-based climate information service structured around impact chains, which demonstrate how a given climate stimulus propagates through a system of interest via the direct and indirect impacts it entails. http://cigrasp.pik-potsdam.de/
• community savings groups, farmer organizations and social networks (social) • reliable freshwater sources and productive land (natural)
• micro-insurance and diversified income sources (financial) • knowledge, skills and education (human).
For example, farmers who have access to water for irrigation have greater adaptive capacity than farmers who depend solely on rain, because the former group’s cropping systems are more robust to decreases in precipitation (provided the irrigation water sources are reliable). Similarly, communities with access to forest and tree resources might be able to adapt better to climate extremes than those without, because, for example, they can use NTFPs for supplementary nutrition and income all year round if crop harvests are smaller than expected (again, provided that the forest resources are managed sustainably).
Adaptive capacity can sometimes be the most difficult component of vulnerability to assess because the presence of resources does not necessarily translate into greater adaptive capacity. This is especially the case if access to resources is restricted or if special knowledge, tools or market or social networks are needed to transform resources into welfare-bearing goods. Stakeholder consultations are therefore an essential step in gaining a holistic understanding of adaptive capacity. In the context of REDD+, understanding current and future access to and uses of forest goods and services under different scenarios is crucial.
(d) Concluding remarks on vulnerability analysis
Adaptation actions are usually planned to address one or several elements of this framework. They may aim to minimize underlying causes of vulnerability (e.g. by ensuring access to resources and healthcare) or to modify exposure to, and the effects of, a specific climate hazard (e.g. building barriers to protect settlements against coastal storms). They can be either incremental or transformational. Incremental adaptations are extensions of existing actions and behaviors to reduce vulnerability, whereas transformational actions are those that are adopted at a much larger scale or intensity and/or are truly new to a particular region or system (Kates et al. 2012). However, climate hazards and their impacts rarely occur in isolation. Systems are usually under pressure from a multitude of interacting stressors, resulting in compound impacts and feedback loops of vulnerability.
Step 2: Participatory workshops
Any institutionally led adaptation strategy will need to include community-based measures to increase the sustainability of adaptation into the future. Research findings suggest that top-down measures may not lead to local resilience in
Box 3. Adaptive capacity in Sogod (PH)
In the upland barangays of Sogod, natural resources are available but people do not have secure access to them. People use forest resources to cope with disturbances (e.g. selling rattan products to supplement their income) but they have no proactive resource management strategies for enhanced adaptation over time. They have little diversification of activities within and outside of agriculture, as evidenced by the socioeconomic baseline study for piloting REDD+ activities in Southern Leyte. Furthermore, the area has little in the way of agricultural infrastructure, such as grain storage or irrigation facilities, and no weather stations are in the proximity of Sogod, but these features could help prevent crop failure, income loss and food insecurity. Future yield losses and crop failure could also lead to heavier exploitation of vulnerable forest resources that lack management. Although intercropping of abaca and other crops with fruit and timber trees can be beneficial in terms of both decreased system sensitivity and economic diversification, agroforestry systems are not widespread. Mono cropping is the dominant system in the farm parcels of Sogod, as in Southern Leyte more broadly. Farmers’ reluctance to plant trees outside of their occasional participation in government reforestation programs may be attributed, at least in part, to the insecurity of their tenure over the land. Other reasons inhibiting farmers from planting trees include general unavailability of land, their need for immediate income streams rather than the longer-term returns from planting trees, and the perception that trees are detrimental to coconut production because of shading and nutrient competition.
Most barangays also lack social organizations. Of the seven barangays that participated in the community workshop, only two have a People’s Organization (San Vicente and Kauswagan), and only one (Benit) has a microfinance institution in the vicinity. Similarly, almost all of the respondents to the REDD+ socioeconomic study reported that they are not aware of the existence of any credit and/or related financial services in the barangays, noting that only high-interest, informal sources of credit are available.
the long term; on the other hand, bottom-up measures require some form of support from the top to maximize their effectiveness (Amaru and Chhetri 2013). Multilevel stakeholder consultations are an essential first step in this direction. For the two case studies, the following steps were taken to establish stakeholder groups and participatory workshops. It must be remembered, however, that there is no uniform approach to stakeholder engagement and activities may be tailored to the particular situation and culture.
(a) Identifying stakeholders and organizing the workshop
To capture community values and priorities and to understand environmental challenges, a necessary first step is to define the goals of workshop activities and determine which stakeholder groups will participate in the workshops. The outcomes of this step will depend on the resources, timeframe and availability of data. The goals of a study using SROI methodology may differ according to the context, the status of REDD+ activities, the awareness of the stakeholders and the available data.
An initial list of potential workshop participants can be developed by contacting a member of the REDD+ project team, as many REDD+ projects have already identified their stakeholder groups. Although participants should be chosen randomly, especially in large REDD+ projects, it is important to ensure that the workshops involve members of socially differentiated groups within the
Tools and resources
Graham K. 2011. REDD+ and Adaptation: Will REDD+ Contribute to Adaptive Capacity at the Local Level? London: Overseas Development Institute. http://www.odi.org.uk/ publications/6147-redd-adaptation-local-adaptive-capacity
Jones L, Ludi E and Levine S. 2010. Towards a Characterisation of Adaptive Capacity: A Framework for Analyzing Adaptive Capacity at the Local Level. London: Overseas Development Institute. http://www.odi.org.uk/resources/docs/6353.pdf
Sustainable Livelihoods Framework. A framework to examine livelihood assets and capital (human, natural, financial, social, physical), livelihood strategies and outcomes, and the associated structures and processes that increase or decrease vulnerability. It was developed by the Sustainable Rural Livelihoods Advisory Committee, building on earlier work by the Institute of Development Studies (among others). http://www.eldis.org/vfile/upload/1/ document/0901/section2.pdf
community, including any marginalized groups, to acquire a wide range of
perspectives. Equal gender representation is essential (see CCAFS and FAO (2012) for examples of random sampling strategies for including gender differentiated groups), but it is worth also considering economic status, ethnicity, age, education, geographic distribution, profession and any other locally important differentiations. Other factors, such as location, may also affect the selection of participants (see Box 4). For instance, in Sogod, participants were chosen because of their proximity to the forest and heavy dependence on forest resources. When setting up participatory workshops, a conscious effort should be made to include people who are not participating in REDD+ projects, to capture their valuable perspectives too (see Step 3).
A list of participants cannot be completed or finalized at the beginning of the analysis. Some stakeholder groups, especially at a broader scale, might need to be added or removed after the adaptation interventions are defined depending on whether they are influencing intervention outcomes or are affected by them. It should be noted that the exclusion or inclusion of certain stakeholders in the analysis will affect the overall effectiveness of the adaptation initiative during implementation.
Community consultations can be conducted through a 2- or 3-day participatory workshop with up to 40–50 participants. Ideally, community-level consultations should be conducted in all villages that are expected to be affected by REDD+ project activities. Grouping several communities that are close to each other is also an option if they have similar characteristics.
The main objectives of the workshop are:
• to determine the resource base and available assets • to identify the underlying causes of vulnerability
• to understand how climate challenges fit within the broader challenges faced by the community
• to incorporate community values and priorities into the selection, planning and evaluation of adaptation interventions.
Particular focus is given to forest and tree resources and their role in coping and adaptation strategies. Activities include a combination of large group exercises and breakout groups. Breakout groups can be mixed, but can also be formed based on gender and other social differentiations if necessary and appropriate for a particular context. Even if workshops have fewer participants (e.g. 20–30), it is recommended that at least two facilitators be available to help guide the breakout groups.
(b) Exploring values, assets and challenges
Six main activities were conducted during the community workshops for the two case studies (listed in Box 5). Activities can be modified or added, according to the context.
Box 4. Selecting workshop participants in Malinau (ID) and Sogod (PH)
REDD+ activities may target a small number of forest-dependent communities (as with Setulang Village in Malinau District, Kalimantan, Indonesia) or they may encompass several municipalities (as with the activities in Southern Leyte Province, the Philippines).
In the case of Malinau, defining the boundaries for local-level consultations was straightforward because, at the time of the case studies, most community-level REDD+ activities were focusing on Setulang.
In the case of Southern Leyte, a specific area of focus had to be selected because of the limited time and resources available to conduct the community workshops and the vast size of the total REDD+ pilot area (more than 40,000 hectares over five municipalities). The catchment area for community consultations was therefore narrowed down to one municipality – the municipality of Sogod – and more specifically to the upland areas. The community workshop was conducted with representatives from seven upland barangays. One reason for selecting Sogod was that no climate change adaptation studies had previously been conducted in the municipality.
A range of participatory research methods for assessing vulnerability are available. One very effective tool is participatory mapping (Figure 5). Community mapping can also be used to identify hazards and challenges. Alternatively, during breakout groups, participants can discuss assets/values and challenges, jotting them on Post-It notes to be clustered in groups by the facilitators. The mapping exercise can also be useful for visualizing the location of the challenges and the interrelationships between them, as well as for discussing the available resources and existing coping mechanisms. It is important to note that the discussion should cover not only climate hazards and challenges, but also other challenges and hazards in general, whether environmental, social or something else, in order to see how the climate issues fit within the other issues of concern in the community. Suggested questions for breakout groups during participatory mapping sessions, for eliciting information on community-level values, assets, hazards and challenges, are listed in Box 6.
(c) Identifying priority adaptation interventions
Once the values, challenges and assets have been identified, the next part of Step 2 is to rank adaptation interventions in order of perceived importance. This process has two parts: (a) future visioning and voting, and (b) backcasting and forecasting.
Box 5. Activities in initial participatory workshop
1. Identify community values and assets through breakout group discussions or community mapping.
2. Identify environmental and other challenges and rank them in order of priority through group discussions and voting.
3. Identify historical responses and coping strategies associated with the challenges and discuss their effectiveness.
4. Design and select priority adaptation interventions by discussing community members’ common future aspirations and through priority voting.
5. Plan priority interventions through forecasting or backcasting. 6. Identify the costs, benefits and overall impact of priority interventions
from the perspective of the community members, also in relation to forest management and REDD+, through breakout group discussions.
Figure 5. Map of the barangay showing important resources, challenges and hazards, and coping mechanisms. Photo by Gordon Bernard Ignacio/GIZ.
Box 6. Questions and steps for value and hazard mapping Values and assets
A. “What is important to you?”
“What do you value in the community?” “What assets are available?”
Important assets (natural resources, physical, financial, social assets such as networks and sharing groups, etc.) are marked on maps or Post-It notes. B. Facilitator clusters Post-It notes or asset categories from the maps. If using
maps, groups give short presentations before the clustering. Discussion with the whole group.
- How are assets and resources used? Who has access and when? - Which assets are abundant and/or easily available? Which are not? - Have there been any changes in availability over the years? - What about forest and tree resources?
C. Priority voting and ranking of asset clusters using dots or stickers. Why are certain resources of priority and others not?
Include discussion on priority voting for forest resources.
Hazards and challenges
A. In breakout groups:
“What hazards and challenges are you facing now or have faced in the recent past?”
For example, water access and quality, erratic rainfall, erosion, health challenges, conflicts, etc.
Draw these on the map or write them on Post-It notes.
B. Clustering in categories and group discussion with whole workshop (as above).
C. Priority voting and ranking of challenge category clusters (as above). D. Mind map of the linkages between the challenges resulting from the
discussion if time permits. Discussion points:
- Are there any trends or changes in the frequency of events over time? - What major changes has the community experienced?
- What are the effects of the hazards/challenges on what you value? What impact do they have on your life? How does this relate to priority ranking? - Are there any links between the hazards/challenges? Does one affect
the other?
Future visioning and voting
To plan and rank adaptation interventions in a context of multiple stressors, participants in the case study workshops were asked to envision a future where stressors and challenges are addressed in an integrated manner, with existing assets and resources mobilized wherever possible. Future visioning helps to assess what
Box 7. Resources and challenges in Setulang (ID) Resources
When asked to list and rank the resources (environmental, social, human, financial etc.) and assets of value in their community and assess their status (e.g. availability and accessibility), women and men gave different responses. Both women and men listed water, agricultural assets and human resources but with different rankings; men also mentioned social, financial and forest resources.
Rank Women Men
Resources Status Resources Status
1 Water River water has
deteriorated. Only water from Tane’ Olen spring is good.
Human Same statements as made by women’s group. 2 Human Diminishing as educated young people seek opportunities in big cities and do not return to Setulang.
Social Social bonding and cohesion is still strong. Easy to mobilize collective action. 3 Agriculture Harvest is decreasing
and although it is enough to cover needs, the surplus people are able to secure is diminishing.
Financial Some financial resources can be dispersed for community projects from village groups and government agencies but it is still not sufficient.
4 Water Amount of spring
water channeled to the village is inadequate — pipe is too narrow.
5 Forest Forest resources
currently in good state but worries about the availability for future generations.
people aspire to and how they envision their community after challenges have been resolved.
Future visioning was conducted in breakout groups through community mapping. Group representatives were asked to present their village maps for 2030 (or another timeframe depending on the planning horizon), explaining what has changed from the current situation. Components that emerged from all the maps of the future were clustered into groups and rephrased as adaptation statements (aspirations) for making strategies. Participants were then asked to give their priority votes to each aspiration cluster. Suggested questions to facilitate the visioning and planning exercise are listed in Box 8.
Backcasting and forecasting
Once adaptation aspirations have been voted on, they can be selected for strategic planning. Planning can be done through either backcasting or forecasting.
Backcasting was used in Sogod. Backcasting is a process of systematically moving backward from a desired future situation to the present by continuously asking: “what must we do to achieve this?” (Sova et al. 2012). In Sogod, backcasting and
Challenges
The community reduced a large number of challenges and hazards to a short list of eight priority challenges, ranked in the following order:
1. Tenure-related social conflicts with neighboring villages and concessions 2. Alcohol and drug abuse by the young
3. Abuse of political power 4. River pollution
5. Floods
6. Diseases (diarrheal, infectious, vector-borne) 7. Prolonged dry seasons
8. Illegal logging
Interestingly, even though floods, droughts and other environmental and climatic hazards are frequent in the area, people did not rank them as the most important challenges. People believed that they have the potential to cope well with these climate hazards (e.g. by elevating their houses, managing their forests, keeping a sufficient crop surplus and maintaining grain storage facilities on safe ground), whereas social challenges such as conflicts have a more profound impact both on their lives and on their overall ability to cope with all the other challenges.
Box 8. Questions and steps for future visioning and adaptation planning Aspirations and visions for the future
A. Breakout groups.
“What do you want your community to look like in the future?” (Imagining the community in 15–30 years from now (when challenges are addressed and/or capacity to cope with them is strengthened))
“What are you doing now that you were not doing before?” “What are you doing differently?”
“How has your life changed?” B. Groups give presentations.
Facilitator leads discussion that culminates in a list of key features/aspirations for the future grouped in clusters.
Include discussion on the future status and use of forest and tree resources. C. Voting and ranking of clusters.
Planning adaptation interventions
Could be done in two big groups (or smaller breakout groups if there is a large number of participants)
A. “How do we achieve our aspirations?”
Participants are encouraged to think about the challenges and assets listed during the previous day as possible inputs.
a. What resources, assets and knowledge will be needed, and when? b. What additional resources are needed?
c. How are activities situated in space and time? d. What are the inputs and outputs in each step? e. What are the costs and benefits?
B. Groups report back, presenting their planning. Discussion with whole workshop.
C. Discussion with whole group.
a. Discuss all inputs and outputs across space and time (e.g. for establishment, harvesting, maintenance, etc.)
b. What impact will this strategy have on everyone in the community? How will it change life in the community?
c. Discussion should be facilitated in such a way as to be able to identify quantifiable proxies associated with each impact (see Step 4). For example, a proxy of impact could be fewer visits to the medical clinic because of improvements in health.
d. What additional inputs might be needed to tackle challenges? What are the risks and associated management strategies? What are the possible unintended consequences or negative impacts?
D. Priority voting and ranking of the main impacts if time allows (Figure 6). Community assesses the relative importance of each impact (e.g. more time for children to attend school, better farming, better health, etc.).
planning were conducted using a large sheet of paper and Post-It notes. The desired future characteristics were placed on the right side of the paper, with the current situation and available assets and resources placed on the left. Participants were asked to consider all the positive (intended) and negative (unintended) impacts that might occur during each phase of implementation.
In Setulang, planning was done through forecasting. Forecasting involves ‘predicting’ all the intended and unintended
consequences, as well as the costs and benefits, of an intervention by systematically moving forward from the present to the desired future situation in progressive milestones. The list of priority community assets was kept visible during the planning exercise to foster discussions on how best to mobilize them during the implementation process.
Communities can also work toward developing a theory of change associated with the priority adaptation strategy or strategies. A theory of change illustrates how a group of early and intermediate actions lays the foundation for long-term results and impacts. It clearly articulates the assumptions about the process through which change and impact will occur, and specifies the ways in which all of the required actions related to achieving the desired impact will be implemented. Participants are asked to predict exactly who or
Figure 6. Priority voting on adaptation aspirations in Setulang (ID). Photo by Emilia Pramova.
Box 9. Priority adaptation interventions and aspirations in Setulang (ID)
A number of community aspirations emerged from the future visioning exercise. These were then grouped into strategy clusters and Setulang villagers prioritized those interventions that they can start implementing by mobilizing assets already present in the village. Three strategy clusters were discussed: (i) agricultural development; (ii) management of the protected forest area and livelihood diversification; and (iii) village area management.
The agricultural development strategies have multiple objectives. One important objective is to develop new fields with good economic opportunities to offer the young an attractive alternative to migrating to the city. Planting a greater variety of crops, beyond rice and cassava for example, is also expected to enhance livelihoods and food security under the threat of droughts and floods. The development of rubber, fruit,
coffee and cocoa production through agroforestry systems is expected to increase overall resilience and sustainability under climate change. Rubber was particularly emphasized, as several Setulang villagers have observed the good economic returns that other villages have had from selling latex.
The management of the protected forest area of Setulang (Tane’ Olen) encompasses aspirations for various tourism, resource management and alternative livelihood activities. The villagers wish to increase the economic returns of managing Tane’ Olen sustainably, while preserving biodiversity to create resilient ecosystems and their own cultural practices. Interventions identified for achieving this goal included ecotourism, NTFP resource inventories and sustainable management. One important NTFP is rattan, which the Setulang community uses to make traditional handicrafts and household utensils (e.g. mats, baskets, etc.). These handicrafts themselves are a tourist attraction, as the Dayak Kenyah use distinctive and beautiful patterns, and a handicraft market could be created to foster alternative livelihoods and communication of Dayak culture to visitors.
The strategies related to enhancing village management are linked to multiple objectives and expected benefits. The construction of a new longhouse, for example, which will link to the objective of having new housing areas on higher ground, will help the villagers deal with the negative impacts of flooding events. The longhouse will serve as temporary housing not only for people affected by flood but also for tourists, and as a hub for cultural activities.
Example of intervention: Rubber agroforestry
Rubber agroforestry can involve intercropping of rubber trees with locally important fruit trees such as rambutan (Nephelium lappaceum), durian (Durio zibethinus) and petai (Parkia speciosa), as well as rice during the first 1–2 years. The community perceives improved overall economic welfare, achieved through both livelihood diversification and a cash crop (in this case rubber), as the most important direct benefit. Increased resilience to climatic hazards is also appreciated, as rubber agroforestry can withstand flood and drought pressures better than annual crops (e.g. rice) and will also contribute to diversifying the portfolio of crops available for cash and direct consumption throughout the year.
Furthermore, rubber agroforestry is a means of rehabilitating degraded land that would normally be left fallow for some time. As managing rubber agroforestry is not perceived as very time consuming, stakeholders pointed out the additional benefit of having free time to undertake other agricultural or livelihood activities. Another important benefit mentioned by the Setulang community is that the development of rubber production will give young people a reason to stay in the village because it would be an attractive economic activity for them.
In terms of costs, in addition to inputs such as seedlings and labor, time and resources will be required to learn rubber agroforestry techniques. The community members also see marketing and selling of latex as easy, as buyers have approached the villagers in the past.
what will change, by how much, and when and where, at every single step toward the future; they are also asked to explain how they expect a change to happen and why it might happen in that way. This exercise can be fairly complex, despite its similarity to forecasting or backcasting planning, so skilled facilitators will be needed to guide the groups.
Tools and resources
Dazé A, Ambrose K and Ehrhardt C. 2009. Climate Vulnerability and Capacity Analysis Handbook. CARE International. Includes field guides for applying participatory tools in community-based adaptation planning. http://www.careclimatechange.org/cvca/CARE_ CVCAHandbook.pdf
Anderson AA. 2006. The Community Builder’s Approach to Theory of Change: A Practical Guide to Theory Development. Aspen Institute Roundtable on Community Change. http://www. aspeninstitute.org/sites/default/files/content/docs/rcc/rcccommbuildersapproach.pdf Sova C, Chaudhury A, Helfgott A and Corner-Dolloff C. 2012. Community-Based Adaptation Costing: An Integrated Framework for the Participatory Costing of Community-Based Adaptations to Climate Change in Agriculture. Working Paper No. 16. Cali, Colombia: CGIAR Research Program on Climate Change, Agriculture and Food Security (CCAFS). http://ccafs.cgiar.org/ sites/default/files/assets/docs/ccafs-wp-16-psroi.pdf
Step 3: Analysis of adaptation interventions and REDD+
objectives
(a) Consulting with stakeholders at various scales
Depending on the area, context and the priority adaptation interventions selected by the community, consultations with a range of stakeholders could add value. Stakeholders might include local and regional government agencies, nongovernmental organizations, traditional people’s organizations and community groups, the private sector (e.g. rubber-processing industry), technical experts in each field (e.g. forest management, agriculture, agroforestry) and research institutions. Consultations with experts, local partners and institutions, and other stakeholders within and outside REDD+ projects can be useful for refining the technical design of the adaptation interventions suggested by the communities in Step 2; for example, they might provide more precise estimates of inputs and outputs for maximum productivity of an agroforestry intervention. Consultations can also provide better understanding of the costs, benefits, challenges, opportunities and risks associated with the implementation of the strategies, especially in relation to forest management and REDD+. The adaptation interventions can be further refined through information from the