HAL Id: hal-03048905
https://hal.archives-ouvertes.fr/hal-03048905
Submitted on 9 Dec 2020HAL is a multi-disciplinary open access archive for the deposit and dissemination of sci-entific research documents, whether they are pub-lished or not. The documents may come from teaching and research institutions in France or abroad, or from public or private research centers.
L’archive ouverte pluridisciplinaire HAL, est destinée au dépôt et à la diffusion de documents scientifiques de niveau recherche, publiés ou non, émanant des établissements d’enseignement et de recherche français ou étrangers, des laboratoires publics ou privés.
Blockholder Leverage and Payout Policy: Evidence from
French Holding Companies
Sereeparp Anantavrasilp, Abe de Jong, Douglas V. Dejong, Ulrich Hege
To cite this version:
Sereeparp Anantavrasilp, Abe de Jong, Douglas V. Dejong, Ulrich Hege. Blockholder Leverage and Payout Policy: Evidence from French Holding Companies. Journal of Business Finance and Account-ing, Wiley, 2020, 47 (1-2), pp.253-292. �10.1111/jbfa.12415�. �hal-03048905�
1045
“Blockholder Leverage and Payout Policy:
Evidence from French Holding Companies”
Sereeparp Anantavrasilp, Abe de Jong,
Douglas V. DeJong and Ulrich Hege
October 2019
Blockholder Leverage and Payout Policy:
Evidence from French Holding Companies
*Sereeparp Anantavrasilp1 Abe de Jong2 Douglas V. DeJong3 Ulrich Hege4
October 2019
Abstract
This paper focuses on dominant owners’ use of leverage to finance their blockholdings and its relationship to dividend policy. We postulate that blockholder leverage may impact payout policy, in particular when earnings are hit by a negative shock. We use panel data for France where blockholders have tax incentives to structure their leverage in pyramidal holding companies and study the effect of the financial crisis in 2008/2009. We find no difference in payout policy and financial behavior during the 1999 to 2008 period between firms with levered owners and other firms. However, in the years 2009 to 2011 following the crisis, dividend payouts increase in proportion to pyramidal debt of dominant owners. We inspect pyramidal entities individually and find that on average only 60% of dividends are passed through to the ultimate owners, with the rest predominantly used to meet debt service obligations of the pyramidal entities.
Keywords: payout policy, blockholders, concentrated ownership, leverage, blockholder private leverage, margin loans, insider pledging, pyramids, financial crisis.
JEL classification: G32, G34, G35.
1 EY and Department of Finance, Rotterdam School of Management, Erasmus University, PO Box 1738,
3000 DR Rotterdam, Netherlands.
2 Department of Banking and Finance, Monash University, 900 Dandenong Road, Caulfield East, 3145
Victoria, Melbourne, Australia and Department of Finance, Rotterdam School of Management, Erasmus University, PO Box 1738, 3000 DR Rotterdam, Netherlands.
3 Tippie College of Business, University of Iowa, Iowa City, IA 52242, USA, e-mail:
douglas-dejong@uiowa.edu
4 Department of Finance, Toulouse School of Economics, 21 Allee de Brienne, 31015 Toulouse Cedex 6,
France, e-mail ulrich.hege@tse-fr.eu.
* The authors are grateful for helpful comments from Nittai Bergman, Eli Berkovitch, Henrik Cronqvist,
Ingolf Dittmann, Edith Ginglinger, Ronen Israel, Meziane Lasfer, Erik Lie, Roni Michaely, Giovanna Nicodano, Urs Peyer, Kristian Rydqvist, T.J. Wong, and Yishay Yafeh and from an anonymous referee, as well as from seminar participants at Aalto, CUHK, ESMT, HEC Paris, IDC Herzliya, Tilburg University, and at various conferences. An earlier version (based on a different sample period prior to the global financial crisis) was circulating under the title “Blockholders and Leverage: When Debt Leads to Higher Dividends”. The authors acknowledge excellent research assistance from Mounir Bendouch. Douglas DeJong thanks the Rotterdam School of Management, Erasmus University and CentER, Tilburg University for their support. Ulrich Hege thanks the European Research Council, ERC FP7 grant No.
312503-SolSys, the ANR, grant ANR-17-EURE-0010 under the Investissements d'Avenir program, and TSE-P for funding.
1 1. Introduction
Blockholders sometimes use leverage to finance their dominant equity stake in publicly listed companies. This paper explores the use of private leverage by controlling shareholders and the effects of this leverage on company policies, dividends and investment. To the best of our knowledge, this question has not been addressed before.5 The extensive literature on the role of blockholders implicitly assumes that owners use deep pockets to finance their controlling share blocks; blockholders, however, use debt financing for a number of reasons, such as wealth limitations or tax optimization.6 The use of blockholder leverage, in hidden or transparent form, has recently come under scrutiny in a number of high-profile cases. For example, Casino, one of the largest French food retailers, was under attack by short sellers since 2018 over concerns about high leverage in its pyramidal holding companies, forcing it to sell assets and to seek limited bankruptcy protection in May 2019 (Financial Times, 31 July 2019). Other French groups also made headlines in recent years over blockholder leverage,7 as did companies in other jurisdictions including the U.S., even though the institutional context is often substantially different from that explored in our paper.8
In our investigation, we focus on the link between blockholders’ debt exposure and the dividend payout policy in times of crisis, when the need of the dominant owner for cash dividends to service debt may influence corporate decisions. We find that, in difficult times, companies exposed to blockholder leverage are reluctant to cut dividends.
Data availability presents a major challenge given the privacy of information on personal debt, despite a renewed regulatory interest to understand the consequences of debt financing (Financial Stability Board, 2015). We focus on France because much of the leverage of large shareholders is in fact structured in holding vehicles. France’s specific institutions and personal tax rules convey considerable advantages if levered owners organize their leverage in these holding companies. Tax costs of using holding companies are negligible, and tax rules discourage the use of
5 Dou, Masulis, and Zein (2019) show that insider share pledging may lead to reduced risk-taking.
6 For example, according to court filings, Ronald S. Lauder, the owner of a large block in cosmetics and fashion group Estée
Lauder Companies, uses debt apparently for tax motives: “Nearly $400 million of that stock [worth $600 million] is pledged to secure various lines of credit. Many financial planners consider it imprudent for principal shareholders in a company to borrow against their stock. But it remains a popular way for wealthy taxpayers to get cash out of their holdings without selling and paying taxes” (New York Times, Nov. 26, 2011).
7 In August 2019, the controlling blockholder’s shares in publishing and retail conglomerate Lagardère were reportedly worth
less than the personal bank loans secured by them (Financial Times, 27 August 2019). When Carrefour, a large multinational retailer, experienced floundering sales in 2011, observers urged it to cut its dividend, but Nomura analysts cautioned: “Since Carrefour’s core shareholders’ (Blue Capital) investment in Carrefour is 80 percent debt financed, we question whether they can accept a sharp reduction in dividend.” (Reuters November 17, 2011, http://www.reuters.com/article/2011/11/17/us-carrefour-analysis-idUSTRE7AG0M220111117). Telecom operator Altice, owner of Cablevision and other US assets, came under duress in 2017 over concerns about its leverage and the use of blockholder leverage by its founder.
8 Examples include Steinhoff International of South Africa, engulfed in an accounting scandal in 2017 that led to a 90% share
price drop and a fall in the value of the largest shareholder’s equity to 25% of the blockholder loan; WorldCom whose CEO Bernie Ebbers had repeatedly used margin loans on his personal equity before the company collapsed in 2001; Portuguese bank Espirito Santo that similarly collapsed in 2014; and Chinese manufacturer Geely when it acquired a large equity block in Daimler-Benz in early 2018 on margin loans.
2
pyramidal mixed companies that combine financial holdings with operating investments. Furthermore, holding companies are quite transparent, i.e., we observe ownership structure, financial structure and payout policy of privately-owned as well as publicly listed companies, including holding companies. Thus, while we cannot observe the use of private leverage comprehensively, fiscal incentives and the relative transparency of holding vehicles provide a starting point to investigate its consequences. In France, a large majority of listed firms are controlled by dominant owners, as is the case in a majority of countries (e.g., LaPorta, Lopez-di-Silanes, Shleifer, 2000; this observation does not hold for the U.S., the UK, and certain other countries).
We begin by carefully mapping the use of pyramids and pyramidal leverage in France, our proxy for the use of private leverage by controlling blockholders. A majority of listed companies are characterized by shareholder concentration. We find that a majority of publicly listed companies are organized as pyramids. We show the phenomenon of pyramidal debt to be wide-spread: a majority of pyramidal holding companies use some (albeit moderate) leverage, and pyramids lead to a mean increase of the dominant owner’s leverage exposure by 12.1% or 35.2%, depending on which of our two measures of pyramidal leverage is used. On the whole, we find that the use of pyramidal debt is wide-spread, but that blockholder leverage on average is moderate.
We then investigate the impact of blockholder leverage on dividend payouts. We do so in two steps. We first analyze dividend payouts in our panel by focusing on the cross-sectional comparison, controlling for all the usual variables that are known to influence payout, and then look at the shock of the financial crisis starting in 2008. In our first investigation, the cross-sectional panel study prior to the financial crisis, we find no difference in payouts between companies with levered blockholders and those without blockholder leverage. This finding may be due to the fact that French holding companies overall make a relatively conservative use of leverage, according to our data. From a strict econometric point of view, this finding offers reassurance that we are looking at similar sets of firms in the treatment and control sample when exploring the crisis impact. An important caveat is that controlling blockholders could also use other sources of personal income (that we do not observe) to pay for holding company debt or their consumption, and not just the dividends received from the companies they control; we do not observe, however, equity injections in holding companies that would indicate such substitution effects.
However, we find strong support for the hypothesis that blockholder leverage affects payout policy in difficult times. The 2008/2009 financial crisis was an exogenous shock affecting the global economy in almost all developed economies that led to severe cuts in dividend payouts in listed companies worldwide and also in France (David and Ginglinger, 2016). Crucially, however, the shock should affect companies differently according to the dominant blockholder’s exposure to private blockholder leverage; we use this heterogeneous intensity of reaction to
3
the treatment (the financial crisis) for our identification. We find that firms with pyramidal leverage maintain high dividend payouts even when cash flows are plummeting and peers are cutting their payouts.
To look for additional evidence on the causal link between blockholder leverage and the difference in crisis-induced payout behavior, we take a closer look at the flow of funds within pyramids for additional evidence that payout decisions are explained by pyramidal debt. Inspecting pyramids on an entity-by-entity basis, we find that the fraction of dividends consumed in each holding company and not passed on to the next entity increases strongly in our measures of the importance of debt service in that holding company. Dominant owners ultimately receive less than 60 percent of the cash that operating companies make available to them, a fraction that decreases strongly in our measures of pyramidal debt.
Finally, we consider the robustness of our finding and extensions. We analyze the consequences of blockholder leverage for the real policies of the company, but do not find that a dividend increase triggered in times of duress by a blockholder’s leverage has a measurable effect on corporate investments or risk-taking. We also demonstrate the robustness when using more conservative measures of pyramidal debt, explore Almeida and Wolfenzon’s (2006) theory of dividend payouts in pyramids, and take into account double voting rights that in France may considerably enhance the discrepancy between voting and cash flow rights. None of these robustness checks alter our main findings.
To the best of our knowledge, our paper is the first to attempt to study the impact of the private leverage of dominant shareholders via holding company debt or similar vehicles. A similar issue arises when dominant owners use margin loans where the equity stake serves as collateral (also known as insider pledging of company stock), as our introductory examples show; unlike holding company debt, however, these loans are rarely observable to researchers. Our paper is related to various strands of the literature that we discuss in more detail in the next section. It is obviously related to the large literature on payout policy, in particular to work on payout policy in companies with dominant blockholders. This literature is characterized by two conflicting hypotheses, expropriation vs. substitution. Our paper adds to this literature with its analysis of the role of blockholders’ private leverage. Our paper is also related to literature on payout policy and shareholder-bondholder conflicts, in particular for firms close to financial distress. Our paper contributes to this literature with the insight that the private leverage of blockholders may exacerbate shareholder-bondholder conflicts in times of financial distress. Finally, we contribute to the papers on financial structure and payout policy in pyramidal structures with the insight that blockholder leverage may be an important determinant of payout decisions in times of financial distress.
The paper is organized as follows. Section 2 presents the literature and discusses our hypotheses. Section 3 describes the study’s design and data. Section 4 outlines our main results. Section 5 presents further evidence on how
4
dividends are passed through pyramidal entities. In Section 6, we look at various robustness tests and extensions, and Section 7 concludes.
2. Literature and Hypotheses
We briefly discuss the various strands of the literature to which our paper is related, on payout policy and blockholders, on shareholder-creditor conflicts under financial duress, and on pyramids.
Regarding the role of blockholders in corporate payout policy, existing work supports two contrasting views on the question whether the presence of large owners should lead to lower or to higher dividend payouts compared with widely held companies. The first view (sometimes referred to as the expropriation hypothesis) argues that the level of payouts is lower since the dominant shareholder gets only a fraction of the cash benefits compared with her exclusive benefits of control over retained earnings. This effect should increase in the discrepancy between control and cash flow rights (Burkart and Lee, 2008; Claessens et al., 2002; Adams and Ferreira, 2008). There is substantial evidence supporting this view (e.g., La Porta et al., 2000). In the alternative view, dominant owners commit to a stable dividend level in order to offset market doubts about expropriation risk. According to this view (dubbed the substitution hypothesis by La Porta et al., 2000), the positive stock market value effect dominates the potential benefits from retained earnings. Faccio, Lang, and Young (2001) present empirical evidence supporting this view. In light of these ambiguous hypotheses and tests, it seems fair to summarize that there is no dominant explanation on the impact of ownership concentration on payout policy.
Our paper is also related to the literature on payout policy and shareholder-creditor conflicts. According to standard capital structure arguments, dividend payments can be used to expropriate wealth from debt holders by increasing a firm’s net debt and hence making its debt riskier (Allen and Michaely, 2003). DeAngelo and DeAngelo (1990) show empirical evidence that firms in financial distress are reluctant to cut dividends. Chu (2017) finds that firms reduce dividend payouts when blockholders and important lenders internalize the negative value effects that dividend payouts create for lenders and, hence, mitigate shareholder-creditor conflicts.9 Chu (2017) also finds that this mitigation is particularly pronounced when firms are in financial distress. Gilje (2016) presents evidence, using exogenous leverage shocks following commodity price jumps in the oil and gas industry, in particular, for purposes of identification, that firms with heightened shareholder‐creditor conflicts following sudden leverage increases take less risk in their capex spending.
5
In spite of our focus on corporate holding companies, the relationship of our paper to the literature on pyramids is rather limited. In France, holding companies are typically private vehicles of blockholders with assets dominated by the equity stake in a single listed company; they exist for reasons mainly based on taxes (see the next section) that seem to suggest that the presence of a holding company can lead to higher dividend payouts.10 By contrast, the literature on pyramids mainly focuses on diversified business groups or conglomerates organized under umbrella holding vehicles. For example, Almeida and Wolfenzon (2006) argue that diversified business groups organize capital accumulation through a listed holding company as a substitute for capital markets with frictions, and argue that listed companies in such pyramidal structures are likely to have lower payouts and retained earnings funding investments in other business ventures.11
Besides the various strands of the literature discussed above, prominent general theories on capital structure and corporate payouts provide guidance when formulating hypotheses for our analysis of the payout consequences when dominant owners use private leverage to fund their equity stakes, in particular theoretical arguments on the role of debt to force companies to disgorge cash (e.g., Jensen, 1986) and the conflicts surrounding and consequences of financial distress (e.g., Myers, 1977). The dominant shareholder must assure the solvency of her holding vehicles, and she will use the dividend payout as a source of funding to service her debt. As long as the dividends paid by the operating company are sufficient to cover the owner’s pyramidal debt, pyramidal debt should not affect payout policy. However, if the level of pyramidal debt is high, then we expect the dominant owner to push for higher dividends. While this effect should be present only for highly levered owners, we expect it be more widely observable in the case of an adverse financial shock to the operating company. Then, leveraged ownership creates a disparity between the dominant owner’s use of cash and the needs of the company and other shareholders and potentially heightens shareholder-creditor conflicts. Therefore, we postulate that dividend payouts should increase in the use of pyramidal debt by dominant owners: Pyramidal debt has a positive effect on dividend payouts when
operating company cash flow is hit by an adverse financial shock.
10 Holding companies can be used as a tax shelter shielding dividends from personal income tax. Given tax neutrality of
pyramids (as is the case in France), pyramidal structures can then accommodate diverging dividend preferences: dividends can be paid to cater to dispersed shareholders, while dominant owner with lower cash preferences can avoid immediate taxation.
11 There is relatively little prior work on payouts and capital structure in pyramids. Gopalan, Nanda, and Seru (2007) show that
in Korean business groups dividends are used to finance investments in new subsidiaries. A small number of papers address the question how business groups allocate debt between parent firms and subsidiaries (Bianco and Nicodano, 2006; Luciano and Nicodano, 2014) from the perspective of the internal capital market of the group. Bertrand, Mehta, and Mullainathan (2002) document that in business groups wealth is transferred to controlling shareholders. None of these papers investigates the link between pyramidal debt and dividends.
6
3. Holding Companies in France: Background, Methodology and Summary Statistics 3.1 Institutional Background on Holding Companies in France
France presents an ideal laboratory to investigate the role of pyramidal leverage in the relationship between large and small shareholders. France is a developed market, with the largest percentage of foreign stock ownership among the large European economies, and with a high degree of ownership concentration in listed firms. Structuring a large equity block in a holding vehicle, i.e. creating a pyramid, offers several potential benefits for blockholders but entails little administrative cost. As this institutional set-up suggests, pyramids are widely used and deeply embedded.
According to the tax regime that has essentially been stable since 1965, a holding company receives almost full tax credit for the corporate income tax paid by the operating company or a subordinate holding vehicle, meaning that pyramids in France are essentially tax neutral (so-called “régime des sociétés mères”). This corporate tax credit, however, is conditional on holding the share block for at least two years12 and on holding at least 5% of the equity (10% until 2000); thus, only long-term investors that are significant shareholders benefit from the avoidance of double taxation. The tax credit is only approximately complete because the administration costs of a holding company remain taxable, at a level of the true administrative cost of the entity or 5% of its revenue, whichever is smaller. This creates a tax incentive to keep the true administrative costs of holding vehicles at a minimum and to structure them as pure financial holding entities unencumbered by any real assets or activities that would lead to higher administrative costs and a smaller tax credit. Thus, tax reasons can explain why holdings companies do not typically consist of a portfolio of equity blocks and operating assets as is the case in business groups that are prevalent in other countries.
Using a pyramid to structure an equity block offers several advantages in France. First, if the large shareholder has issued some debt, structuring the debt in a holding company allows the interest expense to be deducted against the dividend payouts that are subject to personal income taxes. Thus, the prevailing tax regime suggests that large share blocks financed with debt will be organized in pyramids. Second, pyramids decouple the decision of a listed operating company to pay dividends from the decision of a large blockholder to receive the dividend. That is, blockholders can use pyramidal holdings as a tax shelter; they will only incur the corresponding personal income tax on dividends when the dividends received by the holding company are later transferred to the ultimate owner. Therefore, since holding companies are neutral regarding corporate taxes, increasing the use of debt
12 A declaration of intent to hold the shares for more than two years is considered sufficient. Breach of the declaration of intent
through an earlier sale carries no other penalty besides back taxes. Thus, the tax neutrality of a new blockholder is in practice effective immediately and not after a two-year waiting period.
7
in a pyramid procures no tax savings, neither for personal nor corporate taxes.13 Third, holdings are the only practicable way in France to engineer a disparity between voting and cash flow rights. For all practical purposes, dual class shares are not allowed. France allows double voting rights for long-term investors, but their role is different and their impact limited, as our robustness results for double voting rights show (see Section 6.4). In addition, holding companies jointly held by multiple blockholders, such as family members, provide a vehicle for the multiple blockholders to vote as one block in corporate decisions.
Finally, French regulations require all companies, public and private, to file their unconsolidated financial statements on an annual basis. French regulations also require all companies, public and private, to register their list of important shareholders and listed companies to disclose important changes in shareholdings and their holding structure.14 Thus, the ownership structure, financial structure and payout policy of privately-owned as well as publicly-listed companies, including holding companies, are accessible.
3.2 Measures of Pyramidal Leverage and Control
In this section, we present a simple example to introduce our key variables for debt and control. Pyramids can be complex and France is no exception. Appendix A presents a full description of the design and algorithms that address cross-holdings and parallel ownership chains.
The Figure 1 example features an operating company, two holding companies and a dominant owner. All entities in the pyramid are vertically aligned, and the two holding companies have no other assets. Ms. X dominates the company OpCo by controlling 30% of its equity by means of two holding companies: HoldCo1 owns 30% of
OpCo; HoldCo2 owns 60% of HoldCo1; and Ms. X owns 70% of HoldCo2. Ms. X’s cash flow rights are
conventionally measured by the product 0.7 ·0.6 ·0.3 = 0.126, her claim on OpCo’s dividends. In measuring control rights, we apply the same product rule but convert majority stakes, 0.6 and 0.7, to full control, i.e. 1.0. Thus, her control rights are 1.0 ·1.0 · 0.3 = 0.3. The measure of the disparity between control rights and cash flow rights that we call the control wedge is the ratio of control rights/cash flow rights, calculated as 0.3/0.126 = 2.38.
13 That is, the same tax advantage can be achieved by simply sheltering dividends in holdings, without using debt. On the other
hand, conditional on using personal debt, it is tax-efficient to structure it as pyramidal debt.
14 Per French corporate laws, the following key thresholds give rise to discontinuous changes in control rights: 1) 33%: This
level of control grants veto rights. It also triggers the mandatory bid rule, i.e. any owner passing through the 33% threshold is required to launch a full and unrestricted takeover offer; 2) 40%: Control is presumed if one shareholder has at least 40% of voting rights, directly or indirectly, and is the largest shareholder (according to article 355-1 of French securities law per Bloch and Kremp, 2001); 3) 50%: This level constitutes majority voting rights (or legal control) and triggers notification to the French authorities; 4) 67%: Reverse of the 33% rule, i.e. the ability to block any veto rights by other shareholders. This level is also the highest conditional takeover offer allowed under French law (restricted offers are not allowed in France).
8
Our focus is on the dominant owner’s exposure to leverage in the various entities of the pyramid. We use two measures to aggregate the leverage throughout the various entities of the pyramid. We explain the two measures using our example. HoldCo1 is financed with 35% debt and 65% equity and HoldCo2 is financed with 20% debt and 80% equity. OpCo itself is 10% debt-financed. We denote the leverage ratio in pyramidal entity k by lk, so that in our
example l0 = 0.1, l1 = 0.35 and l2 = 0.2. In this setting, OpCo needs to pay a sufficient dividend so that HoldCo1 and
HoldCo2 can service their debt. Ms. X’s effective claim on OpCo’s cash flows is reduced as a consequence.
Focusing on holding company debt, our first measure of pyramidal leverage, which we call average
leverage, is just the mean leverage ratio of all the holding entities in the pyramid. In the example, we have an
average leverage of (0.35 + 0.2)/2 = 0.275. More generally, if the pyramid consists of n holding companies, k = 1, 2, …, n, average leverage is defined as
k k
l n
1 .
Our second measure, equivalent leverage, is motivated by the concern that average leverage may underestimate the dominant owner’s true debt exposure. Such is the case when several levered holding companies are vertically superimposed on the operating company, as in our example. Ms. X’s cash flow profile from her stake in
OpCo is successively exposed to the leverage in the pyramidal layers. Equivalent leverage determines the leverage
ratio that would give Ms. X the same cash flow profile if she were to hold her stake in OpCo and her pyramidal debt in a single levered holding company. In our example, equivalent leverage is calculated as l0 + (1 - l0 )l1 + (1 - l0 )(1-
l1)l2 = 0.1 + (1 - 0.1) · 0.35 + (1 - 0.1) · (1 - 0.35) · 0.2 = 0.532.15 Thus, this computation aggregates Ms. X’s full leverage exposure in the entire pyramid. More generally, if the pyramid consists of n vertically stacked holding companies, k = 1, 2, …, n, equivalent leverage is defined as l0 + (1 - l0) l1 + (1 - l0) (1 - l1)l2 + (1 - l0) (1 - l1) (1- l2)l3 + … + (1 - l0)(1 - l1) · …· (1- ln-1)ln. Equivalent leverage collapses the dominant owner’s pyramidal leverage to a single
leverage ratio, by hypothetically reallocating all debt in the pyramid at the operating company level (and assigning zero leverage to all holding companies), in such a way that the ultimate owner’s effective exposure to leverage is measured equivalently to the actual combined leverage of the pyramid structure (or of the dominant chain of control in case of multiple chains).
We have missing information on the capital structure for 32.7% of the reported pyramidal holding companies, with a marked increase in the second half of the sample period, due to an increase in foreign-based holding companies and lower compliance. When calculating the values for the two measures of pyramidal debt, we
15 For an intuition for the logic behind equivalent leverage, let r
D be the cost of debt (assume rD is the same for all entities in
the pyramid). If OpCo pays a dividend yield of x, then HoldCo1 receives 0.3 · x and, after paying interest, has earnings (ROE) of 0.3(x – l1rD). If HoldCo1 pays out all of its earnings as dividends, then HoldCo2 receives 0.6*0.3(x – l1rD) and, after paying
interest, has earnings (ROE) of 0.6 · 0.3(x – l1rD – (1- l1)l2 rD). If all of it is paid out, the dominant owner receives 0.7 · 0.6 ·
9
assume that the leverage in a holding company in the pyramid corresponds to the average of the holding companies in the same pyramid when no such data is available. Thus, our procedure ensures that the treatment of missing observations is neutral for our estimates of both leverage measures, average and equivalent.
3.3 Data and Variables
Our starting point is the set of all publicly listed companies on Euronext Paris as of December 31, 2012. Our initial sample includes firms from all three tiers of the Paris market, about 1,170 companies. We then impose the filter that each company be continuously included in the WorldScope database over the period 1999-2011. This criterion substantially reduces our sample; the final sample consists of 240 firms. We refer to each of these publicly listed companies as an operating company. Next, we collect the complete ownership information in every year for all holding companies, public and private. This information is available from the Dafsaliens database that also documents validation dates (Dafsaliens was set up by large French financial institutions to provide precise ownership information). Starting from the operating company, we use Dafsaliens to trace the ownership of the owners of the operating company and continue this process until we have traced the entire ownership structure to the dominant owners. We trace ownership across all ownership classes, individual/family, public company, unlisted private company and state.
In accordance with La Porta, Lopez-de-Silanes, and Shleifer (1999), Claessens, Djankov, and Lang (2000), Faccio and Lang (2002) and others, we require that a shareholder possess a substantial level of control (i.e. voting rights) in order to qualify as a dominant owner. The typical threshold used in the literature is 20%. To be consistent with the literature and allow comparisons with prior findings, we use the same 20% threshold in our baseline. In each operating company, we verify whether the largest ultimate owner exceeds this threshold. If no shareholder has a control right stake of 20% or more, the company is considered as widely held. Otherwise, we identify the ultimate owner with the largest control right stake and we refer to this ultimate owner as the dominant owner.
We capture the discontinuous character of control rights by using concepts similar to those adopted in Almeida et al. (2011) and assume the dominant shareholder has absolute control over the operating company if she has a majority of votes. That is, we convert effective control rights of greater than 50% in any entity into full control of 100%. The other stakes are then allocated zero control rights. Again, more complex cases with several control chains are discussed in the Appendix A.
From the Diane database (the French component of Bureau van Dijk’s Amadeus database), we collect the unconsolidated financial statements for private unlisted and for listed companies in the ownership chain for 1999 to 2011. The unconsolidated financial data provided by Diane eliminates the effect of group debt and focuses the
10
analysis on the capital structure of the firm itself. For the sample of 240 operating companies, we use their consolidated financial statement information from WorldScope.16
The richness of the Dafsaliens and Diane information offers an important advantage over annual report-based data and company handbooks used in most previous works such as La Porta, Lopez-de-Silanes, and Shleifer (1999) and Faccio and Lang (2002), which cover only ownership information of public companies.
3.4 Firm Characteristics, Ownership Structure and Pyramids
Table 1 describes summary statistics of ownership structure and firm characteristics of the 240 French operating companies, yielding 2,880 observations in our 2000-2011 window (dropping 1999 as the regressions use lagged variables), of which 2,160 before the crisis and 720 after the outbreak of the crisis.17 We find that in the pre-crisis period 2000-2008, only 26.1% of operating companies are widely-held, and 73.9% of the firms have a blockholder who satisfies the inclusion threshold of 20%. Moreover, in 44.9% of our pre-crisis sample, dominant shareholders use pyramids to control the operating company. This high frequency of pyramid-controlled firms, substantially higher than the 26% frequency that La Porta, Lopez-de-Silanes, and Shleifer (1999) and Faccio and Lang (2002) report for France, is explained by the inclusion of private holding companies. By contrast, earlier studies on pyramids in France classify firms as pyramids only if at least one of the holding companies in the pyramidal structure was a public company.18 We find that only less than one quarter of pyramidal structures contain a public company (not reported in tables). While perhaps an inevitable restriction in cross-country studies, limiting the pyramid definition to only structures with listed holding entities leads to a substantial undercount of the use of pyramids in at least the case of France.
Dominant owners are classified by type in Table 1 (individual/family, firm, and state and others). Approximately forty-eight percent of operating companies are controlled by either a family or an individual, roughly in line with earlier studies. Corporate owners comprise 17.2% of dominant owners in the pre-crisis sample.
Table 1 also provides an overview of key financial characteristics for the companies in our sample, broken down by type of control and owner, that allows us to see whether firms are comparable across ownership types. In terms of size, measured by total assets, widely-held firms are only slightly larger than firms with dominant owners, and they have about the same sales growth rate as block-owned firms, whereas companies in pyramids have slower
16 If any of the 240 companies control subsidiaries, the net financial position of the subsidiaries and operating company is
reflected in the operating company’s consolidated financial information.
17 In order to describe the longer term developments after the crisis, Table 1 also includes the 2012-2014 and 2015-2017
descriptives of the 720 firms in the post-crisis sample.
11
growth. Widely held firms have somewhat higher operational risk and a higher frequency of loss years. Capex spending and Tobin’s Q are comparable across all categories, as are cash flows and return on assets. Leverage is defined as total debt obligations, scaled by book value of total assets, with operating companies in pyramids having marginally higher ratios. Sales growth is the two-year growth rate of sales. We measure dividends relative to cash flow.19 Relative to the full sample, operating companies with pyramidal ownership pay dividends comparable to those of widely-held firms, slightly above the full sample means, and blockholder-controlled firms without pyramids have lower dividend payouts. Comparing the average dividends before and after the crisis for blockholder and pyramidal ownership, Table 1 shows that the dividends scaled by firm size have decreased, while a large fraction of cash flows have been paid out. The frequency of loss firms and the level of operating risk are comparable across the crisis subsamples, with operating companies in pyramids slightly lower. Pyramidal blockholder-controlled firms are not different from other firms in terms of financial constraints and their position in the firm life cycle (DeAngelo et al. (2006)’s variable retained earnings/equity), but their stock market liquidity is lower (unsurprisingly for concentrated ownership). The industry breakdown shows a wide mix of industries in the full sample as well as in the subsamples of block owner-controlled and pyramid-controlled operating companies. Overall, widely held firms, firms with blockowners, and firms with blockowners using pyramids are roughly comparable.
3.5 Summary Statistics of Pyramidal Leverage
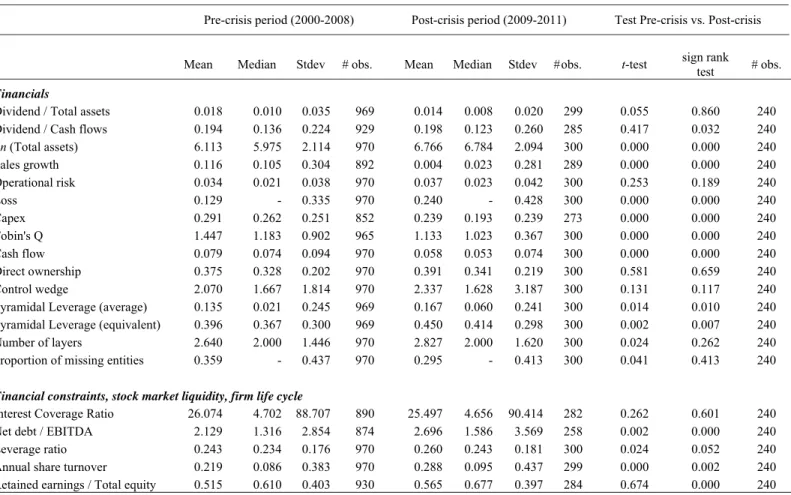
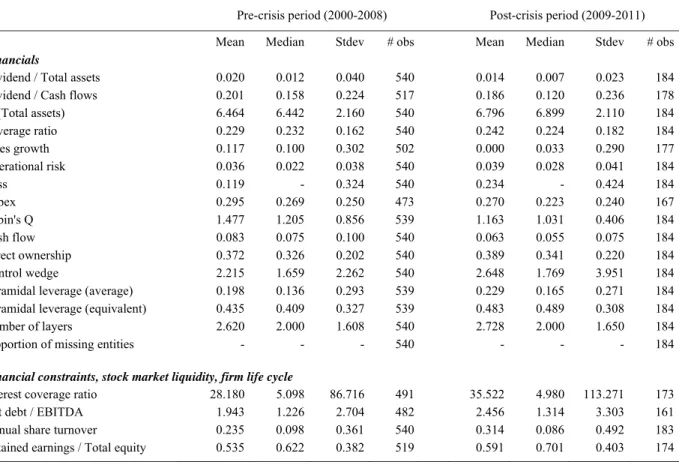
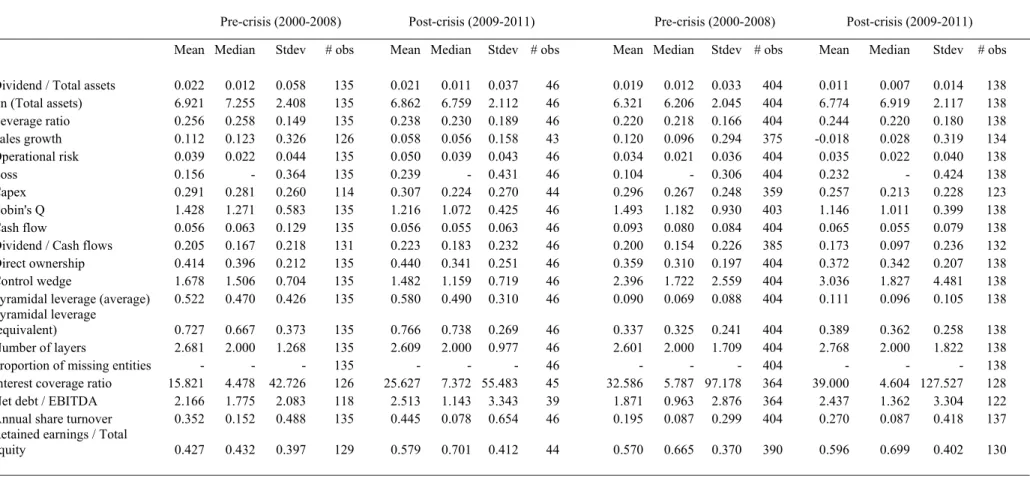
In Table 2, we present summary statistics for pyramid-controlled operating firms (i.e., firms with a dominant blockholder exceeding 20% of ownership and a pyramidal structure), for the pre-crisis and the post-crisis periods, and an analysis of changes due to the onset of the crisis. We continue our analysis with a sample of 970 firm-years in block-owned pyramids, for which we calculate the control wedge as well as the two debt measures for the pyramidal structure. For this sample, 34.4% of holding companies on average have missing data, and the median holding company has no missing data.
We report an expansion of the summary statistics for the financial characteristics shown in Table 1 for pyramid-controlled operating firms, showing average, median, and standard deviation. Not surprisingly, sales growth, capex, Tobin’s Q, cash flows all fall, and the frequency of losses rises substantially and significantly with the onset of the crisis. As a consequence, dividends as a fraction of total assets (our main measure) also fall, albeit with weak significance, but not dividends when scaled by cash flows. Table 2 also shows the dominant owner holds on average 37.5% of the equity (direct ownership) in the operating company (median: 32.8%). Pyramidal structures
19 We follow common practice and set payout ratios to unity when dividends are paid but cash flows are negative or less
12
contain 2.64 layers on average with a median of 2. This measure includes the operating company as a layer. The control wedge with a pre-crisis mean of 2.07 (median: 1.667) measures the control-enhancing effect of pyramids as follows: considering only equity stakes in the pyramidal structure, dominant owners own 1.07 times more voting rights on average than they hold cash flow rights, and it changes little in the post-crisis period. Financial leverage increases with the crisis, both as the standard leverage ratio (financial debt/total assets), and when measured as Net debt/EBITDA.
Our two measures of pyramidal leverage consistently show that pyramidal debt is wide-spread in France, but moderate in size on average. In line with the leverage increase of the operating companies, we also find an increase from the pre-crisis to the post-crisis period. Average pyramidal leverage, which measures the mean debt-asset ratio in all holding companies across a pyramid, has a pre-crisis mean value of 13.5% (16.7% post-crisis) but a pre-crisis median value of only 2.1% (post-crisis 2.4%), reflecting a conservative capital structure. The dominant owner’s total exposure to pyramidal leverage, however, is larger than indicated by average leverage if several holding companies are vertically stacked. This is the case in a large fraction of pyramidal firms (the average pre-crisis number of layers of holding companies is 1.64, after subtracting the operating company from the mean of 2.64 layers in total, increasing to 1.83 after the crisis). Equivalent pyramidal leverage, our second measure, transforms debt to an equivalent exposure, and provides a better view of the consolidated leverage exposure of the dominant owner throughout the bottom company and vertical chain of holding entities. The mean (median) pre-crisis equivalent leverage is 39.6% (36.7%), increasing to 45% (41.4%) post-crisis. In untabulated numbers, we find that 25% of the controlling owners of pyramidal firms have a pre-crisis equivalent pyramidal leverage measure of 57.9% or more. These numbers show the use of leverage in pyramids is significant for some pyramid-controlled firms in France. The distribution for our financial constraints, stock market liquidity and firm life cycle variables among pyramidal firms does not reveal any striking patterns.
3.6 Stability of Pyramids and Pyramidal Debt
We investigate whether pyramids and pyramidal debt are persistent over time. We start by collecting the evidence on the time variations in the presence of dominant blockholders. If block ownership is endogenous it should dynamically adjust when the firm’s conditions change.20 We inspect the rate of change in block ownership by looking at the two-year changes and find that the ownership classification (widely held, non pyramid, block-pyramid) does not change from one year to the next for close to 90% of firms.
13
We also investigate whether pyramidal structures exhibit the same persistence that we find for the dominant owners and their blockholdings. We find that pyramids and their holding vehicles are stable over time. We draw a random sample of 100 holding companies and investigate the year they were founded. On average, the holding companies at the beginning of the sample period in 1999 are already more than 30 years old, less than 10% were founded in 1990 or later, and the oldest holding company was founded in 1865. The large number of companies controlled by families (54.9% of the pyramidal firms versus 37.7% for the non-pyramidal firms with a controlling blockholder, see Table 1) is one of the main drivers of the longstanding nature of the relationship between dominant blockholders and listed operating companies.
As a final verification, we consider the stability of pyramidal debt. While the leverage ratio of pyramidal entities fluctuates from one year to the next, we find that the debt exposure of firms with high pyramidal leverage compared to firms with little pyramidal leverage is persistent. To analyze the autocorrelation of pyramidal debt, we sort our sample of firms with pyramid control into quartiles according to their pyramidal leverage, using our two leverage measures. When analyzing the persistence of their position relative to all pyramidal firms, we find that, measured by equivalent leverage, 86% of firms remain in the same quartile of pyramidal leverage exposure from one year to the next (73% when we consider average leverage). This high persistence of firms’ pyramidal debt exposure is useful for our identification strategy during the financial crisis.
3.7 Operating Company Debt and Pyramidal Debt
Finally, we explore the relationship between operating company debt and pyramidal debt. While there is no literature on the capital structure of holding companies with pyramidal debt, we do not expect pyramidal leverage and company leverage to be correlated in a predictable way.21 We investigate the correlation between operating company debt and pyramidal debt. We determine the correlation coefficients between the company leverage and our two measures of pyramidal debt (not tabulated in tables), and find no correlation of the company’s leverage ratio with average leverage (ρ = - 0.06) and a low but reasonable positive correlation with equivalent leverage (ρ = 0.36), consistent with our findings for operating company leverage in Table 3, Panel B. This result holds also in untabulated regressions trying to explain the presence of pyramidal leverage, in particular when including variables
21 Standard arguments suggest that if operating company debt is optimized, optimal pyramidal debt should be zero if the
dominant owner faces no wealth constraints. Wealth constraints or other motives for pyramidal debt, however, are not obviously correlated with operating company characteristics. Also, dominant owners in our sample are unlikely to self-select to companies according to their risk characteristics or leverage, considering that our blockholders are overwhelmingly families, corporations or government that typically cannot be dissociated from the company history. We cannot rule out that the decision whether to place debt in the operating company or in the pyramidal entities can make a difference for some types of ultimate owners.
14
that typically explain leverage, such as size, age, tangible assets or past profitability. To conclude, we are unable to explain the choice of pyramidal debt from observable company characteristics. That leaves only unobserved company characteristics, or characteristics of the dominant owners themselves and their choices, as possible determinants of an endogenous relationship between pyramidal debt and dividends.
4. Pyramidal Leverage and Payout Policy 4.1 Identification Strategy
Our main identification strategy relies on the crisis shock of the financial crisis of 2008/2009 as the basis for a difference-in-difference estimation with expected heterogeneous local average treatment effects, using methodology formally introduced by Imbens and Angrist (1994). The crisis was unexpected and pervasive but firms, when classified according to their exposure to pyramidal debt, are expected to differ in their likely dividend response according to their degree of exposure to pyramidal leverage. In other words, we exploit the fact that the shock (the treatment) incurred during the financial crisis varies according to the heterogeneous pyramidal leverage.
The fact that pyramidal holding companies and their debt levels are stable over time and exhibit a low correlation with company leverage or other company characteristics, is reassuring news from an econometric point of view: it allows us to view the blockholder’s private leverage exposure as given and as quasi-randomly assigned (conditional on all controls that we include) when the crisis arrives. Thus, the stickiness of pyramidal debt and the lack of correlation with operating company characteristics appear to validate our approach.22
4.2 Ownership Structure and Dividend Payouts Before and After the Crisis
Table 3 presents the regression analysis for the dividend policy for all firms over the entire sample period, 2000-2011. The purpose of this table is to investigate whether the type of ownership structure matters for payout policy, and whether the financial crisis of 2008 has an impact on this relationship. When analyzing the impact of the financial crisis, we take into account that the crisis had an effect on payout policy in France with a delay (David and Ginglinger, 2016), often attributed to the importance of automatic stabilizers; by some measures, the depth of the crisis was only reached in conjunction with the European sovereign debt crisis starting in 2010. Therefore, we consider that the full impact of the crisis was only felt in 2009 and sometimes even later. Indeed, dividends paid in Spring 2009 were still at relatively high levels. We define the dummy variable dPostCrisis that takes a value of one for the years 2009, 2010 and 2011 (company earnings in year t are reflected in dividends in year t+1, and hence
22 The conditions of Imbens and Angrist (1994) for the validity of local average treatment effects (relevance, exclusion
15
dividends are measured in the following year). We focus on dividends scaled by total assets (Div/TA) as our dependent variable. Our main findings are robust when using alternative measures of dividend policy (see Table IA.2 in the Internet Appendix).
Panel A of Table 3 shows in the first two lines that the dividend policy of pyramid-controlled firms does not significantly differ from that of widely held firms, whereas firms with blockholders but no pyramidal structure pay less dividends, consistent with the expropriation hypothesis of LaPorta et al. (2000) (the prefix d denotes dummy variables in this and the following tables). When we interact the dPostCrisis dummy with our variables for the presence of blockowners or pyramids, we find that the dividend policy does not change between the pre-crisis and the post-crisis period for the three ownership structures. This means that companies with concentrated shareholdings or holding companies adjust their dividend policies in reaction to the crisis in exactly the same way as do widely held companies.23
We also consider whether there is a different dividend reaction to the crisis event for firms exposed to financial distress. In Panel B of Table 3, we use three different measures of financial constraints: the interest coverage ratio used in Chu (2017), the leverage ratio used in Hoshi, Kashyap and Scharfstein (1990), as well as the variable net debt/EBITDA. We define firms to be in financial distress if they belong to the most exposed quartile of sample firms for each of the financial constraint measures (bottom quartile for the interest coverage ratio, and top quartile for leverage ratio and net debt/EBITDA). The results are reported in Table 3, Panel B. Our focus is again on pyramidal firms with a blockholder. We find that the triple interaction variable dConstraint × dBlock-owned pyramid × dPostCrisis, our measure of the post-crisis impact of the presence of financial constraints, is not significant for any of our three financial constraint variables; we conclude that pyramidal block ownership per se does not lead to a different adjustment in dividend payouts after the crisis, even for firms that show signs of financial distress.
To complete the discussion, the regressions in Table 3 (Panel A and B) confirm that dividend policy depends on other variables: unsurprisingly, firms with higher Tobin’s Q and higher profitability (ROA) pay higher dividends, and firms with higher sales growth pay less dividends. We also confirm DeAngelo et al. (2006)’s finding that dividends increase for firms capable of financing equity from retained earnings rather than raised capital when including their suggested life cycle variable retained earnings/total equity. Dividend payouts do not depend on our measure of stock market liquidity (we report results using Banerjee et al. (2007)’s first liquidity measure of annual stock turnover), or other control variables included in the regression. Company leverage is not significant when we
23 The regression include year and industry fixed effects, so the dummy dPostCrisis as a primitive term would be redundant
16
control for post-crisis leverage (regressions (4) to (6)). Though not shown, the regressions in the two tables load the same on our industry categories.
4.3 Pyramidal Debt and Dividend Payouts Before and After the Crisis
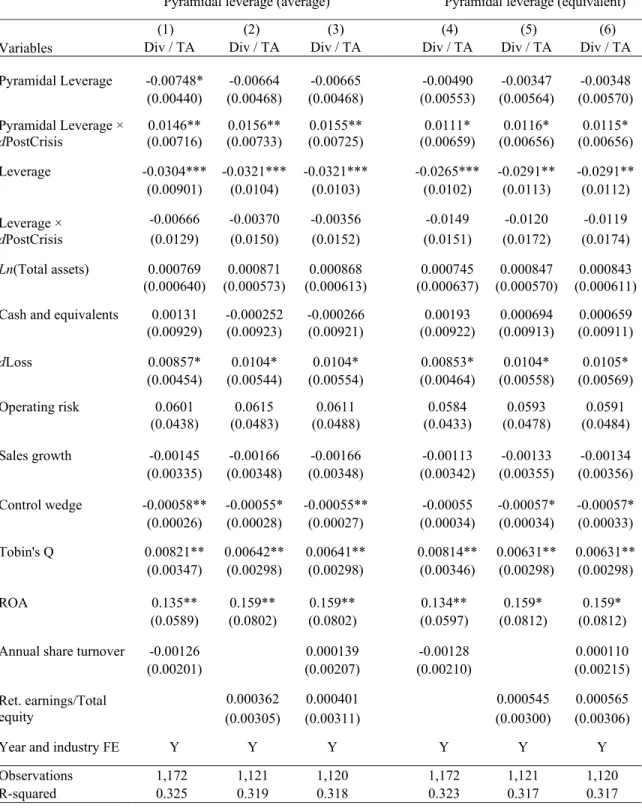
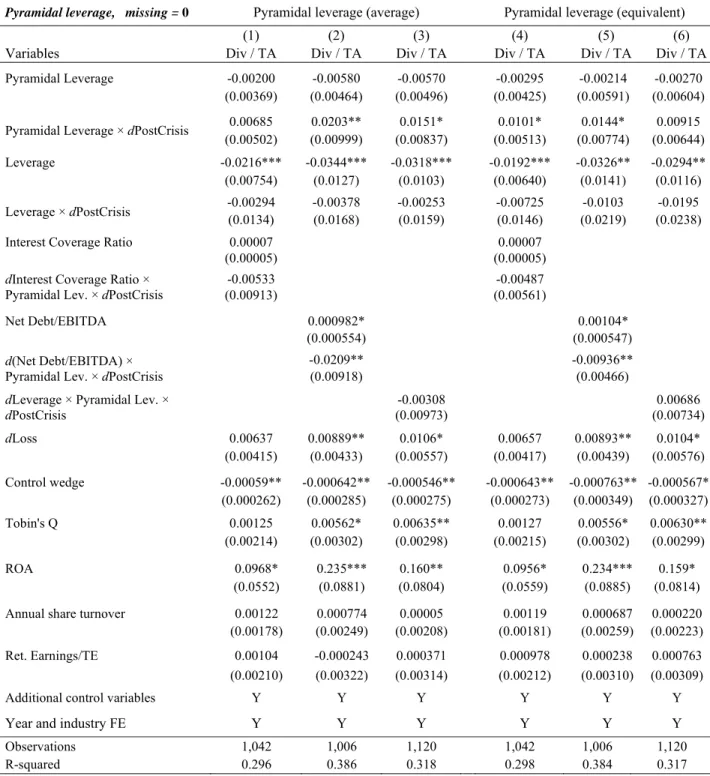
We consider the impact of pyramidal debt on payout policies in Table 4, presenting our main result that companies relying heavily on pyramidal debt maintain substantial dividend payment levels after the crisis. We are particularly interested in the question whether the crisis, as measured by the dummy variable dPostCrisis, had an impact on the relationship between pyramidal debt and dividend policy. Since we want to take a closer look at the financial structure of the holding companies in pyramids, this table limits the attention to pyramid-controlled operating firms, in contrast to Table 3 that looks at all firms. We show results for our two measures of pyramidal leverage, average leverage (regressions (1) to (3)) and equivalent leverage (regressions (4) to (6)). Table 4, Panel A, documents that pyramidal debt per se, whether measured by average or equivalent leverage, has no clearly significant effect for the dividend policy of the operating company. The coefficient is slightly negative, but essentially insignificant (with significance at the 10% level in only one out of six regressions). In these as in all following regressions, we assume that the leverage in holding entities for which we do not observe financial information is the same as for the observed entities of the same companies (see Table 7 for the robustness when altering this assumption).
Our identification exploits the fact that there should be a predictable heterogeneous response to the crisis shock according to the exposure to pyramidal leverage. While the shock affects all firms, the dividend response to the shock should be more mitigated for firms with blockholders exposed to pyramidal leverage. Our approach is a difference-in-difference estimation of this differential response to the crisis shock, measured by the interaction term between dPostCrisis and our two measures of pyramidal leverage. The interaction term Pyramidal leverage ×
dPostCrisis in Table 4, Panel A, is our main variable of interest.
We find a uniformly significant positive relationship between the interaction term Pyramidal leverage ×
dPostCrisis in Panel A of Table 4 and dividend policy in all specifications, with significance at the 5% level in 3 out
of 6 specifications, and at 10% in the 3 remaining equations. This is the main answer to our research question; it says that, in order for dominant owners to be able to service their private debts, companies with levered blockholders are willing to maintain dividends in reaction to the crisis. For the interpretation, it should be kept in mind that the financial crisis hit France with a delay.
17
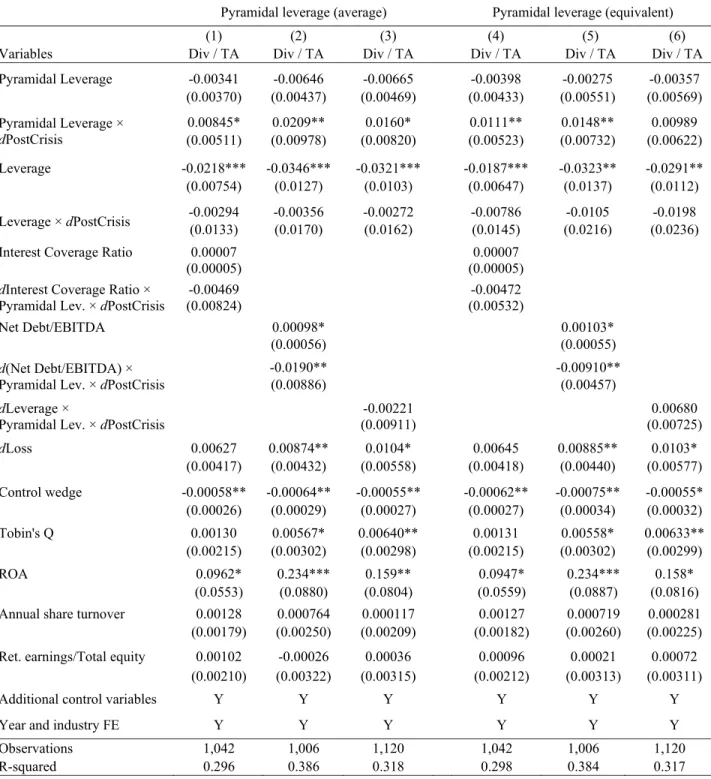
We also consider whether the post-crisis dividend adjustment is different for firms exposed to financial distress. In Table 4, Panel B, we report the results when we interact the variable of interest Pyramidal leverage ×
dPostCrisis with our three variables of financial distress, Interest coverage ratio, Leverage ratio and Net
debt/EBITDA. The triple interaction coefficient is negative as we would expect (meaning that firms more likely exposed to financial distress concerns are less likely to maintain pre-crisis levels of dividends) but it is significantly negative only for Net debt/EBITDA. Crucially, our main variable of interest Pyramidal leverage × dPostCrisis remains positive and significant, meaning that companies with leveraged blockholder cut their dividends by a significantly smaller amount compared with other firms even when we explicitly include financial distress.
As a robustness check, we repeat all regressions in Tables 3 and 4 with two-year lagged ownership measures instead of the one-year lagged ownership measures that we use in all regressions reported in these tables. The results (not reported in tables) are robust to this two-year lag.24 The stability of the ownership structure and these extended lags imply that endogeneity of this variable is not likely to induce biased estimates.
5. Anatomy of Dividend Pass-Through in Pyramidal Structure
For additional evidence on the transmission mechanism, we disaggregate and investigate information for the flow of funds within pyramids. We inspect directly the financial situation of each holding company, in particular its capital structure and dividends. We consider specifically the utilization of the dividends that each entity receives, and in particular focus on the fraction passed on to the next layer in the pyramidal chain. Following our hypothesis, we postulate that this fraction decreases in the entity’s debt. Thus, the fraction of dividends that is ultimately passed on to the beneficial owner should decrease in the pyramidal debt exposure.
Specifically, we investigate the behavior and determinants of the dividend pass-through, the dividends ultimately received by the dominant shareholder as a fraction of the operating company’s dividends made available to him. Formally, by dividend pass-through of the dominant owner, we refer to the fraction of the dividends that the operating company makes available to the dominant shareholder (through direct and indirect ownership links) that the dominant owner actually receives. Thus, this fraction excludes the part of dividends absorbed somewhere in the pyramidal chain.
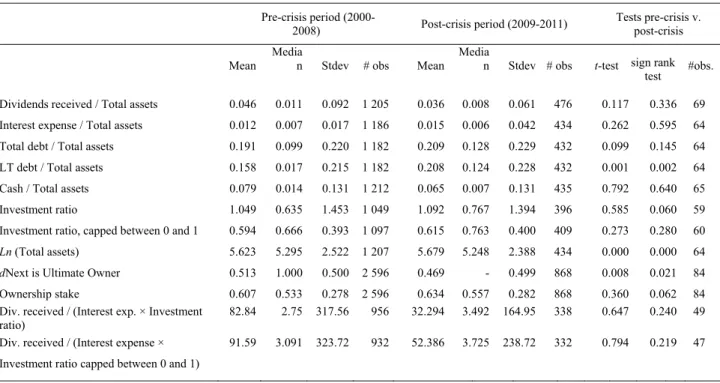
Table 5 shows summary statistics for the holding companies of pyramid-controlled companies, encompassing all holding companies for which we observe financial information. We base our analysis on this sample (we present the statistics for the smaller subsample of holding entities and associated operating companies for
24 In a few instances the significance of the results becomes weak; this is a consequence of the loss of power in our tests
18
which we have complete financial information on all holding entities in the pyramid in the Internet Appendix, Tables IA.3 and IA.4). Again, we show values for the pre-crisis and post-crisis period separately. Panel A presents the summary statistics for all holding companies with observable financial information. Total assets and the investment ratio (the fraction of the holding entity’s assets that consists of its stake in the listed operating company) of the holding companies remain stable between the pre-crisis and post-crisis period, but debt and interest expenses rise whereas dividends received fall, measured as a fraction of total assets, albeit mostly not significantly, indicating the potential for heightened tension in the ability to service pyramidal debt. Indeed, the last two lines of Panel A show a precipitous fall in the mean coverage of interest obligations through dividend receipts: when we express dividends received as a fraction of the proportional debt service obligation of the holding entity (interest expense × investment ratio), we find that the fraction decreases by 43% from the pre-crisis to the post-crisis period in our preferred version where outliers are capped (investment ratio capped between 0 and 1, last line), and by 61% in the raw data. However, this coverage ratio remains at relatively comfortable median levels of 3 (mean above 30) even after the crisis. Thus, we expect tensions to be concentrated among companies at the top end of pyramidal debt.
Indeed, the picture changes when we split the sample to focus on companies with the highest pyramidal leverage exposure. In Panel B, we consider the top quartile of pyramidal holding companies by leverage (financial debt/total assets) separately from the rest of the sample. We find that the coverage ratio dividends received/(interest expense × investment ratio) is much lower for highly levered firms, at median levels between 1.28 and 1.56 before the crisis (mean levels above 5). This indicates a clear potential for tensions for the most levered blockholders. Remarkably, it remains stable or even increases (in the raw data) with the arrival of the crisis, in strong contrast to the rest of the sample of moderately levered pyramidal holding companies where the coverage ratio is much higher and falls with the crisis. We find similar differences when we split the sample by other measures of pyramidal leverage (not reported in tables).
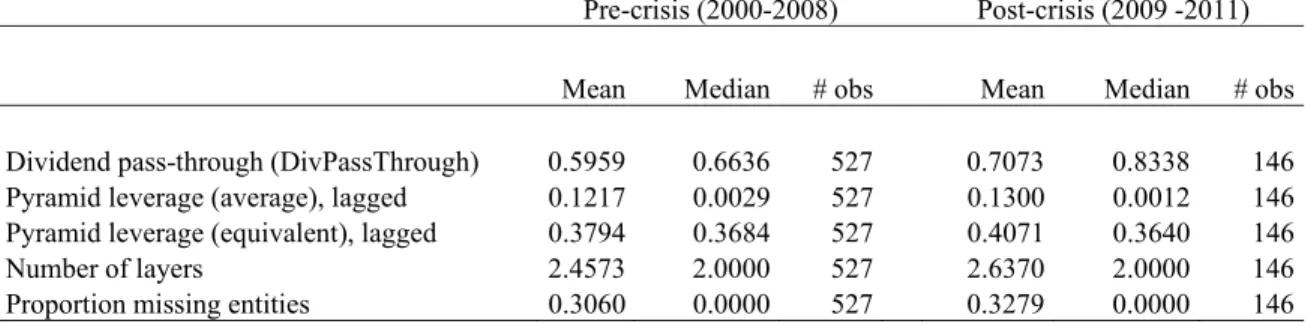
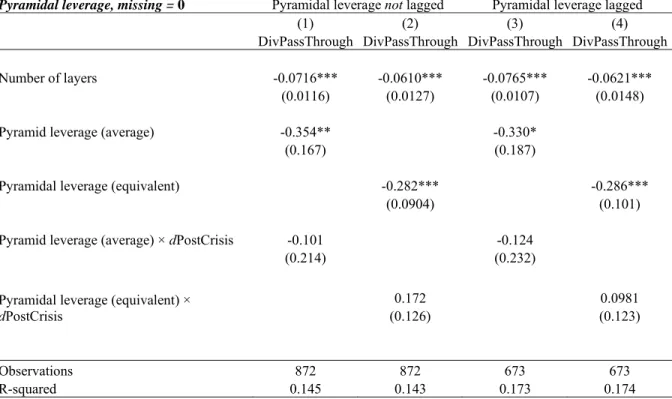
Table 6 considers the determinants of dividend pass-through. Panel A presents summary statistics, separate for the pre-crisis years 2000-2008 and the post-crisis period starting in 2009. It shows that the mean (median) of the dividend pass-through in our sample is 59.6% (66.4%), i.e. ultimate owners receive on average less than 60% of the dividends made available to them. This proportion increases to 70.7% on average (median: 83.4%) after the financial shock arrives, perhaps indicating that the ultimate owners have additional cash needs after the crisis that are not captured by the pyramidal debt in our sample, but the difference is not significant.
Panel B presents the regression results. The dependent variable is the dividend pass-through to the ultimate owner as a fraction of the dividends made available to him. Our variable of interest is the measure of pyramidal leverage (average leverage in regressions (1) and (3) and equivalent leverage in regressions (2) and (4)), either as a
19
contemporaneous measure (regressions (1) and (2)) or as a lagged measure (regressions (3) and (4)). We focus on the number of pyramidal layers and one of our two pyramidal leverage measures. In the pre-crisis period, both measures of pyramidal leverage are significantly negative: a smaller fraction of dividends received is passed through to the ultimate owner if the pyramid is indebted (as a substantial part of dividends received by intermediate entities are used to service the debt). When we use lagged pyramidal leverage terms (in regressions (3) and (4)) to be more certain about the direction of causality, we find the same result.
To gauge the impact of the crisis shock, we consider the interaction terms of pyramidal debt with the dummy dPostCrisis. Since Table 4 shows that dividends are increasing in pyramidal leverage, we expect that dividend policy may remain the same and hence the relationship between pass-through and pyramidal leverage may remain constant. Indeed, we find that the interacted terms are not significant, meaning that the adjustment does not come at the ultimate owner’s expense; ultimate owners seem to be able to receive payouts that are uncorrelated with their pyramidal debt exposure.
Overall, our anatomy of the pass-through of dividends demonstrates that ultimate owners receive on average only 60% of the dividends that the operating company makes available to them, using the remainder mostly for debt service payments along the pyramidal chain. These relationships hold in normal times. The fact that the pass-through does not vary with pyramidal debt after the financial crisis shock appears to be consistent with our earlier results in Table 4: if companies do not cut their dividends because they cater to the needs for cash of the dominant owner’s pyramidal leverage, then the use of those unchanged dividends in the pyramid should not change, either. This finding is also consistent with the hypothesis that pyramidal debt reinforces the pressure on operating companies to increases their payout ratios when hit by adverse shocks.
6. Extensions and Robustness
6.1 Real Effects of Blockholder Leverage Under Duress
When companies with levered owners increase dividends during times of financial duress, negative real effects such as a cut in investments could be the consequence. We investigate whether pyramidal debt has such a negative impact on investments. We look at the full sample, and we also look at the subsample of pyramid-controlled firm, where we focus on the impact of pyramidal leverage, before and after the financial crisis. We find that neither before nor after the crisis is there any significant change in investment that can be attributed to pyramidal leverage. We do not tabulate these results, but include representative regressions in the Internet Appendix (Table IA.1).
Also in untabulated regressions, we investigate the determinants of various measures of operational risk. We use the standard deviation of ROA, beta, and the standard deviation and semi-deviation of market return, all
20
measured over a rolling 5-year window (t-4 to t). While one of our four measures, the volatility of ROA, shows some association with pyramidal debt in the pre-crisis period, none of the four measures of operational risk shows any change as a function of pyramidal debt under the shock from the financial crisis. Our findings for investments and risk appear to be consistent: overall, pyramidal leverage is probably too conservative, and the effect leading to higher dividends too small to lead to a measurable reduction in investment or change in risk.
6.2 Alternative Measures for Pyramidal Debt
We have no capital structure information for 34.4% of the reported pyramidal holding companies, posing a challenge for the construction of our measures of pyramidal debt. We investigate the robustness of our results when using the most conservative assumption available for the capital structure of those holding entities with missing information. We now assume that, when calculating the values for the two measures of pyramidal debt, there is zero debt in a holding company in the pyramid when such data is not available, thereby presenting conservative estimates for our two leverage measures, average and equivalent. By contrast, in our main analysis, we assume that the leverage of those holding companies with missing capital structure observation corresponds to the average of the holding companies in the same pyramid when no such data is available.
Tables 7 and 8 present the result, reproducing our estimates of the dividend model (Table 4) and the dividend pass-through (Table 6). Importantly, the significance of the variables of interest, the interacted terms with the post-crisis dummy, and the explanatory power of the regressions are robust to this use of the most conservative measure of pyramidal leverage.
6.3 Alternative Explanations for Dividend Levels in Pyramids
Regarding alternative explanations, we consider first Almeida and Wolfenzon’s (2006) theory stipulating that pyramids are used to create new businesses from retained earnings, thereby taking minority investors hostage in the interest of capital accumulation. Inspecting the asset base of holding companies, we find that on average the investment in the company one layer below comprises 60% of the total assets of the pyramidal entity (see Table 5, Panel A). With the stake in the company below constituting over half of a typical holding company’s assets, it is unlikely that French holding companies are predominantly used to accumulate new investments in other subsidiaries. Further evidence emerges when we analyze the relationship between dividends received and the uses for those dividends. If a holding company absorbs dividends, i.e. receives dividends but does not pass them on to the next layer, it will put them to one of three uses: (1) to pay debt service; (2) to make investments; and (3) to save by increasing cash or paying down debt. Performing correlation analyses with these three variables, we find that the
21
correlation between dividends received and interest rate obligations is very high, at ρ ≥ 0.6 for various variable definitions. This is in contrast to the absence of any correlation between dividends received and the two other possible dividend uses, the increase in total assets between year t and year t+1 and the increase in cash.
Multivariate regressions show evidence consistent with this correlation. We recall that the coefficients for the two pyramidal debt measures are highly significant and negative in Table 6, Panel B, and that this relationship does not change after the crisis. By contrast, we find no evidence (in untabulated regressions) that dividends passed through are determined by a holding vehicle’s value or a change in its total assets. In conclusion, our findings suggest that debt service considerations are the major determinant of payout decisions in the pyramid.
6.4 Double Voting Rights and Share Repurchases
Pyramidal leverage also has an impact on the disproportionality between voting and cash flow rights. In France, pyramids are the only available control-enhancing mechanism, besides double voting rights. One final possibility we explore is that owners might choose pyramidal leverage mostly as a means to magnify their effective control wedge.
To investigate this possibility, we explicitly analyze double voting rights, which are a widely used control-enhancing mechanism in France.25 According to French law, the company’s charter can convey a double voting right to each share if the share is held for a specified period, which must be between 2 and 4 years. Thus, double voting rights are distinct from dual-class shares as they are a premium for loyalty that is non-exclusive (every share acquires the right after satisfying the holding requirement) and is lost when the share is sold. Controlling owners who adopt double voting rights are those most likely to be driven by control motives, and the use of pyramidal leverage will magnify the control wedge most for those owners.
To assess the role played by double voting rights, we trace the actual voting rights (including double voting rights) of the dominant owner in our 2003 sample from annual reports and disclosure statements obtained from the AMF, the French stock market regulator. We find that for operating firms, double voting rights make no difference to the control rights allocation – either because the dominant owner already holds more than 50% of the votes, or because the firm remains widely held after accounting for double voting rights. We calculate a modified measure for the control wedge taking into account double voting rights, and rerun our relevant regressions with this modified
25 Ginglinger and Hamon (2012) report that about two thirds of listed French companies adopt double voting rights and that
they are most popular among smaller and family companies; our numbers are comparable. Two other control-enhancing devices are in principle available but rarely used: non-voting shares are used by less than 2% of blockholder-controlled firms; voting caps are used by only about 1% (Ginglinger and Hamon, 2012). In 2014, the French law changed and the grant of double voting rights was made the legal default status, leading to a considerably increase of their use, even though companies could opt out (so-called Florange law, see Becht, Kamisarenka, Pajuste, 2018). This law change, however, occurred after our sample period.