HAL Id: hal-02434244
https://hal.archives-ouvertes.fr/hal-02434244
Submitted on 9 Jan 2020HAL is a multi-disciplinary open access archive for the deposit and dissemination of sci-entific research documents, whether they are pub-lished or not. The documents may come from teaching and research institutions in France or abroad, or from public or private research centers.
L’archive ouverte pluridisciplinaire HAL, est destinée au dépôt et à la diffusion de documents scientifiques de niveau recherche, publiés ou non, émanant des établissements d’enseignement et de recherche français ou étrangers, des laboratoires publics ou privés.
An Affordance-Based Online Review Analysis
Framework
Tianjun Hou, Bernard Yannou, Yann Leroy, Emilie Poirson
To cite this version:
Tianjun Hou, Bernard Yannou, Yann Leroy, Emilie Poirson. An Affordance-Based Online Review Analysis Framework. 22nd International Conference on Engineering Design (ICED), Aug 2019, Delft, Netherlands. pp.2457-2466, �10.1017/dsi.2019.252�. �hal-02434244�
Cite this article: Hou, T., Yannou, B., Leroy, Y., Poirson, E. (2019) ‘An Affordance-Based Online Review Analysis Framework’, in Proceedings of the 22nd International Conference on Engineering Design (ICED19), Delft, The Netherlands, 5-8 August 2019. DOI:10.1017/dsi.2019.252
ICED19
INTERNATIONAL CONFERENCE ON ENGINEERING DESIGN, ICED19 5-8 AUGUST 2019, DELFT, THE NETHERLANDS
ICED19
AN AFFORDANCE-BASED ONLINE REVIEW ANALYSIS
FRAMEWORK
Hou, Tianjun (1); Yannou, Bernard (1); Leroy, Yann (1); Poirson, Emilie (2)
1: Laboratoire Genie Industriel, CentraleSupélec, Université Paris-Saclay, Gif-sur-Yvette, France; 2: LS2N, Ecole Centrale de Nantes, Nantes, France
ABSTRACT
One of the main tasks of today's data-driven design is to learn customers' concerns from the feedback data posted on the internet, to drive smarter and more profitable decisions during product development. Feature-based opinion mining was first performed by the computer and design scientists to analyse online product reviews. In order to provide more sophisticated customer feedback analyses and to understand in a deeper way customer concerns about products, the authors propose an affordance-based online review analysis framework. This framework allows understanding how and in what condition customers use their products, how user preferences change over years and how customers use the product innovatively. An empirical case study using the proposed approach is conducted with the online reviews of Kindle e-readers downloaded from amazon.com. A set of innovation leads and redesign paths are provided for the design of next-generation e-reader. This study suggests that bridging data analytics with classical models and methods in design engineering can bring success for data-driven design. Keywords: Big data, Design engineering, Innovation
Contact: Hou, Tianjun
Laboratoire G‚nie Industriel CentraleSupelec
France
1 INTRODUCTION
How to design good products for their customers is an eternal topic for product designers. Good design fulfils customer needs and brings great experiences, and therefore increases the profitability of industrial companies. Various design theories have been proposed. All highlight the importance of learning user concerns at the early phase of the product development process (Eppinger and Ulrich, 2015).
The involvement of customers in the process of new product development has been identified as a reliable source of competitive advantage. In traditional user-centred design, methods like interviews, questionnaires, surveys, focus groups, are conducted to gather information on user concerns. Although these methods have years’ history of application, they are often long haul and laborious (Jin et al., 2016). With the development of e-commerce, the large amount of online reviews provides rich information in less time and lower cost. A growing number of reviewers is willing to post their feedbacks independently on the internet. The review text is easy to access by web crawling tools. In this regard, the online review data are becoming a new information source for designers to understand their consumers (Liu, 2012). Compared to the data provided by traditional user-centric design methods, online review data has unprecedented features, offering new insights for product innovation and redesign. First, the large quantity enables designers to connect with a wide range of consumers. Second, with the timestamp information, the review data can be regarded as a flow of information, allowing designers to capture the changes of user preferences by comparing the reviews posted recently and those posted years ago. However, due to their large quantity, processing online reviews with only human effort is impossible. Natural language processing must be applied first, to extract and structure the keywords that describe user concerns (Zhang et al., 2016). In addition, even if keywords can be structured automatically, they must be further analysed to provide practical insights for product design.
In previous research of design-centred online review analysis, feature-based opinion mining was widely applied (Ravi and Ravi, 2015). These methods extract words and expressions describing product features, i.e., product components, product attributes, and whether users like/dislike the product features. Based on the structured “product feature - user opinion” pairs, different methods of data analytics had been developed to predict product longevity (Tuarob and Tucker, 2013), identify lead users (Tuarob and Tucker, 2014), propose product improvement strategies (Zhang et al., 2016), etc.
However, only focusing on product features does not allow designers to understand the full spectrum of customer concerns. Product features concern solely the product itself. How consumers interact with the product? In what conditions do consumers use the product? Answers to these questions are critical for drawing innovation leads (Yannou et al., 2013, Brown and Maier, 2015). Research has shown that in online reviews, reviewers talk about their innovative usages of the product, or even their own customizations of the product to meet their specific needs (Chou and Shu, 2014). The keywords related to this information is not extracted and structured in feature-based opinion mining.
In this context, we develop the following research questions: How to identify innovation leads from online reviews?
How to capture the changes in user preferences from online reviews?
To overcome the limitations of feature-based opinion mining, this study proposes an affordance-based online review analysis framework. We first construct a rule-based natural language processing method to extract and structure automatically the keywords describing product affordances and the associated usage contexts and user perceptions from review sentences. Then, we propose two methods based on semantic similarity evaluation and the Kano model, in order to gain insights for product innovation and redesign from the structured data. We test our methods using the online reviews of Kindle Paperwhite e-readers downloaded from amazon.com, based on which a set of innovation leads and redesign paths are provided for the design of a next-generation e-reader.
Our contributes to the literature are three-fold. First, for affordance-based design, we propose a method to identify product affordances from online reviews in a highly automatic and domain-independent manner. To the best of our knowledge, we are the first to study the similarities between affordances. Second, by innovatively applying the Kano model and affordance-based design into online review analysis, we bring traditional design methods new vitality in the era of big data. Third, we extend the application of design-centred online review analysis, by providing innovation leads and capturing the changes of user preferences, to guide decision making for the product design of a new generation. The remainder of this paper is organized as follows. Section 2 briefly describes the affordance-based design. Section 3 describes the research framework of our work. Section 4 presents the data
ICED19
structuration method, which identifies automatically product affordances and the associated usage contexts and user perceptions. In Section 5, the method for identifying innovation leads, is introduced. In Section 6, the method for capturing changes in user preferences is presented. Section 7 concludes the research.
2 AFFORDANCE-BASED DESIGN 2.1 The definition of affordance
The concept of affordance was firstly proposed by psychologist Gibson (1978) to explain how animals perceive the environment around them. It was defined as what the environment offers to the animal, whether it is beneficial or harmful. Maier and Fadel (2009) introduced this concept into design engineering to address the gap in traditional functional modelling, i.e., some products cannot be represented by input/output models of function. They propose affordance-based design paradigm by defining affordance as a relationship between two subsystems in which potential behaviours can occur, that would not be possible with either subsystem in isolation (Mata et al., 2015). For example, a ladder affords “support-ability”, a steering wheel of vehicle affords “turn-ability”.
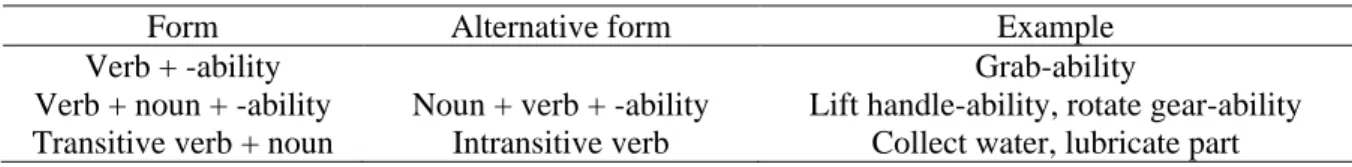
Since its proposition, describing the difference between function and affordance has prompted much discussion. Debate goes on, the consensus is that affordances do not include the notion of teleology (Gero and Kannengiesser, 2012). More specifically, functions refer to what a product is designed to do, while affordances refer to what users do with the product. Functions are from the designers’ perspective, while affordances are from users’ perspective. For that reason, affordances include not only the functions expected by designers, but also the unexpected usages revealed. Affordance has more commonly been described in the form of verb-ability (Table 1), such as maintainability, upgradability.
Table 1. Affordance description forms, summarized by Hu and Fadel (2012)
Form Alternative form Example
Verb + -ability Grab-ability
Verb + noun + -ability Noun + verb + -ability Lift handle-ability, rotate gear-ability Transitive verb + noun Intransitive verb Collect water, lubricate part 2.2 The novel affordance
Identifying unexpected usages is important for product design. They can be summarized as a list of affordances that designers can pay more attention during the redesign of “mature” products (Maier and
Fadel, 2009). This kind of unexpected usage is called novel affordance (Chou and Shu, 2014). More
specifically, when novel affordances are discovered and become important, they are often treated in isolation to stimulate innovation. Take the evolution of vacuum cleaner as an example, it was initially designed to suck the dirt on the carpet. It had the clean carpet-ability. Soon, customers began to use it to clean floors. However, its movability was bad, as it was bulk at that time. To overcome this problem, it came the upright vacuum cleaner, which had better movability (Maier and Fadel, 2009). 3 RESEARCH FRAMEWORK
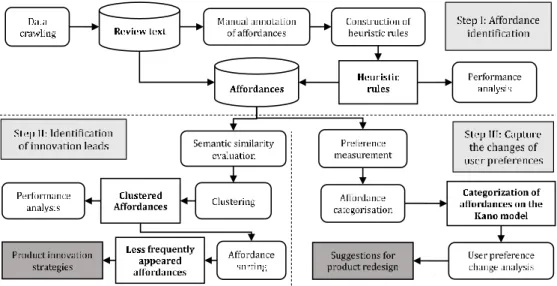
To learn how customers interact with the product, affordances must be identified. We take the online reviews of Kindle Paperwhite e-readers as our research object. In the first step, we identify affordances automatically based on the linguistic patterns of the review text. This is the basic portion of our research, including data crawling, manual annotation and heuristic rules construction (Figure 1). Only knowing the product affordances is not enough to guide product redesign. Novel affordances are highly informative for product innovation. Therefore, in the second step, we develop a data analytics method to identify innovation leads based on the automatically identified affordances. The theoretical basis is that novel affordances are likely to be talked about by fewer people. In this regard, we classify similar affordances and sort the affordances by their frequency of occurrence. This part of study includes similarity evaluation, clustering, performance analysis, and innovation leads identification (Figure 1). Meanwhile, as a flow of information, it possible to capture user preferences on product affordances overtime from online review data, which enable design companies to follow the trends in commerce rapidly and thus gain more market share. Therefore, in the third step, we develop another data
analytics method based on the automatically identified affordances. We measure users’ preference on the affordances with conjoint analysis and then categorize them on the Kano model. Changes of user preference can be observed through the online reviews posted in different timespans. This part of study includes preference measurement based on the Kano model, affordance categorization on the Kano model, user preference change analysis, suggestions for product redesign (Figure 1).
The logic of the three research parts is as follows. The affordance identification forms the base of the research. The identification of innovation leads and the capture of changes of user preference are two parallel data analytics methods provided for designers for decision making based on the structured data.
Figure 1. Research framework
4 IDENTIFICATION OF AFFORDANCES 4.1 Data description
We developed a data crawler to collect the online reviews of Kindle Paperwhite 3 (hereafter referred to as KP3) from 2015 to 2018. We keep only the online reviews having at least one helpful review vote, in order to filter fake reviews. In total, 7922 reviews are downloaded by the web crawler.
4.2 Manual annotation
We propose a rule-based method to identify keywords concerning affordances from the review text automatically. Rule-based methods rely on a set of manually created heuristic rules based on linguistic features of the text, like part of speech, dependency relation (Jin et al., 2016). Although affordance description forms are summarized in previous research, they are used in scientific papers. We need to know how reviewers describe product affordances in a web environment.
One of the authors and two students in design engineering are asked to identify the affordances described in 265 online review sentences randomly chosen from the review data. The three annotators make consensus among them to avoid subjective uncertainty. The manually annotated data is called ground truth, which means the human-defined labels that we try to match with the heuristic rules. The annotators are asked to structure the affordances in the following description form:
Afford the ability to [action word] [action receiver] [perception] [usage context]
This description form is derived based on the basic affordance description forms Table 1 and our observation of review text. In the basic description forms, the indispensable element is the verb, namely action word in our proposed form. Alternative elements are the object of the verb, namely action receiver in our proposed form. Two alternative elements, namely perception and usage context, are added, in order to capture more detailed information related to the affordances, as their presence modifies the meaning of the affordance. Perception defines in which dimension and how well the product can support potential behaviours in the reviewer’s view (Mata et al., 2015). Usage context defines the physical surroundings in which the behaviours take place.
In the ground truth, 78 keywords concerning action word, 26 concerning action receivers, 37 concerning perceptions and 16 concerning usage contexts are annotated.
ICED19
4.3 Construction of identification rules
Open-sourced natural language processing packages are applied to obtain the linguistic patterns of the 265 review sentences, including part of speech, dependency relation, verb group, word derivation, synonymy. Based on our observation of the ground truth and their linguistic patterns, we construct the following 12 heuristic rules to identify affordances from online review sentences. As the indispensable element in the description form, action words are firstly targeted. Alternative elements are then identified based on the identification of action words.
Identification of action words:
IF the word is verb, THEN is labeled with action word (R1)
IF is noun or adjective AND has suffix -ility, -ilities, -able AND is derived
from a verb, THEN is labeled with action word (R2)
IF the word is stative verb, THEN is not labeled with action word (R3) IF the word is emotional verb, THEN is not labeled with action word (R4) Identification of action receivers:
IF the word is object of its head word , AND is action word, THEN is
labeled with action receiver. (R1)
IF the word is subject in passive voice of its head word , AND is action word,
THEN is labeled with action receiver. (R2)
IF the word is action word in clausal modifier of its head word , AND has its own subject AND is noun, THEN is labeled with action receiver. (R3) Identification of perceptions:
IF the word is adverb AND its head word is action word in verb or adjective AND has antonym, THEN is labeled with perceived quality. (R1) IF the word is adjective AND its head word is action word in noun AND has
antonym, THEN is labeled with perceived quality. (R2)
IF the word is adjective AND it is the open clausal complement of its head word , AND is action word, THEN is labeled with perceived quality. (R3) IF the word is negation of its head word , AND is action word, THEN is
labeled with perceived quality. (R4)
Identification of usage contexts:
IF the word is positional preposition AND is the head word of AND is the object of preposition of , THEN is labeled with usage context. (R1) 4.4 Evaluation of the performance of affordance identification algorithm
4.4.1 Evaluation metrics
The evaluation is based on the comparison of automatic identification results and the ground truth. Three parameters are employed: recall, precision and f-score. Precision is the fraction of relevant items among the automatically identified items. Recall is the fraction of relevant items among the ground truth. F-score is the harmonic average of precision and recall, which evaluates the overall accuracy, where “0” means that the automatic identification results are totally different with the ground truth, “1” means that they are exactly the same.
4.4.2 Requirements on the performance
Before evaluation, we specify two requirements on the performance. First, all the heuristic rules must be necessary, which means that the f-score should get better when one iteratively adds the rules into the algorithm. Second, due to the variety nature of natural language, mistakes in the identification results cannot be avoided in the open-sourced natural language processing package. In this regard, manual correction of the mistakes is still necessary. To ensure that the manual correction can be finished timely, the heuristic rules must have sufficient f-score. We set the lowest bar of the f-score at 67%, which corresponds to the feature-based opinion mining proposed by Zhang et al. (2016).
4.4.3 Results
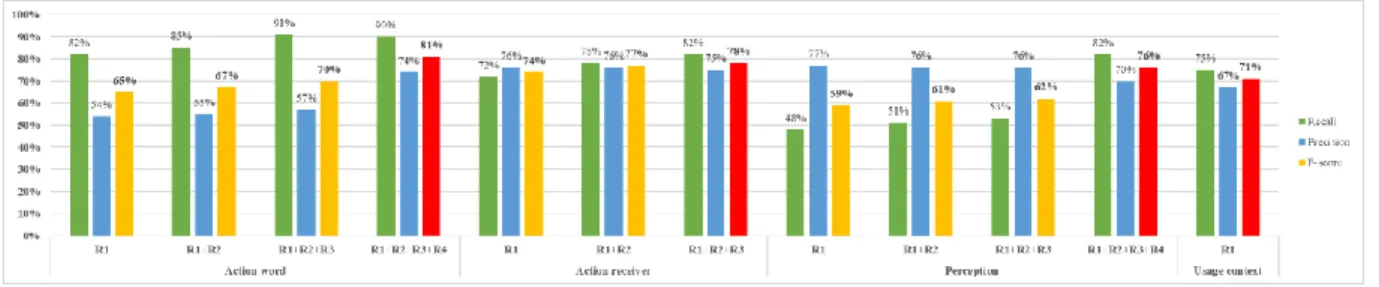
Figure 2 illustrates the recall, precision and f-score for the identification of the four elements in the proposed affordance description form. As can be seen, the two requirements are fulfilled, as f-score gets better by iteratively adding rules into the algorithm, and all the final f-scores are above 67%. Our 12 heuristic rules may be considered as much satisfactory for automatically identifying affordances in customer reviews.
Figure 2. Performance of the proposed affordance identification method
5 INNOVATION LEADS IDENTIFICATION
5.1 The novelty of affordance and the frequency of occurrence
The proposed automatic affordance identification method allows designers to learn the affordances of and the associated user perceptions from online reviews. However, the structure data are just raw data. We need to process further analysis to provide meaningful insights into practice. Therefore, in this section, we propose a method to identify innovation leads from the structured affordances.
Empirically, when novel things come out for the first time, they are talked about by fewer people. Based on this evidence, we sort the affordances by the frequency of occurrence. The affordances with lower frequency are considered to be more novel. However, in the ground truth, many affordances are similar. For that matter, we must cluster similar affordances before sorting them.
It has to be emphasized that the low frequency does not necessarily mean that the affordance must be novel. However, it is more probable that novel affordances are talked about by fewer people. Designers are more likely to find innovation leads from these affordances. For novel product design, we care more about the novel or even absurd ideas. We can tolerate high false alarm and don’t want to miss a new idea (Urban and Hauser, 2004).
5.2 The evaluation of semantic similarity between affordances
The definition of similarity depends on the user of the data. Designers care about what product features relate to the affordances. Therefore, we define that the two affordances are similar if they concern similar product components or attributes. For example, for an e-reader, the ability to hurt eyes mainly concerns the background light of the screen, while the ability to hurt hands mainly concerns the weight and the shape of the e-reader. Although they both have the word “hurt” in the description, they are different affordances. We propose a method to automatically evaluate the semantic similarity between affordances based on distributional similarity measurement, like Word2Vec (Mikolov et al., 2013). The underlying assumption of this kind of measurement is that if the surrounding words of the two target words are similar, then they are similar. Word2Vec takes the whole document as input and produces a large dimension vector space based on the training of a two-layer neural network natural language model. Each word in the corpus is represented as a vector in the space. The vector is the distributional representation of the surrounding words of the target word. Therefore, all the words appeared in the online reviews are embedded into vectors. The semantic similarity between two words is quantified by the cosine of the two vectors, where “0” means that the two words are totally different, “1” means that the two words are exactly the same.
However, an affordance has two elements: action source and action receiver. The similarity must be defined based on the similarity of the two elements. With a manual trial of clustering similar affordances in the ground truth, we propose to measure the similarity between two affordances by the harmonic mean of the similarity between the two action words and the two action receivers. The harmonic mean of two numbers is one of the several kinds of average metrics in mathematics. It equals to “0” when one of the numbers is “0”. And it equals to “1” only when both two numbers are “1”.
ICED19
5.3 Evaluation of the performance in similar affordance classification 5.3.1 Process
We apply the proposed automatic affordance identification method on 7922 reviews of KP3. After manual correction, 496 affordances are identified. Word2Vec is used to obtain the vector representation of each word. For each pair of the 496 affordance descriptions, their similarity is calculated with the proposed semantic similarity evaluation method.
Hierarchical clustering is then applied to cluster the affordances if their similarity is larger than a threshold (in this experiment, ). Next, the most frequently appeared affordance in the cluster is considered to be the name of the cluster.
For checking the correctness of this automatic clustering procedure, two human annotators are asked to check the results of affordance clustering. If an affordance description in the cluster is not similar to the name of the cluster, the annotators put it into the correct cluster. To avoid the subjectivity in the evaluation, the two annotators make a consensus between them.
5.3.2 Results
The 496 descriptions are clustered into 70 clusters. As reported by the human annotators, 88.5% affordances are correctly categorized by the primary automatic similarity procedure. This performance is comparable to the previous studies in feature-based opinion mining (90%) (Chen et al., 2016), meaning that the result is considered satisfactory.
5.4 Identification of innovation leads
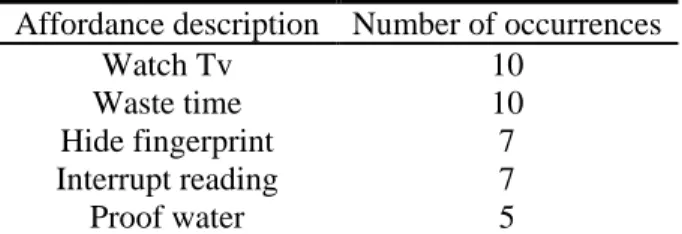
Table 2 lists the ten least frequently mentioned affordance clusters. These affordances are relatively “unintended” when designer was developing the product, and thus carry innovative ideas for improving the KP3, or even for designing new products. For example,
The ability to proof water suggests that e-readers that can be used in the bathtub may be developed1.
The ability to interrupt reading suggests that e-readers should prevent users from being interrupted by real-time push notifications, like messages, emails, etc.
The ability to waste time suggests that a product helping users manage their time may be designed.
Table 2. Five least frequently appeared clusters
Affordance description Number of occurrences
Watch Tv 10
Waste time 10
Hide fingerprint 7
Interrupt reading 7
Proof water 5
6 CAPTURE THE CHANGES OF USER PREFERENCES 6.1 The Kano model
The Kano model is a seminal theory for product development and customer satisfaction (Figure 3, left) (Kano, 1984). It classifies product features into five categories based on the asymmetric relation between user preference and the absence/presence of product attribute: must-be attributes, performance attributes, attractive or exciter attributes, indifferent attributes and reverse attributes2.
To do so, the Kano survey is applied to ascertain the customer satisfaction of an attribute (Figure 3, right). During the survey, each participant is asked to rate their satisfaction level if 1) the attribute is present on the product, and 2) the attribute is absent on the product. Then, a Kano evaluation matrix is
1
It turns out that, a few weeks ago, a new version of Kindle was released on the market, and its major novel attribute was to be waterproof.
2
Questionable attribute is not an actual category in the Kano model. It means that there was a mistake in selecting a survey answer.
constructed based on the survey results. Finally, for each attribute, the designers count the number of participants for each category in the Kano model, which determines one or several dominant categories.
Figure 3. The Kano model (left) and the Kano survey (right)
6.2 Measuring user preference on affordances by conjoint analysis
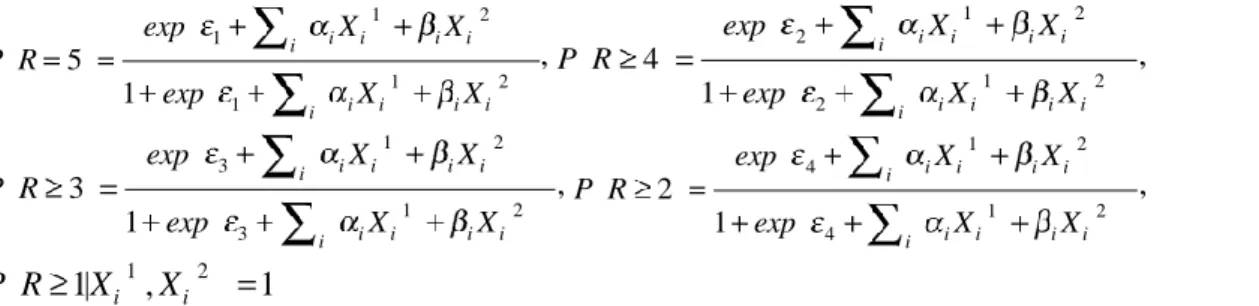
Through our observation, online reviews present a similar asymmetric relation between the star rating and the opposite perceptions on product affordance. For example, two 5-star reviews said, “I do not have to charge my KP every day”, and “I charge it every other day, so the small battery is not a problem”. Regardless of the “charge ability” or the “not charge ability”, both reviewers were satisfied. We particularly focus on the affordance on which people have opposite perceptions. Conjoint analysis based on the ordered logit model is applied to quantify the weight of each perception to the star-rating.
1 2 1 1 2 1 5 1 i i i i i i i i i i exp X X P R exp X X , 1 2 2 1 2 2 4 1 i i i i i i i i i i exp X X P R exp X X , 1 2 3 1 2 3 3 1 i i i i i i i i i i exp X X P R exp X X , 1 2 4 1 2 4 2 1 i i i i i i i i i i exp X X P R exp X X , (1) 1 2 1| i , i 1 P R X X
In this equation, the star-rating
R
has five ordinal values from 1 star to 5 stars. Xi(1) and Xi(2) represent the two opposite perceived quality that the reviewers have on the i-th affordance X . The value of i(1) i X
and Xi(2) is binary. Xi(1) 1 (Xi(2) = 1) means that the reviewer perceived the quality of
X
i as relatively low (high), orX
i is absent (existent). Both Xi(1)and Xi(2) = 0 means that the reviewer does not mention the affordanceX
i, and he/she does not care about the quality of the affordance. i and i denote theweights of the opposite perceived qualities of X in the star rating. i
6.3 Categorizing the affordances in the Kano model
After i and i are quantified, each pair of coefficients i and i are plotted in the Cartesian coordinate system by two points: Ai ( 1, i) and Bi (1, i). The affordance
X
i is categorized in the Kano model based on the slope2
i i
i
K and the intercept
2
i i
i
M of segment A B (Figure 3, i i
left) with the rules illustrated in Table 3, where k (k 0) and m (m 0) are the thresholds.
Table 3. Categorization rules according to the parameters K, M on the Kano model
Categorization 0 K Reverse attribute 0 K k M m or M m Questionable attribute m M m Indifferent attribute K k M m Must-be attribute m M m Performance attribute M m Attractive attribute
ICED19
The differences between our method of using the Kano model and the original Kano survey comes from the unstructured nature of online review data. In a Kano survey, each participant is required to give his/her choices in two conditions, i.e. the absence and the presence of the attribute whereas, in our study, reviewers do not have to mention every affordance of the product in their review text. Consequently, we categorize the affordances based on the aggregated preference of the reviewer group.
6.4 Analysis of the changes in user preferences
8715 online reviews of Kindle Paperwhite 2 (hereafter referred to as KP2) posted from the year 2013 to 2015 are downloaded. Our proposed automatic affordance identification method is applied on the online reviews of KP2 and that of KP3, representing two consecutive timespans from 2013 to 2018. After manual correction, the affordances having opposite perceptions are manually identified. We focus on the 30 affordances that appear most frequently in each timespan.
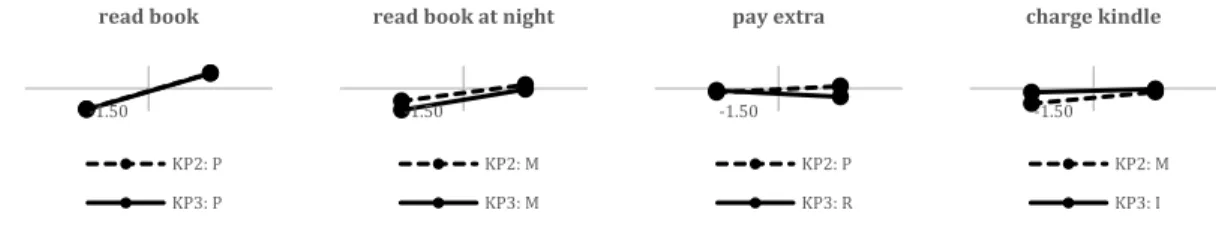
Then, we conduct conjoint analysis on the star ratings of the online reviews of KP2 and KP3 and the opposite perceptions on the 30 common affordances. The affordances are categorized in the Kano model following the rules listed in Table 3 (in this case study, k 0.2 and m 0.2). Normally, in the Kano model, product attributes should appear as “attractive” and become “must-be”. Based on the visualization of user preference on the Kano model, 25 out of 30 affordances follow this pattern. From the results, we find several interesting changes in comparing the two Kano plots corresponding to the two timespans (Figure 4). First, “pay extra-ability” was an indifferent attribute that is becoming a reverse attribute. In fact, Amazon sells the Kindle e-reader of two configurations: one with advertisements and one without advertisements. Customers have the option to remove the advertisement by paying an extra 20 dollars. Since 2015, customers are voicing dissatisfaction even if they can remove the advertising. By reading the related reviews, we learn that today’s customers are tired of this marketing strategy. They reported that the upgrade option is just a trick to make them pay more money. Second, “charge-kindle ability” is becoming an indifferent affordance as the parameter
M
gets higher. Our assumption is that compared with today’s other electronic products, e-readers have a much larger battery capacity for ordinary use (i.e. about one month). It is also getting easier to find KP-compatible battery chargers as the micro-USB connector is becoming increasingly common on electronic products. Third, read book-ability in general is a performance attribute, while read book at night-ability is a must-be attribute, which suggests that improving reading experience in other usage contexts—such as reading in the sun, on plane, on the beach, for example—may help improve user satisfaction.Our study suggests that for next-generation e-readers, designers can keep the battery capacity, but pay more attention to their market strategy. Selling the with advertisements-version is questionable.
Figure 4. Representation of product affordances on the Kano model
7 CONCLUSION
Online reviews have been studied by many researchers in product design due to their rich content and high reliability. Unlike the previous research on feature-based opinion mining, we provide a data structuration method that can automatically identify product affordances and the associated usage conditions and perceptions from online reviews, which provide more information for designers to understand their customers. In addition, we provide two data analytics method to identify innovation leads and capture the changes in user preferences based on the structured data, which were less discussed in previous research. To evaluate the effectiveness of our proposed framework, we conducted experiments and case studies using the online reviews of Kindle Paperwhite (KP) e-readers. A set of practical suggestions for the design of next-generation e-reader has been drawn. Remind that the automatization relies solely on the linguistic features of the text and is completely domain-independent. Our proposed framework can be easily applied to the online reviews of other product categories.
-1.50
read book
KP2: P KP3: P
-1.50
read book at night
KP2: M KP3: M -1.50 pay extra KP2: P KP3: R -1.50 charge kindle KP2: M KP3: I 2465
From our research trial, we generalise three steps in online review analysis. First, text data must be structured before further analysis. Linguistic patterns provide an effective way to automatically identify keywords from text data. Second, we have to use the right domain knowledge to explain the practical meaning of the statistical patterns of the data. In our research, our method to identify innovation leads relies on the fact that novel affordances are talked by fewer people. Third, classical design models and methods should be reformed in the context of web data. For example, in our research, we have adapted the affordance description form and the Kano model to the unstructured nature of the online review data. For future work, our research suggests that the automatization still has room for improvement. After getting more manual annotation results, applying machine learning and deep learning method may improve the performance. Besides, the set of practical suggestions drawn from online reviews could be used to further investigate raised issues with appropriate focus groups, questionnaires and surveys. Future research will be conducted on how to combine the present analysis of anonymous online review data and nominative data provided by user-centred design methods to make the research results more convincing.
REFERENCES
Brown, D.C. and Maier, J.R. (2015), “Affordances in design”, Artificial Intelligence for Engineering Design,
Analysis and Manufacturing, Vol. 29, pp. 231–234.
Chen, Y., Zhao, Y., Qin, B. and Liu, T. (2016), “Product Aspect Clustering by Incorporating Background Knowledge for Opinion Mining”, PloS one, Vol. 11, p. e0159901.
Chou, A. and Shu, L. (2014), “Towards extracting affordances from online consumer product reviews”, ASME
2014 International Design Engineering Technical Conferences and Computers and Information in Engineering Conference. American Society of Mechanical Engineers, pp. V007T07A030–V007T07A030.
Eppinger, S. and Ulrich, K. (2015), Product design and development, McGraw-Hill Higher Education.
Gero, J.S. and Kannengiesser, U. (2012), “Representational affordances in design, with examples from analogy making and optimization”, Research in Engineering Design, Vol. 23, pp. 235–249.
Gibson, J. J. (1978), “The ecological approach to the visual perception of pictures”, Leonardo, Vol. 11, pp. 227–235.
Hu, J. and Fadel, G. M. (2012), “Categorizing affordances for product design”, ASME 2012 International Design
Engineering Technical Conferences and Computers and Information in Engineering Conference.
American Society of Mechanical Engineers, pp. 325–339.
Jin, J., Liu, Y., Ji, P. and Liu, H. (2016), “Understanding big consumer opinion data for market-driven product design”. International Journal of Production Research, Vol. 54, pp. 3019–3041.
Kano, N. (1984), “Attractive quality and must-be quality”, Hinshitsu (Quality, The Journal of Japanese Society for Quality Control), Vol. 14, pp. 39–48.
Liu, B. (2012), “Sentiment analysis and opinion mining”, Synthesis lectures on human language technologies, Vol. 5, pp. 1–167.
Maier, J. R. and Fadel, G. M. (2009), “Affordance-based design methods for innovative design, redesign and reverse engineering”, Research in Engineering Design, Vol. 20, p. 225.
Mata, I., Fadel, G. and Mocko, G. (2015), “Toward automating affordance-based design”, Artificial Intelligence
for Engineering Design, Analysis and Manufacturing, Vol. 29, pp. 297–305.
Mikolov, T., Chen, K., Corrado, G. and Dean, J. (2013), “Efficient estimation of word representations in vector space”, arXiv preprint arXiv: Vol. 1301 No. 3781.
Ravi, K. and Ravi, V. (2015), “A survey on opinion mining and sentiment analysis: Tasks, approaches and applications”, Knowledge-Based Systems, Vol. 89, pp. 14–46.
Tuarob, S. and Tucker, C. S. (2014), “Discovering next generation product innovations by identifying lead user preferences expressed through large scale social media data”. ASME 2014 International Design
Engineering Technical Conferences and Computers and Information in Engineering Conference.
American Society of Mechanical Engineers, pp. V01BT02A008–V01BT02A008.
Urban, G. L. and Hauser, J. R. (2004), “Listening in to find and explore new combinations of customer needs”,
Journal of Marketing, Vol. 68. No. 2, pp. 72–78
Yannou, B., Yvars, P.-A., Hoyle, C. and Chen, W. (2013), “Set-based design by simulation of usage scenario coverage”. Journal of Engineering Design, Vol. 24, pp. 575–603.
Zhang, H., Sekhari, A., Ouzrout, Y. and Bouras, A. (2016), “Jointly identifying opinion mining elements and fuzzy measurement of opinion intensity to analyze product features”, Engineering Applications of