Université de Montréal
Knee gait kinematics: describing a normal cohort
par Panagiota Toliopoulos Département de sciences biomédicales Faculté de médecine
Mémoire présenté à la faculté de médecine en vue de l'obtention du grade de maîtrise en sciences biomédicales option musculosquelettique
Avril 2017
© Panagiota Toliopoulos, 2017
Université de Montréal
Résumé
Introduction: Le cycle de la marche a été étudié par plusieurs disciplines. Malgré plusieurs études, notre compréhension actuelle du cycle de la marche ne nous permet pas de modeler la cinématique fémoro-tibiale d'une manière qui est utile en clinique. L'objectif primaire de notre étude est de caractériser la cinématique fémoro-tibiale lors de la marche chez des sujets sains en utilisant l'appareil KneeKGMD. Matériels et méthodes: Quatre-vingt-quinze patients, cinquante-deux femmes et quarante-trois hommes, sans pathologie connue de l'appareil locomoteur ni des membres inférfieurs, ont été recrutés pour participer à cette étude. Chaque patient a eu un examen à la marche de sa cinématique fémoro-tibiale avec l'appareil KneeKGMD. Tous ont complété les questionnaires knee injury and osteoarthritis outcome score (KOOS) et 12-item Short Form Health Survey (SF-12) et ont eu une radiographie des membres inférieurs sur long films. Les résultats du cycle de marche ont été analysés dans le plan sagital, transverse et frontal. Des comparaisons entres les genoux droit et gauches des patients ainsi qu'entre les deux sexes ont été faites. Les résultats obtenus ont été corrélés avec les différentes variations anatomiques estimées par des angles mesurés sur les examens radiologiques. Résultats: En comparant les hommes et les femmes, des différences significatives ont été trouvées dans les plans sagital, transverse et frontal. Dans le plan sagital, les femmes ont une plus grande amplitude de flexion que les hommes durant l'oscillation intermédiare et finale (0.002 ≤ p ≤ 0.05). Dans le plan transverse, plus de rotation interne du genou à été observée chez les femmes que chez les hommes durant la totalité de la phase d'oscillation (0.005 ≤ p ≤ 0.05). Dans le plan frontal, les femmes sont plus en abduction que les hommes durant tout le cycle de la marche (0.001 ≤ p ≤ 0.002). En comparant les genoux droit et gauche, des différences significatives ont été trouvé seulement dans le plan frontal dans lequel les genoux sont plus en adduction que les genoux droits durant toute la phase d'oscillation du cycle de la marche (0.005 ≤ p ≤ 0.04). Aucune corrélation
significative n'a pu être établie entre les hip-knee-ankle (HKA) angles et les angles d'abduction et d'adduction durant la marche (-0.40 ≤ r ≤ -0.42, p<0.001). Discussion-conclusion: Les résultats de notre étude contribuent à avancer notre compréhension du cycle de la marche et introduisent le concept que les hommes et les femmes peuvent présenter des différences dans la cinématique lors du cycle de la marche notamment dans le plan frontal. De plus, l'alignement statique ne semble pas corréler avec l'alignement dynamique.
Mots-clés: genou; mouvement; KneeKG; marche; cinématique; normal
Abstract
Introduction: The gait cycle has been studied by many disciplines. Despite multiple studies, our current understanding of the gait cycle does not allow us to model femoro-tibial kinematics in a clinically relevant manner. The primary objective of our study was to characterize femoro-tibial kinematics in healthy subjects using the KneeKGTM apparatus. Materials and methods: Ninety-five patients, fifty-two females and forty-three males, without any known musculoskeletal or lower limb pathology, were recruited to participate in our study. Each patient underwent a KneeKGTM examination. All patients completed the knee injury and osteoarthritis outcome score (KOOS) and the 12-item Short Form Health Survey (SF-12) questionnaires and had full-length weight bearing (FLWB) x-rays. Gait cycle kinematics were generated in the sagittal motion, transverse rotation, and the frontal plane and were compared between men and women and between the right and left knees of the same patient. The results obtained were also correlated with the anatomic variations found in patients, which were estimated by angles measured on the FLWB x-rays. Results: When comparing men and women, significant differences were found in the sagittal motion and transverse rotation planes and in the entirety of the gait cycle in the frontal plane. In the sagittal plane, women have greater amplitude of flexion than men during the mid-swing and terminal swing phase (0.002 ≤ p ≤ 0.05). In the transverse plabe, more internal rotation of the knee is observed in women than in men during the entire swing phase (0.005 ≤ p ≤ 0.05). In the frontal plane, more abduction occured in women compared to men throughout the entire gait cycle (0.001 ≤ p ≤ 0.002). When comparing the right and left knees, significant differences were only found in the frontal plane during which the right knees were more in adduction than the left knees during the entire swing phase (0.005 ≤ p ≤ 0.04). No meaningful correlations could be
made between radiographic hip-knee-ankle (HKA) ankle and abduction-adduction angles during the gait cycle (-0.40 ≤ r ≤ -0.42, p<0.001). Discussion-conclusion: The results of our study contribute to better understanding the kinematics of the gait cycle and foster the notion that cohorts should be divided for gender to account for gait differences in the frontal plane. Furthermore, static alignment does not appear to correlate with dynamic alignment.
Keywords: knee; movement; KneeKG; gait; kinematics; normal
TABLE OF CONTENTS
RÉSUMÉ...ii ABSTRACT...iv TABLE OF CONTENTS...vi LIST OF TABLES...viii LIST OF FIGURES...ix LIST OF ABBREVIATIONS...x ACKNOWLEGMENTS...xii 1. LITERATURE REVIEW...p1 1.1 ANATOMY 1.2 ALIGNMENT 1.3 FEMORO-TIBIAL RELATIONSHIP DURING JOINT MOTION 1.4 GAIT CYCLE 1.4.1 KNEE GAIT DYNAMICS 1.4.2 KNEE GAIT DYNAMICS: SAGITTAL MOTION 1.4.3 KNEE GAIT DYNAMICS: TRANSVERSE ROTATION 1.4.4 KNEE GAIT DYNAMICS: FRONTAL PLANE 1.4.5 KNEE GAIT DYNAMICS: TRANSLATION 1.5 METHODS TO MEASURE KNEE KINEMATICS 1.5.1.THE KNEEKG APPARATUS 1.5.2 STUDIES USING THE KNEEKG 2. PROBLEM AND OBJECTIVES...p15 2.1 RESUMING THE PROBLEM 2.2 OBJECTIVES2.2.2 SECONDARY OBJECTIVES 2.3 HYPOTHESIS 2.3.1 HYPOTHESIS #1 2.3.2 HYPOTHESIS #2 2.3.3 HYPOTHESIS #3 3. METHODOLOGY...p18 3.1 STUDY POPULATION 3.2 INCLUSION CRITERIA 3.3 EXCLUSION CRITERIA 3.4 DATA COLLECTION 3.5 DATA ANALYSIS 4. RESULTS...p25 4.1 STUDY POPULATION 4.2 DEMOGRAPHIC AND GONIOMETRIC DATA 4.3 SELF-REPORTED QUESTIONNAIRE DATA 4.4 KINEMATIC DATA 4.4.1 SAGITTAL MOTION 4.4.2 TRANSVERSE ROTATION 4.4.3 FRONTAL PLANE 4.5 RADIOLOGICAL DATA 5. DISCUSSION...p48
BIBLIOGRAPHY...p56
List of tables
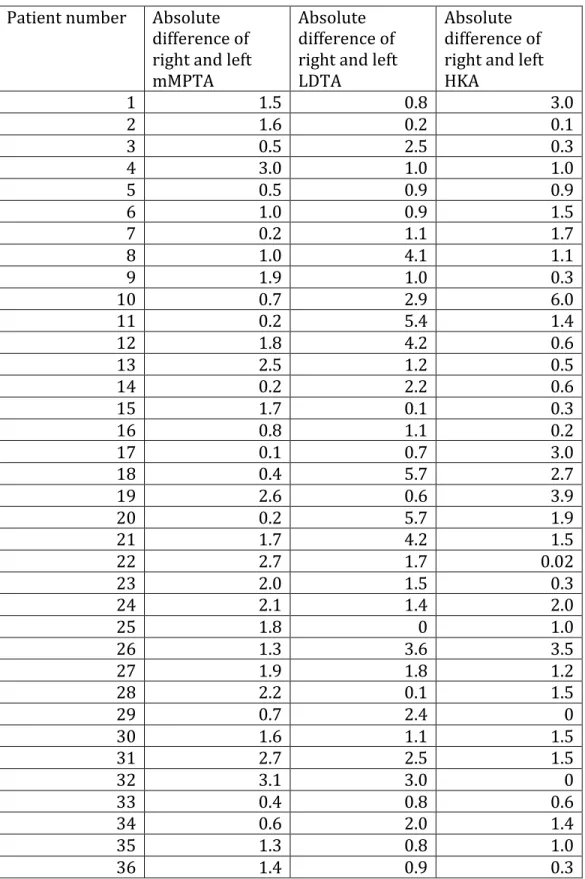
Table 1 List of evaluations Table 2 Demographic and goniometric data Table 3 KOOS questionnaire data Table 4 SF-12 questionnaire data Table 5 Walking speed Table 6 Differences in the sagittal motion plane between genders and between right and left knees Table 7 Differences in the transverse rotation plane between genders and between right and left knees Table 8 Differences in the frontal plane between genders and between right and left knees Table 9 Radiological data of entire cohort Table 10 Radiological data of female and male subjects Table 11 Radiological data of female and male subjects with knees in varus Table 12 Radiological data of female and male subjects with knees in valgus Table 13 Radiological data of right and left kneesTable 14 Absolute value differences between the mMPTA, LDTA, and HKA angles of the
same subject
Table 15 Mean of the absolute value differences between the mMPTA, LDTA, and HKA
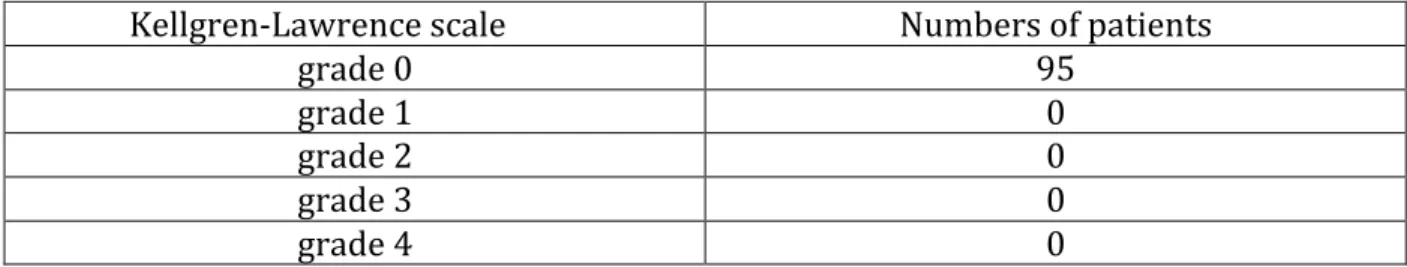
angles of the right and left knees of the same subject Table 16 Our cohort according to the Kellgren-Lawrence grading scale Table 17 Pearson correlation of HKA angle and measurements in the frontal plane
List of figures
Figure 1 The knee joint Figure 2 Lower limb alignment Figure 3 The six degrees of freedom of the knee Figure 4 The gait cycle Figure 5 The KneeKGTM exoskeleton Figure 6 Subjects recruited Figure 7 Summary of knees included in study Figure 8 Kinematic data in the sagittal motion plane Figure 9 Kinematic data in the transverse motion plane Figure 10 Kinematic data in the frontal planeLIST OF ABBREVIATIONS
ACL: anterior cruciate ligament ADL: activities of daily living aLDFA: anatomic lateral distal femoral angle aMPTA: anatomic medial proximal tibial angle ÉTS: Ecole de Technologie supérieure de Montréal FLWB: full length weightbearing HKA: hip-knee-ankle KOOS: knee injury and osteoarthritis outcome score LDTA: lateral distal tibial angle LIO: Laboratoire de recherche en imagerie et orthopédie de l'École de Technologie supérieure de Montréal max: maximum MCL: medial collateral ligament MCS: mental component score min: minimum mLDFA: mechanical lateral distal femoral angle mLPFA: mechanical lateral proximal femoral angle mMPFA: mechanical medial proximal femoral angle mMPTA: mechanical medial proximal tibial angle MPFA: medial proximal femoral angle MRI: magnetic resonance imaging OA: osteoarthritis
PCL: posterior cruciate ligament PCS: physical component score PCT: point cluster technique PLC: postero-lateral corner QOL: quality of life SD: standard deviation SF-12: 12-item Short Form Health Survey SF-36: 36-item Short Form Health Survey TKA: total knee arthroplasty WOMAC: Western Ontario and McMaster Universities Osteoarthritis Index
ACKNOWLEDGEMENTS
First and foremost, I would like to express my sincere gratitude to my supervisors, Dr. Vendittoli and Dr. Desmeules, for their continuous support, their patience, their motivation, and their enthusiasm. I would also like to thank the research team at Maisonneuve-Rosemont Hospital for their help in subject recruitment and data collection. My sincere thanks also goes to Dr. Nicola Hagemeister and Dr. Alex Fuentes for offering me their knowledge and expertise on the KneeKGTM.
1. Literature review
1.1 Anatomy
The knee is an articulation formed by the relationship of the following bones: the femur, the tibia, and the patella (Figure 1). The femur is a large bone consisting of the medial condyle, the lateral condyle, and the trochlea. The tibia is composed of a convex lateral plateau and a concave medial plateau while the patella is the biggest sesamoid bone in the human body. The knee is a synovial joint that is often described as a compound joint and is composed of the femorotibial and femoropatellar segments, which respectively join the two femoral condyles with the superior articular surface of the tibia and with the articular surface of the patella. The tibiofibular joint, unlike the femorotibial and femoropatellar joints, does not directly contribute to the knee structure but does participate in the gliding of the fibula against the tibia during rotation of the leg. Figure 1. The knee joint Unknown author. Reproduced from:
http://www.humankinetics.com/excerpts/excerpts/many-ligaments-make-up-knees- The knee joint stability is conferred by the many soft tissue structures surrounding the bones such as muscles, tendons, ligaments, and menisci. Clinically, the most important ligaments of the knee are the collateral ligaments, which ensure the lateral stability of the knee, and the cruciate ligaments, which ensure the antero-posterior stability of the knee. There are two cruciate ligaments, the anterior cruciate ligament (ACL) and the posterior cruciate ligament (PCL) which respectively originate from the antero-medial surface of the tibia and the posterior surface of the tibia and respectively insert on the medial side of the lateral femoral condyle and the lateral side of the medial femoral condyle. The ACL primarily limits anterior translation and internal rotation of the tibia with respect to the femur while the PCL limits posterior translation of the tibia on the femur [1, 2]. Laterally, the stability of the knee is ensured by the postero-lateral corner (PLC), which is composed of the lateral collateral ligament, the popliteal tendon, the popliteofibular ligament, and the postero-lateral capsule. The ilio-tibial band along with the long and short head of the biceps femoris provides additional dynamic reinforcement to the PLC. The PLC's primary role is to resist varus, tibial external rotation, and posterior translation [3]. Medially, stability is ensured by the medial collateral ligament (MCL), which mainly resists valgus forces [4]. The knee is also composed of the internal and external menisci, which have fixed horns and mobile bodies that deform during movement in order to maintain better contact between the femoral condyles and the tibial plateau. The menisci are primarily composed of water (70%) and of connective tissue such as collagen and proteoglycans. In addition to conferring stability to the joint, they also provide articular lubrication, proprioception, and a more even transmission of forces on the joint [5]. In addition, the knee has fourteen bursae out of which five are considered more clinically relevant: the prepatellar bursa situated in front of the kneecap, the semimembranous bursa between the semimembranous muscle and the medial head of the gastrocnemius, the infrapatellar
bursa underneath the kneecap, the suprapatellar bursa above the kneecap underneath the quadriceps tendon, and the pes anserine bursa under the insertion of the sartorius, gracilis, and semitendinosis muscles.
Many muscles either originate from or insert into the knee. In the anterior face of the knee, the quadriceps muscle inserts itself on the patella and the sartorius and gracilis muscles insert on the anteromedial side of the internal tibial metaphysis. Additionally, the ilio-tibial band descends along the lateral side of the thigh and the femoral condyle, inserting itself in the lateral side of the external tibial plateau. In the posterior knee, three thigh muscles insert themselves: the semimembranosus, the semitendinosus, and the femoral biceps. Furthermore, the posterior knee is also the insertion site of the gastrocnemius, the popliteus, and the plantaris. In the gait cycle, fourteen muscles contribute to knee control. Details of the gait cycle are discussed below. It is important to retain that knee flexion and extension are important movements in the cycle. The quadriceps with its four heads (vastus intermedius, vastus lateralis, vastus medialis oblique, and vastus medialis longus) is primarily responsible for extension. The popliteus and the biceps femori short head are responsible for flexion [6]. Furthermore, the popliteus also plays a role in internal tibial rotation.
1.2 Alignment
The mechanical axis of the lower extremity is formed by a line passing from the center of the femoral head to the center of the ankle joint (Figure 2) [7]. This line, in bipedal standing position, is usually at a 3o angle with respect to the vertical axis, which is defined as a vertical line that crosses the center of the pubic symphysis and is measured on standard anteroposterior radiographs [8]. As each bone has its own mechanical axis, the mechanical axis of the lower extremity can be divided into thefemoral mechanical axis (from the center of the head of the femur to the intercondylar notch of the distal femur) and the tibial mechanical axis (from the center of the proximal tibia to the center of the ankle). Many angles can be measured between the mechanical axes of the lower extremity and other predefined lines. The mechanical lateral proximal femoral angle (mLPFA) is the angle between the mechanical axis of the femur and a line joining the tip of the greater trochanter and the center of the femoral head. It is around 90o in normal knees [9]. The mechanical lateral distal femoral angle (mLDFA) is the lateral angle between the mechanical axis of the femur and the distal femoral articular surface. It usually measures around 88 o in normal knees [10]. The mechanical medial proximal tibial angle (mMPTA) is the medial angle between the mechanical axis of the tibia and the distal femoral articular surface and also measures around 87o in normal knees [10]. The hip-knee-ankle (HKA) is the medial angle formed between the mechanical axes of the femur and the tibia. It was historically thought be around 180 degrees in normal knees but new studies show that a fraction of the population may have 3o or more of varus [11-13]. The anatomic axis of the lower extremity is defined as a mid-diaphyseal line through the femur and tibia. Just like with the mechanical axis of the lower extremity, many angles can be measured between the anatomic axis and other predefined lines. The anatomic lateral distal femoral angle (aLDFA) is the angle between the anatomic axis of the femur and the knee joint line of the femur. On average, it is 81 degrees in normal knees [7, 10]. The medial proximal femoral angle (MPFA) is the angle between the anatomic axis of the femur and a line joining the center of the femoral head to the proximal tip of the greater trochanter. The MPFA measures around 84o in normal knees [9]. The lateral distal tibial angle (LTDA) is the angle between the tibial anatomical axis and the distal tibial articular surface. It normally measures around 89o [9].
Figure 2. Lower limb alignment Author: Dror Paley Reproduced from: https://www.slideshare.net/Abdulla1986/normal-limb-alignment
1.3 Femoro-tibial relationship during joint motion
The knee is a joint that is capable of great amplitude of motion. Like most synovial joints, it is capable of abduction, adduction, extension, flexion, and rotation. The knee joint is said to have six degrees of freedom: three degrees of rotation (flexion-extension; varus-valgus; internal-external rotation) and three degrees of translation (antero-posterior, medio-lateral, and proximo-distal) (Figure 3). Of these six degrees of freedom, the flexion-extension motions have been the most studied in the literature and are discussed below.
Figure 3. The six degrees of freedom of the knee Author unknown. Reproduced from: http://kneestability.weebly.com/anatomy.html Studies using magnetic resonance imaging (MRI) have attempted to characterize the medial and lateral articular surfaces of the knee in its functional active arc of 10o to 120o of flexion. This range of motion was chosen since it is believed to cover almost all activities of daily life involving flexion. It was determined that the femoral articular surfaces are circular in the sagittal plan, that their rotation occurs around their centre, and that there is no translation in the 10-1200 range of flexion [14]. Furthermore, in flexion, it was shown that the medial condyle does not rollback while the lateral condyle does and produces tibial internal rotation coupled with flexion. The rollback motion of the lateral condyle has been estimated at about 22 mm posteriorly [15]. In further studies, it was demonstrated that, while the medial condyle does not move antero-posteriorly ("roll-back") in flexion, there is transfer of the contact area that occurs: at 10o of flexion, the main contact area is the anterior tibio-femoral surface while at 30o, it is the posterior tibio-femoral surface. After 120o, both condyles rollback onto the posterior horn and there is a tibio-femoral joint subluxation phenomenon, involving mostly the lateral femoral condyle [16].
Since there is greater posterior rollback at the lateral femorotibial articulation than the medial, a medial pivot occurs during which the tibia experiences relative rotation to the femur as flexion increases [17]. This medial pivot occurs mostly at the beginning of flexion; towards the end of flexion, there is rollback occurring in the medial condyle and the difference in rollback between the lateral and the medial condyles is less. The medial pivot has been estimated to be about 20o to 30o in amplitude[15, 16, 18].
It is thought to occur in all healthy knees yet in one small study of five patients, the authors reported a subject with a lateral pivot [17].
1.4 Gait cycle
Walking is a repetitive series of limb motions, which aim to propel the body forward while maintaining stance stability. As the walking motions occur, one limb serves as support while the other limb advances itself in space. This occurs in a pattern, with the limbs reversing their role with each step. A gait cycle is defined as one limb going through the sequence of the support and advance actions. The beginning of the gait cycle has been defined as the moment floor contact occurs. In a normal gait cycle, floor contact begins with a heel strike [19]. A gait cycle is divided into the stance and swing periods. By definition, stance is when the foot is on the ground while swing is when the foot is in the air and the person walking is making progress in space. As previously mentioned, stance begins with a heel strike while swing begins with the foot being lifted off the ground, a motion known as "toe-off". In a normal walking pattern, 60% of the gait cycle is spent in stance (referred to in this thesis as the 0-60% phase of the gait cycle) and 40% in swing (referred to as the 60-100% phase of the gait cycle) [20]. It has been postulated, however, that the duration of these periods varies with speed with both periods being shorter as gait velocity increases [21].
The entire gait cycle can be divided into eight phases with the stance and swing periods containing five and three phases respectively [19]. The stance period is composed of the initial contact (0-2%), loading response (2-10%), mid stance (12-30%), terminal stance (30-50%), and pre-swing (50-60%) phases. The purpose of these phases is to support the walker's weight and to use one limb as support in preparation for advancing through space. The swing period is composed of the initial swing (60-73%), the mid swing (73-87%), and the terminal swing (87-100%) with the purpose of these phases being limb advancement [6]. Figure 4. The gait cycle Unknown author. Reproduced from: http://www.physio-pedia.com/Gait
1.4.1 Knee gait dynamics
In normal gait, the ankle-foot complex, the knee, the hip, the head, the trunk, the pelvis, and the arms all play a synergistic role in allowing for normal progression through the gait cycle. As this thesis focuses on knee kinematics, special attention will be paid to the knee and its motions though the different phases. Overall, during the gait cycle, the knee has four main roles: in stance, it allows for shock absorption and extensor stability and, in swing, it flexes to allow for foot clearance and extends for limb advancement [6].
1.4.2 Knee gait dynamics: sagittal motion
The sagittal motion plane is defined by knee flexion and extension. During heel strike, the knee is in extension, which can range from full extension (0°) to 10° flexion [6]. Greater knee flexion is seen at faster walking speeds [22]. Knee extension begins at mid stance and reaches full extension at the end of terminal stance. Afterwards, the knee begins flexing, reaching up to 40° of flexion in pre-swing, in order to reach a maximum of about 60° of flexion at mid swing before extending again.
1.4.3 Knee gait dynamics: transverse rotation
The motion of the tibia, femur, and pelvis during the gait cycle were ascertained through the placement of pins in the bones in the 1940s [23]. All bones were found to move in the same direction with internal rotation beginning at toe-off during swing phase and continuing throughout the entirety of the swing phase until loading response in stance. External rotation was observed in the mid stance, terminal stance, and pre-swing phases of stance. With respect to the knee, at initial contact, the tibia is in external rotation relative to the femur and, during loading response, the tibia undergoes internal rotation in order to reach its maximal internal rotation at the beginning of mid stance. External rotation of the tibia then begins at mid stance where the tibia rotates at a faster rate than the femur, which allows for the knee to lock in extension [23]. During passive extension and flexion, the knee couples internal and external rotations. This is known as the "screw-home motion" and precisely refers to internal tibial rotation coupled to femoral flexion and to external tibial rotation coupled to femoral extension [24].
1.4.4 Knee gait dynamics: frontal plane
Knee gait dynamics in the frontal plane are highly variable. The latest study to try and characterize knee gait dynamics in the frontal plane is from Mezghani et al. [25]. In their study, they classified movements in the frontal plane in four subgroups: 1) knee was neutral during the stance phase and in adduction during the swing phase, 2) knee was in abduction in the stance phase and adduction in the swing phase, 3) knee was neutral during the stance phase and in abduction during the swing phase, and 4) knee was in abduction during both the stance and swing phase[25]. Furthermore, a previous smaller study of five participants, and another study of 148 patients, both showed stance and swing patterns in the participants that resembled those found in the study by Mezghani et al. [26, 27]. The results of Mezghani et al. have already been previously demonstrated in the literature. The knee being in adduction in swing phase has been reported by many studies [26, 28-31] as has the knee being in abduction in swing phase [26, 27, 32].
1.4.5 Knee gait dynamics: translation
As translation movements are very small in amplitude and have not been validated in the context of the KneeKGTM apparatus, they will not be covered in this manuscript.1.5 Methods to measure knee kinematics
The data presented above on knee gait dynamics has been obtained from different methods aiming to measure knee motion. Early measurements were obtained using exoskeletal linkages and were limited to the sagittal plane [33, 34]. Extensive attempts to study bones' motion during gait with non-invasive techniques such as skin mounted markers or markers attached via a velcro strap to the knee have been made since the
first exoskeletal linkage studies and aimed to characterize motions in all planes [26, 35-38]. These attempts are limited by the errors arising from skin movement and, also, by the uncertainty of the exact position of the anatomical landmarks since, in non-invasive studies, the latter are not identified by precise and discrete points but rather by larger and approximate surface areas [39]. These anatomical uncertainties can have an impact of up to 4° of error in the measurement of the ab-adduction and internal-external rotation angles of the knee [39]. As such, the data obtained from non-invasive studies is usually limited to the sagittal plane where skin movement artefacts are less important. Invasive techniques, such as fracture fixation devices [35] and cortical pins [40]are therefore required to either minimize the skin movement and the landmark precision errors or, at the very least, as controls, to quantify the errors in non-invasive methods. These methods are not very practical in clinic as they are invasive, are associated with risks to the patients, and are very time consuming. Furthermore, it is extremely difficult to justify their use in research studies especially when conducted on healthy individuals given the risks they present to participants. Other methods used to evaluate knee kinematics are fluoroscopy and dynamic MRI. Fluoroscopy is believed to be a precise method for analyzing bone motion but is not frequently used in clinic as it is associated with an important dose of radiation and is also time consuming [36]. MRI has been used in studies focusing on the anatomy of the knee and those studies are detailed in section 1.1. Recently, studies have evaluated kinematics using a three-dimensional motion analysis system and infrared light cameras. In this method, light-reflective markers are placed on subjects in a point cluster techniques (PCT), in which multiple markers are placed on the subject in the aim of minimizing the effects of skin movement [41]. The infrared camera captures motion and each limb has multiple points assigned, thereby forming a "cluster"; mathematical calculations are conducted by the computer from these points with adjustments being made if the markers move from their initial
position. Studies have reported that PCT is accurate at 0.79° in the flexion-extension motion, 1.79° in the internal-external rotation motion, and 0.40° in the abduction-adduction motion [42]. PCT is believed to have good reliability [43]. A major disadvantage of PCT is that, often, skilled physiotherapists are required to place the markers in order for the markers to limit the effects of skin movement [44].
1.5.1 The KneeKG
TMapparatus
The KneeKGTM apparatus is commercially available from Emovi; its development began in 1992 with the intent of creating a non-invasive device, which can accurately quantify knee biomechanics in three dimensions while minimizing skin movement errors, especially over the medial and lateral femoral condyles [45]. The development of the apparatus began with quantifying skin motion around the knee, which led to the creation of a special harness that reduces skin motion artefacts [36, 46]. These early studies led to a final commercialized apparatus, which consists of an exoskeleton with a tibial and a femoral component (Figure 5). The tibial component is a rigid plate that is placed over the medial face of the tibia below the tuberosity while the femoral component is a harness with two orthoplasts that are positioned on the medial and lateral faces of the knee. The lateral orthoplast is positioned between the biceps femoris and the iliotibial band while the medial orthoplast is inserted between the sartorius tendon and the vastus medialis. A belt with a marker is also fitted over the iliac spines and additional markers are fixed over the medial malleolus [47]. While wearing the exoskeleton and the markers, the patient performs a series of movements, which allow the computer to calibrate the anatomic landmarks. Lastly, the patient walks on a treadmill at a comfortable walking speed and using the markers and an infrared camera, the computer is able to quantify knee abduction/adduction, axial rotation, and relative translation of the tibia and femur.
Figure 5. The KneeKGTM exoskeleton Author unknown. Reproduced from: http://www.frq.gouv.qc.ca/le-quebec-en-recherche/impact/des-genoux-sous-surveillance
The KneeKGTM has been validated in many respects. It is able to measure subtle kinematic changes with an accuracy of 2.3° in the transverse plane, 0.4° in the frontal plane, 2.4 mm for antero-posterior translation, and 1.1 mm for axial translation ([36, 45]. The repeatability of the KneeKGTM has been assessed in the inter- and intraobserver setting and has correlation coefficients above 0.8 for knee rotation in all three planes [48]. It was also demonstrated that the mean repeatability of measures range between 0.4° and 0.8° for knee rotation angles and between 0.8 to 2.2 mm for translation [49]. Furthermore, it has been shown that reliability for recording 3D knee kinematics is independent of the observer who performs the installation, suggesting that a study with the KneeKGTM can be conducted by multiple clinicians without impacting reliability [47].
1.5.2 Studies using the KneeKG
TMThe KneeKGTM has been used in a number of studies in the literature. In one study by Gaudreault et al, eighteen workers exposed to knee straining postures were compared to twenty workers not exposed to knee straining postures; the variables of interest were knee motion in the sagittal and the frontal plane. The results suggested that knee kinematics may differ between the two groups but it is important to note that the control
group only consisted of twenty workers [50]. In another study, the KneeKGTM was used to compare thirty patients with medial knee osteoarthritis (OA) with a control group of twelve individuals with varus malalignment. The results showed that kinematics between the knees with medial OA and the control group differed but it should be noted that yet again, the control group, is a very small sample [51]. Another study by Fuentes et al compared 29 patients with chronic ACL deficiency to 15 healthy volunteers [52]. The study showed that the ACL-deficient patients had larger knee flexion angles during the terminal stance phase of the gait cycle but yet again, the patients with pathology were only compared to fifteen healthy people.
2. Problem and objectives
2.1 Resuming the problem
Knee kinematics have been extensively studied by many different disciplines using various methods [14, 33, 35, 38]. Despite these numerous attempts to understand knee kinematics in humans, our current body knowledge on gait is insufficient to allow us to model normal locomotion in a clinically relevant manner. These gaps in our knowledge derive in part from not having adequate tools to model knee kinematics and also, from not having enough study subjects in the available studies. Furthermore, due to the variety of methods that have been used to study knee kinematics, it is hard to draw conclusions and make comparisons between studies. Overall, we have access to data that are not comprehensive as they are often only applicable in one plane, most often the sagittal, and fail to accurately reproduce the entirety of the cycle. In fact, in section 1.2 of this thesis, we are able to observe how we lack bodies of data that encompass sagittal motion, transverse rotation, and the frontal plane and, indeed, only focus on one plane of motion. Furthermore, it is frequently unclear how much of the data that is available comes from a validated methodology and it is also unclear if the data available is reproducible [53]. In addition, very few studies adequately demonstrate that the study subjects used as controls are indeed healthy and often fail to include clinical evidence such as FLWB x-rays to demonstrate absence of pathologies. As three-dimensional analysis of human gait progressively becomes a clinically useful tool in musculoskeletal diseases, an understanding of normal knee kinematics as well as a creation of a normal kinematic data bank is essential [54, 55]. Consequently, the need for data that models normal gait is greater than ever and this notion is reinforced by section 1.4, where we see that studies that attempt to compare pathological kneeconditions and their impact on gait have very few normal controls. Also, despite the fact that section 1.4 focuses on studies using the KneeKGTM, it is important to stress that data
obtained from the KneeKGTM is generalizable since the KneeKGTM is a validated tool.
2.2 Objectives
2.2.1 Primary objective
The primary objective of this study is to characterize knee kinematics in the sagittal motion, transverse rotation, and the frontal plane in healthy individuals with no lower limb pathology using the KneeKGTM apparatus.2.2.2 Secondary objectives
The first secondary objective is to compare differences in knee kinematics between normal men and women. The second secondary objective is to compare differences in knee kinematics the right and the left leg in the same subject. The third secondary objective is to correlate the hip-knee-ankle (HKA) angle with the gait cycle kinematics in the frontal plane.
2.3 Hypothesis
2.3.1 Hypothesis #1
We will be able to model normal knee kinematics in sagittal motion, transverse rotation, and frontal plane using the KneeKGTM apparatus. The data obtained should reflect what is available in the literature.
2.3.2 Hypothesis #2
There will be no significant differences in the gait cycle kinematics between normal men and women.
2.3.3 Hypothesis # 3
There will be no significant differences in the gait cycle kinematics between the right and the left leg of the same patient.
3. Methodology
This project was realized in collaboration with the orthopaedic surgery service of the Maisonneuve-Rosemont Hospital and the Laboratoire de recherche en imagerie et orthopédie (LIO) of the Ecole de Technologie Supérieure (ETS). The project was approved by the ethics committee of the Maisonneuve-Rosemont Hospital and the ETS. All subjects gave informed consent.3.1 Study population
Our aim was to recruit healthy subjects with no known knee or lower limb pathology. This study was primarily conducted at the Maisonneuve-Rosemont Hospital, in Montreal, Quebec. Additional data was obtained from our collaborators at the LIO in Montreal, Quebec.
3.2 Inclusion criteria
Subjects must have fulfilled the following criteria in order to be included in the study: • Be over eighteen years of age • Be under the age of 65
3.3 Exclusion criteria
• Any pre-existing lower limb pathology • Any lower limb surgery • Knee pain with daily activities of living • Use of a walking aid
• Pregnant women • For practical reasons, all obese subjects on whom it would be impossible to fix the exoskeleton on • Any language barrier or any other reason preventing a patient from giving informed consent
3.4 Data collection
Our study was prospective with all subjects meeting the inclusion criteria undergoing evaluation after having agreed to participate and having given their informed consent. Each subject was evaluated once. A complete evaluation consisted of filling out a demographic questionnaire, a knee injury and osteoarthritis outcome score (KOOS) questionnaire, a 12-item Short Form Health Survey (SF-12) questionnaire, undergoing gait analysis using KneeKGTM, and getting a full length weightbearing (FLWB) x-ray [56, 57]. In order to establish a robust data set, our initial goal was to recruit 100 healthy participants.
Table 1. List of evaluations Evaluation Tests administered Objective data collection • Demographic data questionnaire Self-reported questionnaire data • KOOS questionnaire • SF-12 Biomechanical • Gait analysis using KneeKGTM Physical examination • Goniometry (flexion and extension) Radiological • Full length weightbearing x-ray • Grading of osteoarthritis using the Kellgren-Lawrence scale Objective data collection Subjects participating in the study were asked to complete a demographic questionnaire in which they had to report their age, height, weight, and the minimum
time they are able to walk. In order to quantify the minimum time able to walk, subjects were asked if they can walk for a) more than 60 minutes, b) 30 to 60 minutes, c) 11 to 30 minutes, d) 2 to 10 minutes, e) less than 2 minutes or e) impossible to walk. Subjects were also questioned on whether they had been diagnosed with any diseases and on whether they take any medication on a daily basis. Self-reported questionnaire data collection In terms of clinical score evaluation, all participants in the study completed the KOOS and the SF-12 questionnaires. The KOOS questionnaire was created in 1995 and is a knee-specific questionnaire designed to assess subjects' views on their knees. The questionnaire is divided into five subsections: pain, other symptoms, function in daily living (ADL), function in sport and recreation (Sport/Rec), and knee-related quality of Life (QOL) [56]. It consists of 42 questions, is self-administered, and takes subjects approximately ten minutes to fill-out. The KOOS questionnaire has been validated in patients undergoing surgical reconstruction of the ACL [58], in patients undergoing knee arthroscopy [59], and in patients undergoing total knee replacement for OA [60]. The advantages of using the KOOS questionnaire are that each subsection can be scored independently on a scale of 0-100 where zero represents extreme knee problems and 100 indicates the absence of knee problems [56]. Calculation an aggregate score of the five subsections is not recommended, as it has not been validated. The SF-12 health survey was developed in the United States as an alternative to the 36-item Short Form Health Survey (SF-36) for use as a general health survey. The goal in creating the SF-12 was to maintain the validity of the SF-36 while reducing the amount of time it takes a patient to complete the questionnaire [57]. SF-12, as the name suggests, consists of 12 items from the SF-36 and it has been validated as an acceptable alternative to the SF-36 in the United States and in nine additional countries [57, 61]. It is
scored in terms of the physical and mental component summary scores (PCS-12 and MCS-12). The PCS and MCS scores have a range of 0 to 100 and with a mean score of 50 and a standard deviation of 10 [62, 63]. Biomechanical evaluation Knee kinematics were evaluated in all participants using the KneeKGTM apparatus from Emovi. All subjects were fitted with the KneeKGTM harness consisting of the exoskeleton with a tibial and femoral component and with the medial malleolus and iliac spine markers as detailed in section 1.5.1. Marker motion was recorded using an infrared motion capture system (Polaris Spectra camera, Northern Digital Inc.) and was recorded and analyzed with a computer equipped with the Knee3DTM software (Emovi). Following the attachment of the KneeKGTM harness, the subject walks on a treadmill for a few minutes in order to determine the walking speed at which the subject is comfortable and also, in order for the subject to get acclimated to walking on a treadmill with the apparatus. This walking habituation period has proven to be necessary in order to ensure the reproducibility of the kinematic data [64, 65]. Following this process, the subject performs a series of motions in order for the system to calibrate by identifying the center of the hip, knee, and ankle joints and by defining a coordinate system for these bones. This calibration is referred to as the functional and postural method [49]. Finally, the subject walks for 45 seconds and this 45-second period is what is used to generate the gait cycle kinematic data. In our study, subjects repeated this process (harness installation, habituation, calibration, 45 second walk) twice: once for each knee analyzed. The data obtained from this 45-second period of walking is analyzed by a series of mathematical calculations developed by the LIO using MatlabTM (MathWorks version 2013b). Using the method described by Kadaba et al, only the 15 most similar gait cycles are kept [31].
Physical examination In our study, prior to undergoing the KneeKGTM examination, the maximum active knee flexion and extension the subject is able to do was measured by a goniometer by the same investigator leading the KneeKGTM examination. The investigator obtained measurements of active flexion and extension for each knee included in the study. Radiological evaluation Each study participant had FLWB x-rays done. These x-rays allow for visualization of the entire lower limb and for reliable and accurate measurement of the mechanical axis of the lower extremity [66]. The following angles were measured on these x-rays: mLPFA, mLDFA, mMPTA, aLDFA, MPFA, LDTA, HKA. Measurements were conducted by two investigators on the Impax software used by our hospital.
The degree of osteoarthritis in each knee was evaluated on these x-rays using the Kellgren-Lawrence scale in which [67, 68]: 0: no radiographic evidence of osteoarthritis 1: doubftul evidence of osteoarthritis with doubtful joint space narrowing and osteophytes 2: definite osteophytes and possible joint space narrowing 3: multiple osteophytes, definite joint space narrowing, and possible bony deformity 4: severe disease with large osteophytes, marked joint space narrowing, and definite bony deformity One investigator, an orthopaedic surgery fellow, attributed a grading of 1-4 on the Kellgren-Lawrence scale to all x-rays.
3.5 Data analysis
For all continuous data collected, the average as well as the standard deviation (SD) was calculated. This includes: each of the five subsections of the KOOS questionnaire, the PCS-12 and MCS-12 sections of the SF-12, demographic data, goniometric data, radiological data, and the kinematic data detailed below. For the binary yes or no questions, the number of each response was recorded. As previously described, data, which encompasses all one hundred points of the gait cycle, was generated by the Knee3DTM software in the sagittal motion, transverse rotation, and frontal planes. Each data point has a numeric value representing the extent of a specific knee motion depending on the plane in which it was captured. In the sagittal plane, degrees of knee flexion are recorded, in the transverse rotation plane, positive values represent degrees of internal rotation and negative values degrees of external rotation, and in the frontal plane, positive values represent adduction angles and negative angles abduction angles. The numeric values associated with each data point not only allow us to accurately model knee kinematics but also allow us to make comparisons between males and females and between left and right knees for each point of the gait cycle. The comparisons between males and females were made using Student t-tests while the comparisons between the right and left knees were made using paired Student t-tests. A p-value of 0.05 was set as significant. The following angles were measured on the full-length weightbearing x-rays and a mean, an SD, and the variance was calculated for these measurements: • mLPFA • mLDFA • mMPTA • aLDFA
• MPFA • LDTA • HKA The patients were stratified according to the Kellgren-Lawrence osteoarthritis scale. A Pearson correlation analysis was calculated between the HKA angle measure on the FLWB x-rays and between the following points of the gait cycle: • 0-10 • 10-30 • 30-50 • 10-50 • 50-60 All calculations discussed in this section were done using SPSS v24.0 (IBM).
4. RESULTS
4.1 Study population
We recruited 83 subjects at Maisonneuve-Rosemont Hospital and our collaborators at the Laboratoire de recherche en imagerie et orthopédie provided us with data on an additional 12 subjects for a total of 95 subjects included in this study (Figure 7). Figure 6. Subjects recruited We tested the right and left knees of all 83 subjects recruited from Maisonneuve-Rosemont Hospital for a total of 166 knees tested. Out of these 166 knees, data on 8 knees was excluded because of errors that occurred during data collection (harness falling off, computer not capturing the measurements). This left us with 158 knees from the subjects from Maisonneuve-Rosemont Hospital. Our collaborators from LIO had only tested one knee in each subject recruited, therefore adding another 12 knees to our study (Figure 8).
Figure 7. Summary of knees included in study
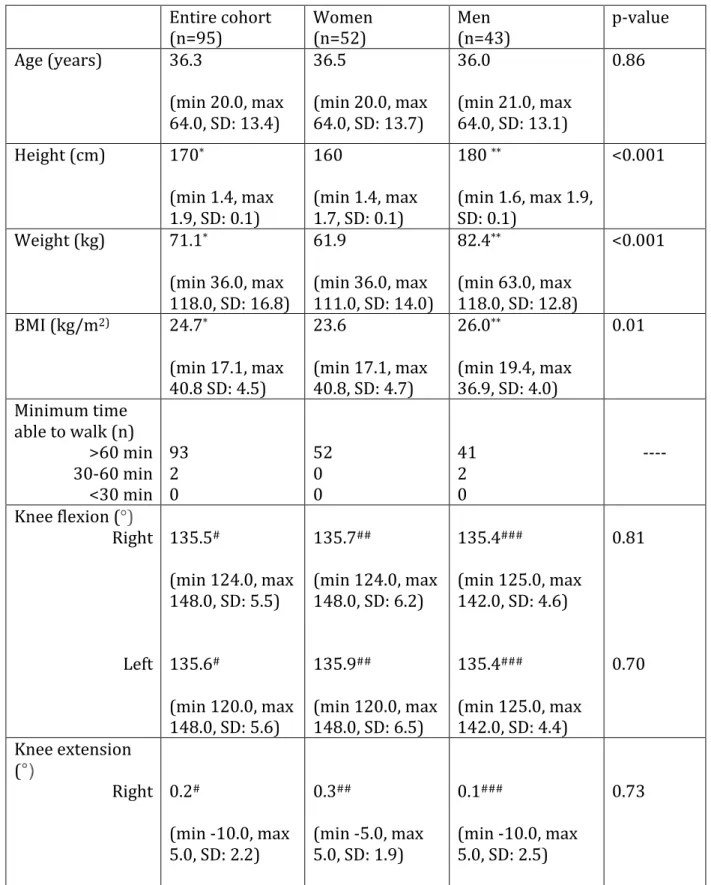
4.2 Demographic and goniometric data
In our cohort of 95 patients, we had 53 women and 42 men. The groups consisting either entirely of men or women were similar in terms of age, walking speed, and active knee flexion and extension for both the right and left knees (Table 2). Please note that for knee extension, negative values represent hyperextension and positive values, flexion. The two groups differed significantly in terms of height, weight, and BMI (Table 2).
Table 2. Demographic and goniometric data
Entire cohort
(n=95) Women (n=52) Men (n=43) p-value Age (years) 36.3 (min 20.0, max 64.0, SD: 13.4) 36.5 (min 20.0, max 64.0, SD: 13.7) 36.0 (min 21.0, max 64.0, SD: 13.1) 0.86 Height (cm) 170* (min 1.4, max 1.9, SD: 0.1) 160 (min 1.4, max 1.7, SD: 0.1) 180 ** (min 1.6, max 1.9, SD: 0.1) <0.001 Weight (kg) 71.1* (min 36.0, max 118.0, SD: 16.8) 61.9 (min 36.0, max 111.0, SD: 14.0) 82.4** (min 63.0, max 118.0, SD: 12.8) <0.001 BMI (kg/m2) 24.7* (min 17.1, max 40.8 SD: 4.5) 23.6 (min 17.1, max 40.8, SD: 4.7) 26.0** (min 19.4, max 36.9, SD: 4.0) 0.01 Minimum time able to walk (n) >60 min 30-60 min <30 min 93 2 0 52 0 0 41 2 0 ---- Knee flexion (°) Right Left 135.5# (min 124.0, max 148.0, SD: 5.5) 135.6# (min 120.0, max 148.0, SD: 5.6) 135.7## (min 124.0, max 148.0, SD: 6.2) 135.9## (min 120.0, max 148.0, SD: 6.5) 135.4### (min 125.0, max 142.0, SD: 4.6) 135.4### (min 125.0, max 142.0, SD: 4.4) 0.81 0.70 Knee extension (°) Right 0.2# (min -10.0, max 5.0, SD: 2.2) 0.3## (min -5.0, max 5.0, SD: 1.9) 0.1### (min -10.0, max 5.0, SD: 2.5) 0.73
* n=94, **n=42, #n=82, ##n=46, ###n=36
4.3 Self-reported questionnaire data
Our cohort had scores superior to 98% in all five subsections of the KOOS questionnaire and scores of 56.0 and 57.9 respectively in the PCS-12 and MCS-12 components of SF-12 (Table 3 and 4). The subjects provided to us by our collaborators at LIO were not evaluated with the KOOS and the SF-12 questionnaire. Furthermore, two of the 83 subjects recruited at Maisonneuve-Rosemont Hospital did not fill out the SF-12. All subjects recruited at Maisonneuve-Rosemont Hospital filled out the KOOS questionnaire. Table 3. KOOS questionnaire data Number of subjects 83 Pain 99.1 (min 80.6, max 100.0, SD: 3.1) Symptoms 97.6 (min 82.1, max 100.0, SD: 4.2) ADL 99.7 (min 91.2, max 100.0, SD: 1.2) Sports and recreation function 98.8 (min 80.0, max 100.0, SD: 3.6) Knee-related QoL 99.3 (min 87.5, max 100.0, SD: 2.8) Table 4. SF-12 questionnaire data Number of subjects 81 PCS-12 56.0 (min 49.1, max 58.4, SD: 1.7) MCS-12 57.9 (min 51.3, max 57.9, SD: 2.5)
Left 0.5# (min -5.0, max 5.0, SD: 1.9) 0.6## (min -4.0, max 5.0, SD: 1.7) 0.3### (min -5.0, max 5.0, SD: 2.0) 0.46 Use of medications No Yes 95 0 52 0 43 0 ----
4.4 Kinematic data
The walking speed at which subjects were comfortable on the treadmill was measured prior to the KneeKGTM evaluation. Table 5. Walking speed Entire cohort
(n=95) Women (n=52) Men (n=43) p-value Walking speed (km/h) 2.7 (min 0.8, max 3.9, SD: 0.5) 2.6 (min 0.8, max 3.7, SD: 0.5) 2.8 (min 1.6, max 3.9, SD: 0.4) 0.16
4.4.1 Sagittal motion
Data in the sagittal motion plane, obtained using the KneeKGTM, is shown in Figure 9 for the entire cohort, the right knees, the left knees, the knees of females, and the knees of males. Looking at the graph, the data for all five groups appears to be quite similar. When we compare results between men and women using the Student t-test, we find statistically significant differences between points 80-96 of the gait cycle which correspond to the mid swing and terminal swing phase of the gait cycle (Table 6). There are no statistically significant differences when comparing right and left knees using the paired Student t-test (Table 6).
Figure 8. Kinematic data in the sagittal motion plane
Table 6. Differences in the sagittal motion plane between genders and between right and left knees Gait cycle % p-value genders ( n=170) right vs left knees (n=150) 1 0.53 0.17 2 0.56 0.13 3 0.62 0.11 4 0.58 0.08 5 0.56 0.06 6 0.55 0.06 7 0.54 0.08 8 0.53 0.13 9 0.59 0.18 10 0.66 0.26 11 0.78 0.30 12 0.87 0.35 13 0.98 0.43 14 0.94 0.51 15 0.91 0.56 16 0.86 0.56 0 10 20 30 40 50 60 70 1 5 9 13 17 21 25 29 33 37 41 45 49 53 57 61 65 69 73 77 81 85 89 93 97 D egr ess of fl ex io n % of gait cycle
17 0.82 0.58 18 0.74 0.60 19 0.67 0.61 20 0.63 0.62 21 0.60 0.65 22 0.60 0.66 23 0.57 0.68 24 0.57 0.75 25 0.57 0.80 26 0.55 0.83 27 0.54 0.84 28 0.53 0.84 29 0.52 0.88 30 0.50 0.86 31 0.49 0.84 32 0.49 0.86 33 0.53 0.90 34 0.57 0.94 35 0.62 0.96 36 0.70 0.95 37 0.79 0.93 38 0.89 0.88 39 0.97 0.84 40 0.97 0.80 41 0.93 0.77 42 0.91 0.76 43 0.86 0.73 44 0.82 0.69 45 0.82 0.69 46 0.83 0.65 47 0.84 0.60 48 0.83 0.57 49 0.83 0.54 50 0.85 0.50 51 0.84 0.45 52 0.81 0.45 53 0.81 0.41 54 0.81 0.38 55 0.82 0.37 56 0.84 0.34 57 0.89 0.31 58 0.98 0.27 59 0.97 0.30
60 0.85 0.34 61 0.78 0.32 62 0.69 0.34 63 0.57 0.34 64 0.46 0.31 65 0.40 0.28 66 0.36 0.30 67 0.43 0.37 68 0.54 0.40 69 0.66 0.39 70 0.79 0.42 71 0.97 0.37 72 0.72 0.31 73 0.49 0.21 74 0.31 0.23 75 0.21 0.18 76 0.16 0.13 77 0.12 0.11 78 0.09 0.10 79 0.07 0.10 80 0.05 0.09 81 0.03 0.08 82 0.02 0.10 83 0.02 0.10 84 0.02 0.12 85 0.01 0.14 86 0.006 0.18 87 0.003 0.20 88 0.002 0.24 89 0.002 0.27 90 0.002 0.24 91 0.002 0.27 92 0.002 0.25 93 0.003 0.27 94 0.006 0.27 95 0.01 0.25 96 0.03 0.34 97 0.08 0.35 98 0.15 0.34 99 0.24 0.33 100 0.36 0.30
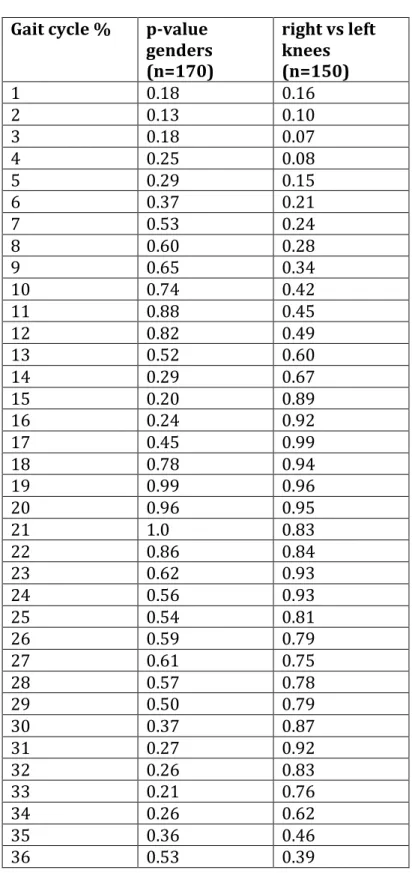
4.4.2 Transverse rotation
Data in the transverse rotation plane, obtained using the KneeKGTM, is shown in Figure 9 for the entire cohort, the right knees, the left knees, the knees of females, and the knees of males. When we compare results between men and women using the Student t-test, we find statistically significant differences between points 65-92 of the gait cycle which corresponds to the swing period of the gait cycle and encompasses parts of the initial and terminal swing phase and the entire mid swing phase (Table 7). There are no statistically significant differences when comparing right and left knees using the Student t-test (Table 7).Figure 9. Kinematic data in the transverse motion plane
-5 -4 -3 -2 -1 0 1 2 3 4 5 1 4 7 10 13 16 19 22 25 28 31 34 37 40 43 46 49 52 55 58 61 64 67 70 73 76 79 82 85 88 91 94 97 100 D egr ess of e xt er n al /i n te rn al r ot at io n % of gait cycle
Table 7. Differences in the transverse rotation plane between genders and between right and left knees
Gait cycle % p-value genders (n=170) right vs left knees (n=150) 1 0.18 0.16 2 0.13 0.10 3 0.18 0.07 4 0.25 0.08 5 0.29 0.15 6 0.37 0.21 7 0.53 0.24 8 0.60 0.28 9 0.65 0.34 10 0.74 0.42 11 0.88 0.45 12 0.82 0.49 13 0.52 0.60 14 0.29 0.67 15 0.20 0.89 16 0.24 0.92 17 0.45 0.99 18 0.78 0.94 19 0.99 0.96 20 0.96 0.95 21 1.0 0.83 22 0.86 0.84 23 0.62 0.93 24 0.56 0.93 25 0.54 0.81 26 0.59 0.79 27 0.61 0.75 28 0.57 0.78 29 0.50 0.79 30 0.37 0.87 31 0.27 0.92 32 0.26 0.83 33 0.21 0.76 34 0.26 0.62 35 0.36 0.46 36 0.53 0.39
37 0.73 0.34 38 0.88 0.34 39 0.95 0.36 40 0.98 0.38 41 0.99 0.44 42 0.99 0.49 43 0.99 0.50 44 0.98 0.50 45 0.96 0.49 46 0.93 0.46 47 0.88 0.43 48 0.79 0.44 49 0.72 0.42 50 0.66 0.39 51 0.55 0.39 52 0.51 0.41 53 0.49 0.39 54 0.49 0.35 55 0.55 0.36 56 0.66 0.35 57 0.79 0.37 58 0.97 0.38 59 0.83 0.41 60 0.64 0.46 61 0.48 0.55 62 0.35 0.68 63 0.22 0.74 64 0.11 0.83 65 0.05 0.88 66 0.02 0.92 67 0.005 0.88 68 0.001 0.90 69 0 0.78 70 0 0.69 71 0 0.64 72 0 0.55 73 0 0.55 74 0 0.66 75 0.001 0.86 76 0 0.94 77 0 0.97 78 0 0.97 79 0 0.90
80 0 0.92 81 0 0.96 82 0 1.00 83 0 0.88 84 0 0.82 85 0 0.66 86 0 0.52 87 0.001 0.37 88 0.003 0.26 89 0.005 0.19 90 0.01 0.15 91 0.02 0.15 92 0.04 0.16 93 0.06 0.19 94 0.11 0.25 95 0.15 0.29 96 0.25 0.34 97 0.38 0.43 98 0.58 0.48 99 0.87 0.49 100 0.68 0.35
4.4.3 Frontal plane
Data in the frontal plane, obtained using the KneeKGTM, is shown in Figure 11 for the entire cohort, the right knees, the left knees, the knees of females, and the knees of males. When we compare results between men and women using the Student t-test, we find statistically significant differences in the entirety of the gait cycle (Table 8). When we compare results between the right and left knees, using the paired Student t-test, we find statistically significant differences in points 60-90 of the gait cycle, which encompass most of the swing period (Table 8).
Figure 10. Kinematic data in the frontal plane Table 8. Differences in the frontal plane between genders and between right and left knees Gait cycle % p-value genders (n=170) p-value right vs left knees (n=150) 1 <0.001 0.80 2 <0.001 0.77 3 <0.001 0.71 4 <0.001 0.63 5 <0.001 0.54 6 <0.001 0.45 7 <0.001 0.39 8 <0.001 0.32 9 <0.001 0.25 10 <0.001 0.23 11 <0.001 0.21 -6 -4 -2 0 2 4 6 8 1 4 7 10 13 16 19 22 25 28 31 34 37 40 43 46 49 52 55 58 61 64 67 70 73 76 79 82 85 88 91 94 97 100 D egr ee s of a b d u ct io n ( -) /a d d u ct io n (+ ) % of gait cycle
13 <0.001 0.19 14 <0.001 0.18 15 <0.001 0.18 16 <0.001 0.17 17 <0.001 0.15 18 <0.001 0.15 19 0.001 0.15 20 0.001 0.15 21 0.001 0.18 22 0.001 0.18 23 0.001 0.20 24 0.001 0.20 25 0.001 0.21 26 0.002 0.22 27 0.002 0.22 28 0.002 0.23 29 0.002 0.25 30 0.002 0.26 31 0.002 0.28 32 0.002 0.27 33 0.002 0.27 34 0.002 0.28 35 0.002 0.27 36 0.001 0.25 37 0.001 0.24 38 0.001 0.23 39 0.001 0.23 40 0.001 0.23 41 0.001 0.21 42 0.001 0.20 43 0.001 0.20 44 0.001 0.20 45 0.001 0.20 46 <0.001 0.20 47 <0.001 0.21 48 <0.001 0.21 49 <0.001 0.21 50 <0.001 0.20 51 <0.001 0.18 52 <0.001 0.17 53 <0.001 0.15 54 <0.001 0.13 55 <0.001 0.12
56 <0.001 0.10 57 <0.001 0.08 58 <0.001 0.06 59 <0.001 0.05 60 <0.001 0.04 61 <0.001 0.04 62 <0.001 0.03 63 <0.001 0.02 64 <0.001 0.02 65 <0.001 0.01 66 <0.001 0.007 67 <0.001 0.005 68 <0.001 0.005 69 <0.001 0.006 70 <0.001 0.008 71 <0.001 0.009 72 <0.001 0.01 73 <0.001 0.01 74 <0.001 0.02 75 <0.001 0.01 76 <0.001 0.01 77 <0.001 0.01 78 <0.001 0.01 79 <0.001 0.01 80 <0.001 0.01 81 <0.001 0.01 82 <0.001 0.01 83 <0.001 0.01 84 <0.001 0.01 85 <0.001 0.01 86 <0.001 0.01 87 <0.001 0.02 88 <0.001 0.02 89 <0.001 0.03 90 <0.001 0.04 91 <0.001 0.05 92 <0.001 0.08 93 <0.001 0.11 94 <0.001 0.16 95 <0.001 0.22 96 <0.001 0.29 97 <0.001 0.39 98 <0.001 0.50
99 <0.001 0.61 100 <0.001 0.75
4.5 Radiological data
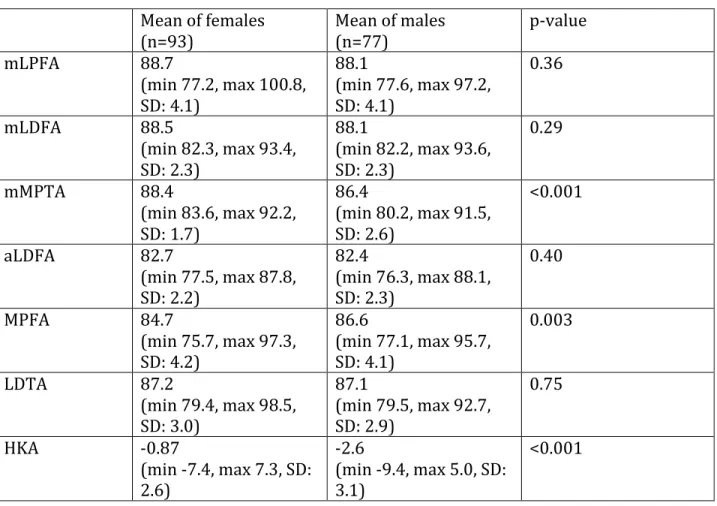
The results of the radiological measurements for the entire cohort are presented below (Table 9). Please note that for the HKA angle, negative values represent varus and positive values represent valgus. Table 9. Radiological data of entire cohort Mean of entire cohort (n= 170) min, max SD mLPFA 88.4 77.2, 100.8 4.1 mLDFA 88.3 82.2, 93.6 2.3 mMPTA 87.5 80.2, 92.2 2.4 aLDFA 82.5 76.3, 88.1 2.2 MPFA 85.5 75.7, 97.3 4.3 LDTA 87.2 79.4, 98.5 2.9 HKA -1.7 -9.4, 7.3 3.0 When comparing the data of the female and male patients using the Student t-test, there are statistically significant differences in the mMPTA, the MPFA, and the HKA angles (Table 10). Females have larger mMPTA angles than males, smaller MPFA angles than males, and are less in varus than males.
Table 10. Radiological data of female and male subjects Mean of females (n=93) Mean of males (n=77) p-value mLPFA 88.7 (min 77.2, max 100.8, SD: 4.1) 88.1 (min 77.6, max 97.2, SD: 4.1) 0.36 mLDFA 88.5 (min 82.3, max 93.4, SD: 2.3) 88.1 (min 82.2, max 93.6, SD: 2.3) 0.29 mMPTA 88.4 (min 83.6, max 92.2, SD: 1.7) 86.4 (min 80.2, max 91.5, SD: 2.6) <0.001 aLDFA 82.7 (min 77.5, max 87.8, SD: 2.2) 82.4 (min 76.3, max 88.1, SD: 2.3) 0.40 MPFA 84.7 (min 75.7, max 97.3, SD: 4.2) 86.6 (min 77.1, max 95.7, SD: 4.1) 0.003 LDTA 87.2 (min 79.4, max 98.5, SD: 3.0) 87.1 (min 79.5, max 92.7, SD: 2.9) 0.75 HKA -0.87 (min -7.4, max 7.3, SD: 2.6) -2.6 (min -9.4, max 5.0, SD: 3.1) <0.001 We divided the knees of female and male subjects into varus and valgus and conducted the same analyses. When comparing the data of the female and male knees in varus using the student t-test, there are statistically significant differences in the mMPTA, MPFA, and HKA angles. Females have larger mMPTA angles than males (the proximal tibia is less in varus), smaller MPFA angles than males, and globally present HKA less in varus than males (Table 11).
Table 11. Radiological data of female and male subjects with knees in varus Mean of female knees in varus (n= 60) Mean of male knees in varus (n= 61) p-value mLPFA 89.2 (min 78.6, max 100.8, SD 4.4) 87.8 (min 77.6, max 96.6, SD 4.3) 0.09 mLDFA 89.3 (min 85.3, max 93.4, SD 2.0) 88.7 (min 83.3, max 93.6, SD 2.1) 0.12 mMPTA 87.9 (min 83.6, max 92.2, SD 1.8) 86.1 (min 80.2, max 91.0, SD 2.5) <0.001 aLDFA 83.4 (min 78.9, max 87.8, SD 2.0) 82.9 (min 78.0, max 88.1, SD 2.1) 0.21 MPFA 84.2 (min 75.7, max 94.0, SD 4.2) 86.8 (min 77.1, max 96.6, SD 4.2) <0.001 LDTA 87.0 (min 79.4, max 98.5, SD 3.3) 87.0 (min 80.7, max 92.7, SD 2.9) 1.00 HKA -2.3 (min -7.4, max -0.02, SD 1.7) -3.7 (min -9.4, max -0.4, SD 2.4) <0.001 When comparing the data of the female and male knees in valgus, using the Student t-test, there are statistically significant higher values for the mMPTA (proximal tibia more in valgus) and aLDFA (distal femur more in valgus) in females than in males (Table 12).
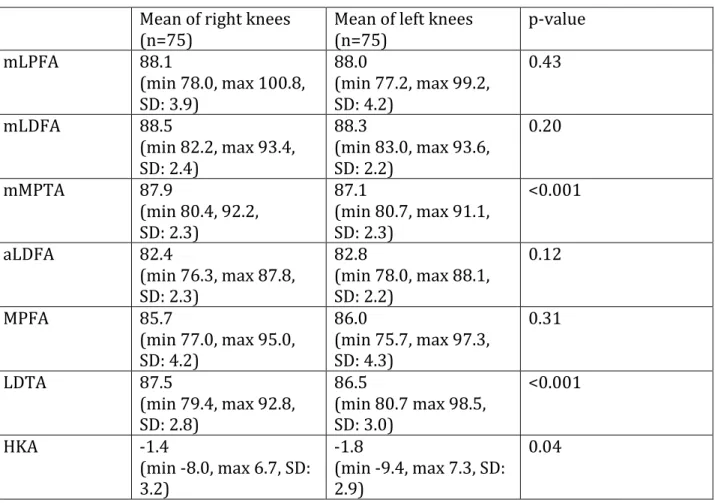
Table 12. Radiological data of female and male subjects with knees in valgus Mean of female knees in valgus (n= 34) Mean of males in valgus (n= 16) p-value mLPFA 87.6 (min 77.2, max 94.0, SD 3.8) 89.2 (min 83.4, max 97.2, SD 3.4) 0.16 mLDFA 87.3 (min 82.3, max 92.0, SD 2.2) 86.1 (min 82.2, max 89.0, SD 2.1) 0.08 mMPTA 89.1 (min 87.0, max 91.2, SD 1.2) 87.4 (min 81.1, max 91.5, SD 2.7) 0.002 aLDFA 81.6 (min 77.5, max 81.6, SD 2.0) 80.3 (min 76.3, max 83.3, SD 2.0) 0.03 MPFA 85.7 (min 80.1, max 97.3, SD 4.4) 85.8 (min 78.1, max 92.9, SD 3.7) 0.94 LDTA 87.5 (min 83.4, max 91.0, SD 2.3) 87.3 (min 79.5, max 91.0, SD 3.1) 0.82 HKA 1.7 (min 0.0, max 7.3, SD 1.7) 1.6 (min 0.10, max 5.0, SD 1.4) 0.85 In our cohort, we have 75 subjects in whom we have data on both the right and left knees and we compared radiological data between the right and left knees of these subjects using the paired Student t-test. There were statistically significant differences in the mMPTA, the LDTA, and the HKA between right and left knees (Table 13).