Critical analysis of the Worldnet freight flow matrices
S. Chevalier(a) and S. Limbourg(b)
(a) Centre interuniversitaire d’Etude de la Mobilité, ULB 50, avenue F.D. Roosevelt CP165/7, B-1050 Brussels, Belgium (b) HEC-ULg, 14 Rue Louvrex, B-4000 Liège, Belgium
Abstract:
The growing trade between Europe and the rest of the world and the enlargement of the European Union has led the European Commission’s Directorate-General for Energy and Transport to fund Worldnet – Worldwide Cargo Flows – within the Framework 6 research project under the Scientific Support to Policies initiative. The main outputs have been an extended freight origin-destination database for the year 2005, extended road and rail networks, and new maritime and air-cargo networks. Moreover, these outputs were developed according to TRANSTOOLS (Tools for TRansport forecasting ANd Scenario testing) specifications. Due to the magnitude of the project and to the consequences that its results could generate in transportation planning at European level, this study assesses the validity of the freight origin-destination matrix. Our analysis indicates multiple problem cases, inconsistencies and aberrations.
Keywords: origin-destination database, freight flows, Worldnet, TRANSTOOLS
1. Introduction
According to Campbell (2007), in the EU-25, freight transport reached 3,900 billion t.km in 2005, with roughly 31% growth between 1995 and 2005. This growth was mostly due to road (38%) and sea transport (35%), while the third fastest area of growth was air transport (31%). However, the increase in road transport has resulted in ever-worsening congestion and more environmental problems.
In this context, many EU Member States and the European Commission (2001, 2005) have the objectives of restoring the balance between modes of transport and of developing inter-modality. In order to address the traffic congestion problem, they have invested in transport modelling.
In terms of European transport projects, several models developed in the 1990s have emerged (VACLAV, NEAC, ASTRA, EXPEDITE, EUNET-SASI, SCENES, TRENDS, TREMOVE, and CGEurope) mostly with different methodologies. Reflections on recent developments in this field have led to the European transport network model TRANS-TOOLS, Tools for TRansport forecasting ANd Scenario testing.
The model uses the ETIS reference database of the ETIS-BASE project entitled “Core Database Development for the European Transport Policy Information System”. ETIS is based on existing national transport data sources and provides an interface which allows the production of comparable data across countries for different years. The database includes several origin-destination (O-D) matrices of commodity flows between European regions for 2000. But, because of the growing trade between Europe and the rest of the world and because of the enlargement of the European Union, these O-D matrices are no longer appropriate.
Therefore, another project funded by the European Commission was launched: the Worldnet Project. This is considered as the “European Network transport model refinement regarding freight and intermodal transport to and from the rest of the world” (Newton, 2009).
Specifically, Worldnet focused on updating for 2005 the freight flow matrix produced by the ETIS-BASE project. However there are differences between Worldnet and ETIS: firstly, Worldnet tends to better reflect the new EU borders created by recent EU expansion, secondly, a more detailed approach is given to the areas outside these borders and thirdly, the air transport mode is considered, with equal attention being given to road, rail, inland waterways and sea.
Due to the magnitude of the project and to consequences that its results could generate in transportation planning at European level, this study assesses the validity of the O-D matrix. Before assessing this validity, we begin with a presentation of the methodology applied to the construction of the Worldnet O-D matrix. We will then attempt to address the issue through a series of statistical manipulations performed on the matrix. The results of the matrix will be compared first of all to a variety of trade statistics, at European, national and local level. After that, we will analyse the statistics relating to the economic geography of Europe as provided by the Worldnet matrix.
2. Worldnet matrix
This section, mainly based on Newton (2009), is an overview of the methodology used for the production of the Worldnet database.
2.1. Matrix description
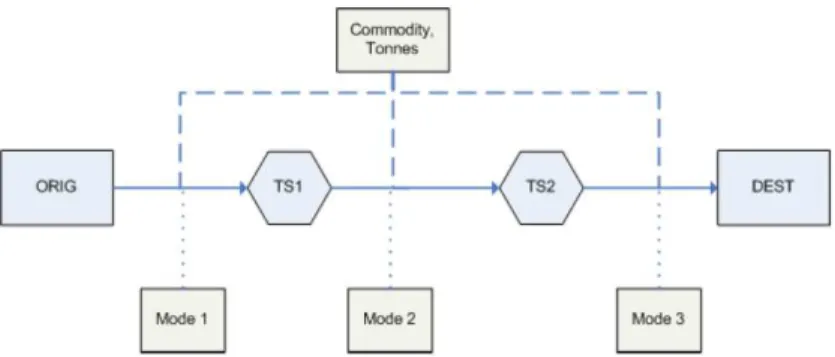
The Worldnet database contains transport chain structures, which can be visualized as shown in Figure 1.
Figure 1: Transport Chain Structure. Source: Newton (2009)
A freight flow is therefore characterized by its origin and destination, two trans-shipment points (TS1 and TS2), the mode at origin, the mode between trans-shipments and the mode at destination; it is expressed in tons and the commodity is coded according to the Standard Goods Nomenclature for Transport Statistics revised (NST-R). Therefore, the matrix does not consider more than two trans-shipments between an origin-destination.
2.2. Methodology
Worldnet employs a top down approach and uses multimodal assignment to estimate mode chains synthetically. The Worldnet matrix is developed using harmonized multi-country data, which are regularly published and which are likely to continue to be available in future years. The main inputs to the matrix are: Eurostat COMEXT trade data, UN COMTRADE trade data, Eurostat transport data – primarily road freight data – and Eurostat port data.
Worldnet uses global trade data and European transport data by means of a calibrated four step model, reduced in practice to three steps:
• Generation:
Transport volumes are calculated by combining databases. International flows are collected from the trade databases, and national flows are collected either from Eurostat or, in the case of non-EU countries, from national statistical offices.
• Distribution:
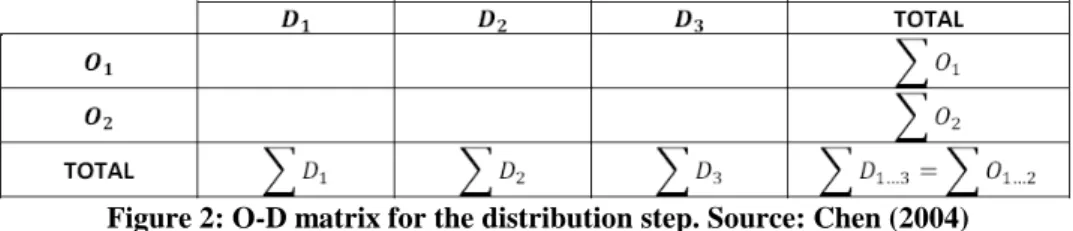
As international flows are only known at the country level, these are subdivided according to the methodologies established in the ETIS-BASE. So, although Worldnet had agreed not to use national statistics in their database, those statistics were collected from each national statistical office in order to obtain the margin of the matrix, as shown in Figure 2.
Figure 2: O-D matrix for the distribution step. Source: Chen (2004)
In Figure 2 above, O1 and O2 belong to a country A, while D1, D2 and D3 belong to a country B. Total flows between regions to and from a country are known. The last cell is the total flow from country A to country B. In order to estimate the empty cells, a set of gravity models, one for each kind of commodity, is used. So, the volume of traffic in a given O-D cell for a given kind of commodity is a function of the distance between the origin and destination, and the size of the regions, measured by the total volumes of the commodity produced and consumed.
• Mode split/assignment:
Following these two steps, a single O-D matrix is created containing origin and destination estimated in tons and for each kind of commodity. The third step transforms this matrix into a transport chain, as depicted in Figure 1, by assignment to a multimodal network.
The author highlightsthat the lack of data and their unreliability make it difficult to calibrate the matrix.
3. Data
According to Eurostat (2006), “Intra-EU trade statistics record the arrival and dispatch of
goods flowing between Member States according to the rules of the Intrastat system.”
Note that, COMEXT intra-European trade data also include transit. Sometimes quasi-transit is also referred to as “Rotterdam effect”. This is illustrated in the following example: goods are imported into Europe from a non-EU country, let us assume country X. The goods are released for free circulation in country A, and then dispatched to country B (Member State of consumption). For such an operation, the various recordings will be as follows:
For Community statistics, three operations are recorded:
• import of goods originating in X (with A as the declaring Member State, since the customs declaration is made there);
• dispatch (intra) from A to B;
• arrival (intra) in B.
No trade is recorded for the national statistics of country A, as the import from X and dispatch to B is regarded as transit trade.
3.1. Statistical discrepancies and asymmetries
As explained in Eurostat (2006), there are asymmetries between the values of mirror statistics regarding dispatches from country A to country B and arrivals to B from A. However, since the Intrastat system came into operation, bilateral comparisons have revealed major and persistent discrepancies in the intra-EU trade statistics of the various Member States. In addition to the phenomenon of late or non-response, the following points give some underlying reasons for this problem.
• The Intrastat system of thresholds makes it possible to exempt 80% of operators from statistical formalities.
• Because of statistical confidentiality, an operation cannot be published by one of the two partners but can be by the other.
• Although intra-Community trade statistics are based on a harmonized methodology, there are still a number of specific movements for which national practices diverge.
• Triangular trade can affect comparisons of both intra- and extra-EU trade.
Finally, also note the differences in data between Eurostat and other international institutions such as the International Monetary Fund, the Organisation for Economic Co-operation and Development and the United Nations. The main reasons for these differences are the specific requirements of each organization in terms of collecting and reviewing data and the conversion of units.
3.2. Available data
Besides the problems with data quality, there is also the problem of data availability for goods transportation. As highlighted in the MOTOS project, 2007, “After 1992 the availability and
quality of trade and transport data has decreased or the data are not available anymore”.
Moreover, limits of confidentiality and statistical laws also constrain the availability of data. More information on missing data can be found in Chen (2004).
4. Analysis
In this section, the results of the Worldnet matrix are compared with statistics from various sources. The first comparison is with flow of goods matrices from country to country built from the COMEXT 2005 data; the second comparison is with statistics produced by various national statistical offices; the third is with local data of Pyrenean traffic and trans-alpine traffic (CAFT survey - Cross Alpine Freight Traffic); the fourth and last comparison is with some statistics from the Antwerp Port Authority (APA).
4.1. Worldnet versus COMEXT
Let us consider the quantities of goods exchanged between EU countries. Two Country x Country matrices are established from the COMEXT database. These matrices contain the international exchange of goods based, on the one hand, on the flow of dispatches, and on the other hand, on the flow of arrivals. Eurostat (COMEXT) distinguishes between these two types of flow, because the resulting statistics show a certain asymmetry. The reasons for this are set out in section 3.1. In this case, the two COMEXT matrices (arrival and dispatch) are very asymmetric. For example, the volume of trade from Austria to Italy varies by 10% depending on whether we consider dispatch flows (11,636,095 tons; the “Reporter” country is Austria and the “Partner” country is Italy) or those of arrivals (10,469,521 tons; the “Reporter” country is Italy, and the “Partner” country is Austria), thus there is a major difference of more than 1 Mt. Furthermore, the mean of variations is 198%. This mean drops
to 22% when the observations for which the differences are extreme (flows involving the islands of Cyprus and Malta, between Denmark and Latvia, and some flows involving Estonia, Greece, Hungary, Ireland, Iceland and Latvia) are removed.
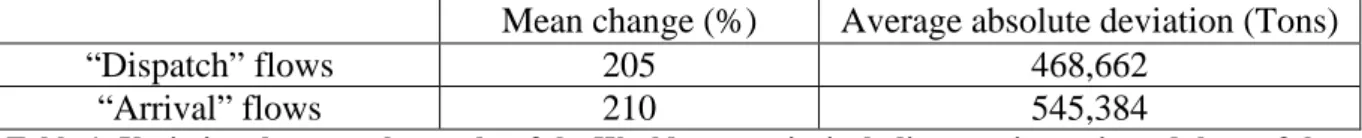
Because of this asymmetry, we assume that the results of the Worldnet matrix, reconstituted according to the Community concept (including quasi-transit), and those of at least one of the two COMEXT matrices are more or less consistent. In order to verify this, a comparison is made between Country x Country matrices. Table 1 indicates the mean change (in percent) of the flows of the Worldnet matrix and those of the two COMEXT matrices and also the average absolute deviation (in tons) of the flows between the two sources.
Mean change (%) Average absolute deviation (Tons)
“Dispatch” flows 205 468,662
“Arrival” flows 210 545,384
Table 1: Variations between the results of the Worldnet matrix, including quasi-transit, and those of the two COMEXT matrices (Dispatch and Arrival)
These figures indicate that, overall, the matrices are very different. Behind these averages, however, some flows have values that more or less correspond. Among the most divergent flows, there are those involving the smaller countries such as Malta, Cyprus, the Baltic countries, Slovenia, Slovakia and Iceland. Among the less divergent flows, for the “Dispatch” table, the number of flows with a difference of less than 1% is fifteen. This number reaches eighteen for the “Arrival” table. A closer look at the fifteen flows which have the smaller differences between Worldnet and COMEXT shows that only one flow, the Denmark-Finland flow, is found in the two comparisons, the one involving the “Dispatch” table, and the one involving the “Arrival” table.
Such comparisons can be made without taking quasi-transit into account during the assembly of the Country x Country matrix. As shown in Table 2, in this case, the mean change is greater for the “Dispatch” table, but smaller for the “Arrival” table. For average absolute deviation, the figures for both “Dispatch” and “Arrival” flows are lower than when quasi-transit is included (Table 1).
Mean change (%) Average absolute deviation (Tons)
“Dispatch” flows 355 234,720
“Arrival” flows 153 312,432
Table 2: Variations between the results of the Worldnet matrix, excluding quasi-transit, and those of the two COMEXT matrices (Dispatch and Arrival)
None of these comparisons allow us to determine which COMEXT matrix served as the basis for generating the Worldnet matrix. For example, Table 3 compares the flow between France and Spain and between Spain and Portugal for the two “Arrival” and “Dispatch” tables with and without quasi-transit.
COMEXT (Mt) Worldnet (Mt) Relative change (%) Dispatch D Arrival A Quasi-transit including IT Quasi-transit excluding ET
IT|D IT|M ET|D ET|M FR-ES 26.167 23.387 26.035 24.371 0.5 11.3 6.9 4.2 ES-PT 13.033 13.961 13.785 13.198 5.8 1.3 1.3 5.5 Table 3: Comparison of the flow of goods between France and Spain and between Portugal and Spain as
For the flows between France and Spain, Worldnet data seem to correspond to those of the COMEXT “Dispatch” table by considering quasi-transit, since the relative change is 0.5%; for flows between Spain and Portugal, this change is higher at 5.8%.
A third matrix was reconstructed from COMEXT-Dispatch. It uses the same international flows but does so by NST-R chapter. Statistics for Switzerland, Norway and Iceland could not be obtained due to the incompatibility of goods classifications. Again, significant differences between the two matrices are highlighted in Table 4. The table shows the mean change in percent and the average absolute deviation.
NST-R 0 1 2 3 4 5 6 7 8 9 WN|COMEXT (%) 82 17,160 3,939 10,944 24,972 1,475 260 1,271 710 1,915 WN|COMEXT (Tons) 29,662 28,200 20,633 221,640 16,705 21,572 44,964 13,572 29,690 163,385 Table 4: Comparison between Worldnet 2005 and COMEXT-Dispatch of mean changes of the flow of
goods according to NST-R chapter
It should be noted that the values of the first line should be higher as they do not take into account the O-D, which has a null flow in Worldnet but a positive flow in COMEXT.
Finally, dispatches of goods by country and by NST-R chapter are compared. The average deviation of the data set including all categories of goods and countries is higher when quasi-transit is considered (395%) than when it is not (317%). This also applies to the total quantities of goods where mean changes reach 38% and 64% respectively; if the observations regarding Malta are removed, mean changes fall to 15% and 42%. For some countries such as Belgium, Finland, France, Greece, Italy, Latvia, Lithuania, the Netherlands, Poland, Portugal and Slovenia, the deviations from the COMEXT values are less important when the countries are considered as the actual origin and/or final destination of goods.
So this could mean that Worldnet modellers have ignored the Community concept of quasi-transit. Indeed, these countries have sea ports. This means that there is re-dispatch (to member countries) related to external trade (extra-EU), which probably forms a significant proportion of their shipments.
Take, for example, the Netherlands. In the Worldnet matrix, the country’s total quantity of “dispatches” (Community concept) reaches 293.82 Mt, while the figure is only 267.68 Mt if only the country’s dispatches (national concept) are taken into account. In the first case, the total is higher by about 8% than the COMEXT value, whereas it is reduced by less than 2% in the second case. For Belgium, there is a similar case, with deviations of +21% and -4%. 4.2. Worldnet versus various national trade statistics
The previous section shows that it is difficult to see a clear link between the two matrices – COMEXT and Worldnet. Therefore, is the reality provided by Worldnet closer to that provided by the statistics from various national offices? Three sets of statistics for 2005 collected from the Statistiches Bundesamt Deutschland (DESTATIS), the National Bank of Belgium (BNB - Intrastat database) and The French Ministry of Ecology, Energy, Sustainable Development and Sea (the SitraM database) allowed us to compare results in a more disaggregated way (by region and/or class of goods).
4.2.1. German statistics
The German statistics summarize the flow of goods to and from the German Länder (NUTS -Nomenclature of territorial units for statistics -2) to and from the EU-25 countries (excluding the UK), Switzerland, Iceland and Norway. In this case, in order to obtain simple computations, data comparisons with Worldnet are made on the Länder arrivals table because the German Statistical Office (Federal Statistical Office of Germany, 2010) and Eurostat (2006) state that the partner countries of German arrivals are the countries of origin of goods, i.e. where the goods were produced.
Compared to COMEXT, Worldnet shows a difference of about 7% (323 against 348 Mt) for the arrival flows from the countries of the European Union to Germany, while for DESTATIS, the gap narrows to 5% (323 against 307 Mt). In the Worldnet matrix, flows from the Netherlands are 156% higher than the value in the German statistics. This strengthens our assumption that the modellers have not taken account of the Community concept of quasi-transit. This is also the case with the flow from Belgium.
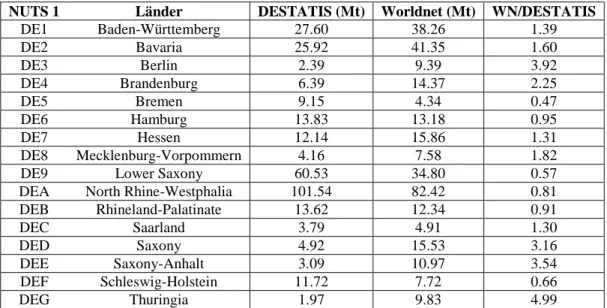
At the NUTS 1 level, Table 5 shows that regional arrivals by Worldnet are, on average, twice as high (in most cases) or two times lower than those of shown by the German statistics.
NUTS 1 Länder DESTATIS (Mt) Worldnet (Mt) WN/DESTATIS
DE1 Baden-Württemberg 27.60 38.26 1.39 DE2 Bavaria 25.92 41.35 1.60 DE3 Berlin 2.39 9.39 3.92 DE4 Brandenburg 6.39 14.37 2.25 DE5 Bremen 9.15 4.34 0.47 DE6 Hamburg 13.83 13.18 0.95 DE7 Hessen 12.14 15.86 1.31 DE8 Mecklenburg-Vorpommern 4.16 7.58 1.82
DE9 Lower Saxony 60.53 34.80 0.57
DEA North Rhine-Westphalia 101.54 82.42 0.81
DEB Rhineland-Palatinate 13.62 12.34 0.91 DEC Saarland 3.79 4.91 1.30 DED Saxony 4.92 15.53 3.16 DEE Saxony-Anhalt 3.09 10.97 3.54 DEF Schleswig-Holstein 11.72 7.72 0.66 DEG Thuringia 1.97 9.83 4.99
Table 5: Länder goods arrivals in 2005 according to DESTATIS and Worldnet
Regarding Country x Länder, the mean change in flows greater than 1 Mt (14.7% of the 416 flows) is about 60%; this figure is significantly higher when all the 416 flows are considered. This confirms that figures for international flows, spread over the German regions, do not agree with the statistics from the German Statistical Institute.
4.2.2. Belgian statistics
Belgian statistics collected from the National Bank of Belgium (BNB) estimate exports and imports of goods from the three Belgian regions (NUTS 1) with the countries of the EU-25 and ETFA (European Free Trade Association).
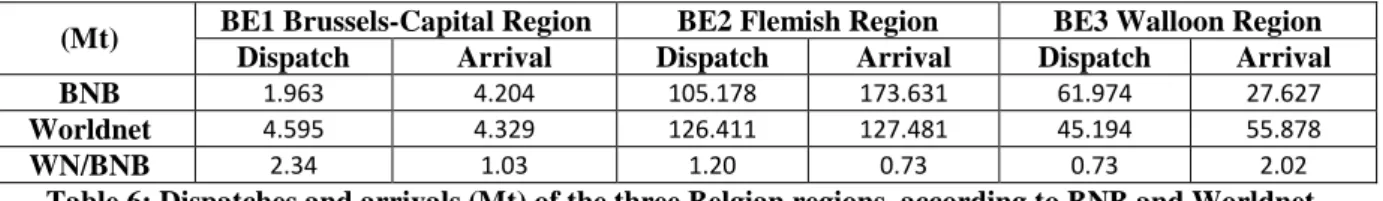
The international arrival and dispatch flows of regions as described by the BNB statistics are almost all lower than those from COMEXT (on average 6%). This reflects the fact that, in contrast to Eurostat, BNB uses the national concept for the compilation of national statistics, thus excluding any form of direct and indirect transit, including quasi-transit. Table 6 shows the levels of dispatches and arrivals (Mt) of the three regions, according to Worldnet and
BNB; the last row corresponds to the ratio between these values. Apart from similar findings for the Brussels-Capital Region arrivals, the differences remain large. Compared to the BNB statistics, Worldnet values for Brussels dispatches are twice as high, Flemish dispatches are 20% higher, and Walloon dispatches are 27% lower, Walloon arrivals are twice as high and, finally, Flemish region arrivals and Walloon region dispatches are under-estimated by more than one quarter.
BE1 Brussels-Capital Region BE2 Flemish Region BE3 Walloon Region (Mt)
Dispatch Arrival Dispatch Arrival Dispatch Arrival BNB 1.963 4.204 105.178 173.631 61.974 27.627
Worldnet 4.595 4.329 126.411 127.481 45.194 55.878
WN/BNB 2.34 1.03 1.20 0.73 0.73 2.02
Table 6: Dispatches and arrivals (Mt) of the three Belgian regions, according to BNB and Worldnet
At the national level, the Belgian total dispatches and arrivals are evaluated according to Worldnet to +4.2% and -8.7% of the BNB totals.
In addition, while the Brussels-Capital Region arrivals are almost the same in both sources, there are significant variations in terms of flow distribution. Indeed, the average change for all international flows reaches 12853% and drops to 155% if flows relating to the Baltic countries, Iceland and Malta are removed. Only two flows have similar values, namely those whose origins are the Netherlands and Germany.
Changes in flow values between the two databases for the Brussels region are on average 12853% for arrivals and 307% for dispatches, in Wallonia 594% and 64% and for the Flemish Region 30% and 20%. For flows from and to Flanders, there is an overstatement of flows to France at 18.5 Mt and of flows to Luxembourg by more than 2.6 Mt. By contrast, the flows between the Walloon region and these two neighbouring countries are under-estimated by almost 17 and 1.5 Mt. A similar conclusion can be drawn concerning arrivals in Flanders and Wallonia from several countries including the Netherlands, France and Norway. For example, Worldnet under-estimates by 41 Mt arrivals from the Netherlands to Flanders while it over-estimates by over 25 Mt arrivals from the Netherlands to Wallonia.
4.2.3. French statistics
The statistics collected in France, in the SitraM database of the “Service from the observation and statistics” (SESP), include national and international flows at different levels: French regions, countries, modes of transport and NST-R.
4.2.3.1. Total cargo transported within French territory by NST-R chapter
According to the SESP; transport of goods destined for abroad is recognized as national if there is loading or unloading at the border, such as at a port.
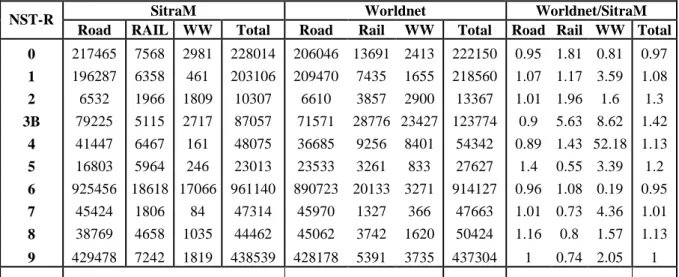
In order to estimate the national transport from Worldnet, transport of goods between regions of loading and unloading, which are not necessarily the origins and destinations of goods, were considered. These are, sensu stricto, national and interregional transport and also transport generated by international trade. Table 7 compares by NST-R chapter and by transport mode, the quantities of goods transported across French territory between the two databases – Worldnet and SitraM. Large differences appear for refined petroleum products (NST-R 3B), solid mineral fuels (NST-R 2), metal products (NST-R 5), chemicals (NST-R 8) and ore and metal waste (NST-R 4). As regards the modal split for French national transport, the road mode is more or less consistent, but rail and waterways (WW) transport is
over-estimated by 47% and 68%, respectively. For the road mode, the average change in all NST-R chapters reaches 10%, while it is 83% and 704% for rail and waterways transport, respectively.
SitraM Worldnet Worldnet/SitraM
NST-R
Road RAIL WW Total Road Rail WW Total Road Rail WW Total 0 217465 7568 2981 228014 206046 13691 2413 222150 0.95 1.81 0.81 0.97 1 196287 6358 461 203106 209470 7435 1655 218560 1.07 1.17 3.59 1.08 2 6532 1966 1809 10307 6610 3857 2900 13367 1.01 1.96 1.6 1.3 3B 79225 5115 2717 87057 71571 28776 23427 123774 0.9 5.63 8.62 1.42 4 41447 6467 161 48075 36685 9256 8401 54342 0.89 1.43 52.18 1.13 5 16803 5964 246 23013 23533 3261 833 27627 1.4 0.55 3.39 1.2 6 925456 18618 17066 961140 890723 20133 3271 914127 0.96 1.08 0.19 0.95 7 45424 1806 84 47314 45970 1327 366 47663 1.01 0.73 4.36 1.01 8 38769 4658 1035 44462 45062 3742 1620 50424 1.16 0.8 1.57 1.13 9 429478 7242 1819 438539 428178 5391 3735 437304 1 0.74 2.05 1 TOTAL 1996886 65762 28379 2091027 1963848 96869 48621 2109338 0.98 1.47 1.68 1.01
Table 7: Comparison of Worldnet and SitraM results for French national transport by NST-R and by mode
4.2.3.2. The five largest interregional rail and road flows by NST-R
As described in the previous section, the origin (destination) has areas of loading (unloading), i.e. places of production or consumption or trans-shipment of goods. With regard to interregional and intra-regional flows, the average change between Worldnet and SitraM is 92.7%. Table 8 shows, for each NUTS 2 in the French regions, the ratio between the intra-regional flows from Worldnet and from SitraM.
FR NUTS 2
10 21 22 23 24 25 26 30 41 42 43 51 52 53 61 62 63 71 72 81 82 WN/SITRAM (%) 94 105 108 120 108 119 100 110 94 102 101 97 104 89 102 89 82 94 88 99 91
Table 8: Worldnet/SitraM ratio for French intra-regional flows
For interregional flows, the average change reaches 97%; Ile de France (FR10) and Nord-Pas de Calais (FR30) have the lowest change. In addition, a systematic under-estimation of the flow from a region to its neighbouring region is observed. As an illustration, Table 9 compares the imports from the region of Ile de France (FR10).
FR NUTS 2
21 22 23 24 25 26 30 41 42 43 51 52 53 61 62 63 71 72 81 82 WN/SITRAM (%) 71 63 30 67 74 53 48 68 71 148 86 101 89 123 138 158 101 138 102 101
Table 9: Worldnet/SitraM ratio for arrivals from the French regions to the Ile de France region
Flows originating from neighbouring regions such as Champagne-Ardenne (FR21), Picardy (FR22), Upper Normandy (FR23), Centre (FR24) and Burgundy (FR26) are under-estimated, while those from more distant regions are over-estimated. Distance and/or the relative proximity of regions appear to be a key factor in the estimation of flows.
Regarding the five largest flows of goods between regions in France in 2005, a simple comparison shows that French interregional flows are very dissimilar from one source to another. This dissimilarity concerns the tonnage, origin (loading area) and destination
(discharge) of goods, both for road and rail. Table 10 shows this comparison for NST-R 1. Similar tables for other categories of goods can be found in Chevalier (2010).
SitraM Worldnet
Loading Unloading x1000 tons Loading Unloading x1000 tons
ROAD
Pays de la Loire Brittany 2410 Picardy Ile-de-France 710 Brittany Pays de la Loire 2193 Provence-Alpes-Cote
d'Azur
Rhône-Alpes 630 Pays de la Loire Poitou-Charentes 1494 Centre Ile-de-France 625 Poitou-Charentes Pays de la Loire 1199 Rhône-Alpes Provence-Alpes-Côte
d'Azur
615 Brittany Lower Normandy 1057 Champagne-Ardenne. Ile-de-France 531
RAIL
Lorraine Champagne-Arden. 258 Pays de la Loire Brittany 580 Nord-Pas de Calais Brittany 203 Brittany Pays de la Loire 541 Centre Upper Normandy 183 Ile-de-France Upper Normandy 480 Rhône-Alpes Nord-Pas de Calais 183 Upper Normandie Île-de-France 414 Rhône-Alpes
Provence-Alpes-Cote d'Azur
153 Nord-Pas de Calais Picardie 215 Table 10: Five largest interregional rail and road flows for NST-R 1
Analysis of these interregional flows also identified a trend whereby some pairs of flows between two regions are among the five largest flows according to Worldnet. These strong interdependences between some regions are not necessarily found in the SitraM database. 4.2.3.3. French arrivals from EU countries according to NST-R chapter
As in the case of Germany, for the French national statistics, the origins of goods are defined as the countries where the goods come from; transit is not taken into account. Logically, the quantities of goods imported into France from other European countries are lower than those provided by COMEXT: 88% according to Eurostat. However, the Worldnet figure is equivalent to 101%, almost the same value as around 2 Mt. Despite this general over-estimation by Worldnet of French arrivals compared to SitraM, some particular arrival flows have a lower value in Worldnet. This is also the case for refined petroleum products (NST-R 3B). As an example, while there is a 2% change between the Worldnet and SitraM statistics regarding the total arrival of crude oil (NST-R 3A), the changes become much more important when considering their distribution by country of origin (12% for Denmark, 72% for Italy, -17% for the Netherlands, 18% for the United Kingdom, while for Greece and Germany, the values are positive according to Worldnet, but null according to SitraM). Similarly, there is a 1% change in total arrivals from Poland, but the change is much more important once distributed by NST-R chapter (up to 49% for NST-R 0).
4.2.3.4. Regional exchanges with all EU-25 countries according to the transport mode at border
In this case, the French regions are the real origins and destinations of goods, while the transportation mode is recorded at the French border. The Worldnet estimated flows are generally too high, especially for exports. Moreover, the total for road transport records the smaller change: 9% for dispatches and +20% for arrivals; for rail transport -21% to +64%, while the other two modes display very large changes 61% and 100% for maritime; -60% and 165% for inland waterways. Regarding dispatches, road and maritime modes are over-estimated to the detriment of rail and inland waterways, which are under-over-estimated. Note also
that the arrival-dispatch balance is negative according to SitraM but positive according to Worldnet; the two sources of statistics therefore show conflicting information.
The SitraM statistics are full of interesting information that would be too long to describe and comment upon. Nevertheless, they prove once again that, in hindsight, the results of the Worldnet matrix need to be discussed and reconsidered.
4.3. Worldnet versus trans-Pyrenean and Alpine Statistics
The purpose of this section is to compare trans-Pyrenean and trans-Alpine flows estimated by Worldnet and by local surveys, carried out along the transport infrastructure through the two mountain ranges. These surveys include those conducted on a regular basis by the OTP (Observatoire des Trafics Pyrénéens), ALPINFO database (managed by the Swiss Federal Office of Transport and supplied by Austria, France and Switzerland) and the CAFT survey, “Cross Alpine Freight Traffic”, which includes road and rail transport. Note that the OTP has synthesized data for 2004 but not for 2005.
4.3.1. The Pyrenees
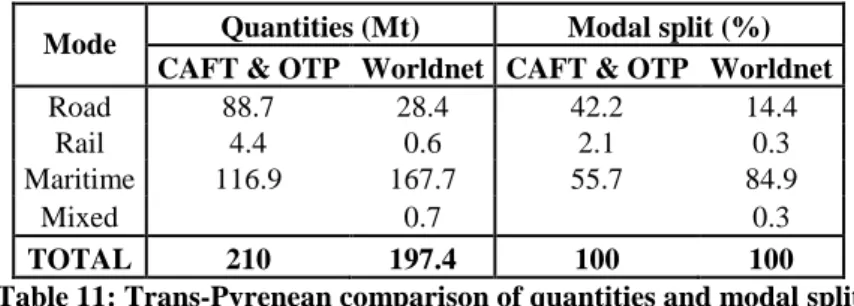
Data collection was performed on the six major trans-Pyrenean roads, on three railways and maritime flows with the Iberian Peninsula being estimated taking into account the rest of Europe (EU-27, Croatia, Turkey, Macedonia, Switzerland, Norway, Bosnia Herzegovina, Serbia and Montenegro, Albania, Belarus, Ukraine, Moldova and Russia). Table 11 provides the first comparisons with Worldnet, the mode labelled “mixed” applies to data for which the mode or the combination of modes is not defined.
Quantities (Mt) Modal split (%) Mode
CAFT & OTP Worldnet CAFT & OTP Worldnet
Road 88.7 28.4 42.2 14.4
Rail 4.4 0.6 2.1 0.3
Maritime 116.9 167.7 55.7 84.9
Mixed 0.7 0.3
TOTAL 210 197.4 100 100
Table 11: Trans-Pyrenean comparison of quantities and modal split
According to the CAFT survey (for road and rail) and OTP (for Maritime), 210 Mt of goods would have “crossed” the Pyrenees in 2004, but the figure was only 197 Mt for Worldnet in 2005. The modal split clearly shows the mismatch between the two data sources. Worldnet under-estimates the total traffic of goods across the Pyrenees, particularly for road and rail. Moreover, Table 12 compares the transport of various categories of goods North-South and South-North by road and rail. This comparison shows dissimilarities but also a similar trend between the two sources, since the flow of goods NST-R 0, NST-R 1, NST-R 5, NST-R 6, and NST-R 8 NST-R 9 is greater.
TOTAL (road + rail) (%) Road (%) Rail (%)
South →→→→ North North →→→→ South South →→→→ North North →→→→ South South →→→→ North North →→→→ South NST-R
CAFT WN CAFT WN CAFT WN CAFT WN CAFT WN CAFT WN
0 23 12 20 25 24 12 21 25 0 11 7 5 1 13 11 12 10 14 11 13 10 3 8 1 6 2 0 0 0 0 0 0 0 0 0 1 0 0 3 1 5 1 9 1 5 2 9 0 3 0 9 4 3 0 4 4 3 0 4 4 0 1 0 2 5 6 7 8 10 6 7 7 10 7 11 29 13 6 9 14 4 4 9 14 4 4 0 11 0 4 7 1 2 1 1 1 2 1 1 0 0 0 1 8 10 14 13 13 10 14 14 13 1 20 2 16 9 34 34 36 24 32 34 34 24 89 35 61 44
Table 12: Trans-Pyrenean comparison by NST-R chapter
4.3.2. The Alps
Assessing trans-Alpine traffic is a more difficult task than in the trans-Pyrenees case. The Alps are spread over five countries within which the intra-regional or intra-Alpine flows take up a significant proportion. The survey sites are located on the main network in Austria, Switzerland and the French-Italian border, and form a belt around Italy. To ensure valid comparisons, we focused on trade made with Italy as a country of origin, destination or trans-shipment.
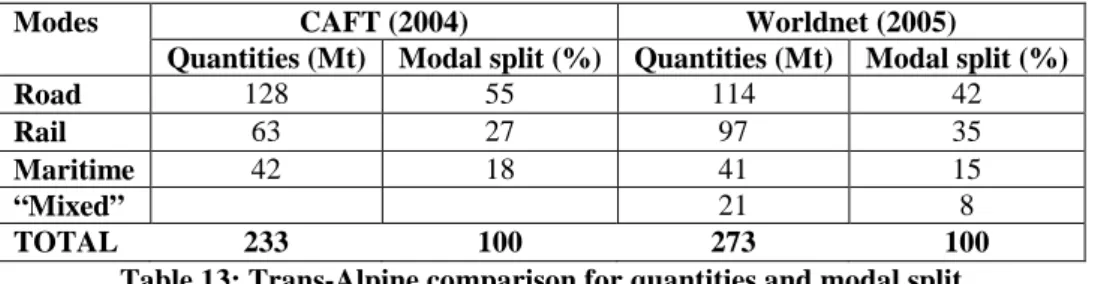
According to CAFT, 233 Mt of goods crossed the Alps in 2004. Worldnet gives the figure of 273 Mt for goods crossing the Alps in 2005 and takes into account only Alpine flows organized with or around Italy (Table 13). Certainly, Italy takes the vast majority of flows crossing the Alps (OTP, 2008), and although flows between Austria - Italy (mode change) - Spain or Croatia - Italy (mode change) - France were taken into account, this is not the case for many other exchanges such as those between Austria and Spain or between France and Croatia. Note that data from Worldnet does not record the flow twice through the Alps via Italy (due to trans-shipment), because either double counting would occur or only one of the two crossings would be recorded involving the under-estimation of one mode in favour of the other. If these flows are counted, the total reaches 284 Mt, and thus the difference between the Worldnet results and those of the CAFT survey is even more important. With regard to the modal split, rail transport again shows the greatest difference in assessment between the two sources of statistics.
CAFT (2004) Worldnet (2005) Modes
Quantities (Mt) Modal split (%) Quantities (Mt) Modal split (%)
Road 128 55 114 42
Rail 63 27 97 35
Maritime 42 18 41 15
“Mixed” 21 8
TOTAL 233 100 273 100
Table 13: Trans-Alpine comparison for quantities and modal split
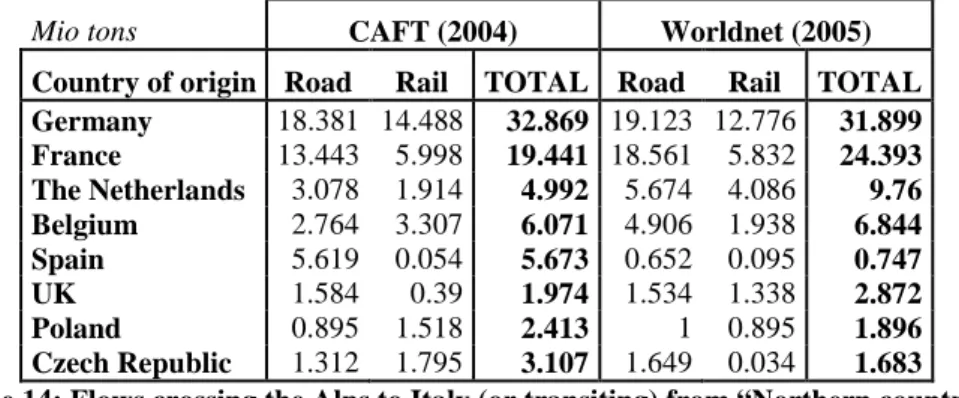
Table 14 shows data for flows crossing The Alps to Italy (or transiting) from “Northern countries”. With the exception of the United Kingdom, an over-estimation of the road flows from countries to the “north” of the Alps and across to Italy is observed. Indeed, while the flows obtained from Worldnet ignore a set of international trade flows directly crossing the
Alps, they are generally higher than in the CAFT statistics. In the case of Spain, the road flows are overvalued by about 5 Mt. This is similar to the observations made for trans-Pyrenean transport. Worldnet figures for trade with the Netherlands (total) and Belgium (for the road) are well above their value in the CAFT survey, showing once again an over-estimation by Worldnet of international flows from these countries.
Mio tons CAFT (2004) Worldnet (2005)
Country of origin Road Rail TOTAL Road Rail TOTAL Germany 18.381 14.488 32.869 19.123 12.776 31.899 France 13.443 5.998 19.441 18.561 5.832 24.393 The Netherlands 3.078 1.914 4.992 5.674 4.086 9.76 Belgium 2.764 3.307 6.071 4.906 1.938 6.844 Spain 5.619 0.054 5.673 0.652 0.095 0.747 UK 1.584 0.39 1.974 1.534 1.338 2.872 Poland 0.895 1.518 2.413 1 0.895 1.896 Czech Republic 1.312 1.795 3.107 1.649 0.034 1.683 Table 14: Flows crossing the Alps to Italy (or transiting) from “Northern countries”
Finally, Table 15 shows that while the statistics for Alpine transit are almost identical between Worldnet and CAFT for road and rail, differences appear when there are split by NST-R chapter.
Road Rail
CAFT (2004) Worldnet (2005) CAFT (2004) Worldnet (2005) NST-R Mt % Mt % Mt % Mt % 0 4.328 10 2.068 4 0.173 1 0.789 6 1 6.438 15 9.378 20 0.306 2 1.658 13 2 0.131 0 0.246 1 0.021 0 0.045 0 3 0.193 0 2.8 6 0.333 3 2.721 22 4 0.897 2 0.925 2 0.106 1 0.093 1 5 3.929 9 4.63 10 1.043 8 1.599 13 6 4.295 10 4.206 9 0.302 2 2.244 18 7 0.06 0 0.698 2 0.01 0 0.009 0 8 3.981 9 5.489 12 0.707 6 1.119 9 9 18.798 44 15.731 34 9.742 76 2.166 17 TOTAL 43.062 100 46.171 100 12.762 100 12.443 100
Table 15: Flows through the Alps from Italy by NST-R chapter
4.4. Worldnet versus statistics from the Antwerp Port Authority
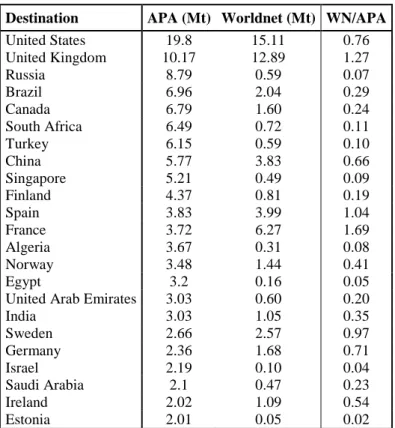
The comparison of Worldnet statistics with those from the APA is interesting because Worldnet uses certain port data for calibration. Table 16 shows that the Worldnet figures for the majority, 20 of the 23 largest flows from the port of Antwerp to various countries, are lower than those from the APA data; only the “Swedish” and “Spanish” flows are more or less identical between the two sources of data.
Destination APA (Mt) Worldnet (Mt) WN/APA United States 19.8 15.11 0.76 United Kingdom 10.17 12.89 1.27 Russia 8.79 0.59 0.07 Brazil 6.96 2.04 0.29 Canada 6.79 1.60 0.24 South Africa 6.49 0.72 0.11 Turkey 6.15 0.59 0.10 China 5.77 3.83 0.66 Singapore 5.21 0.49 0.09 Finland 4.37 0.81 0.19 Spain 3.83 3.99 1.04 France 3.72 6.27 1.69 Algeria 3.67 0.31 0.08 Norway 3.48 1.44 0.41 Egypt 3.2 0.16 0.05
United Arab Emirates 3.03 0.60 0.20
India 3.03 1.05 0.35 Sweden 2.66 2.57 0.97 Germany 2.36 1.68 0.71 Israel 2.19 0.10 0.04 Saudi Arabia 2.1 0.47 0.23 Ireland 2.02 1.09 0.54 Estonia 2.01 0.05 0.02
Table 16: The 23 largest flows from the port of Antwerp according to APA and Worldnet
Other comparisons are possible. According to APA statistics (actually from SNCB), the rail flows from the port of Antwerp are 51% at a national level, while for Worldnet, national transport is 43%. The statistics of the APA report are therefore reversed in the Worldnet database. Moreover, Figure 3 shows dissimilarities between the two databases regarding the distribution of rail flows from the port of Antwerp to the main European countries.
Figure 3: Distribution of rail flows from the port of Antwerp to the main European countries in 2005
5. Worldnet versus the economic geography of Europe
For the purposes of our analysis, it is assumed that a good produced in one region (country) is necessarily transported. Moreover, it is assumed that a good whose origin of transport is region R (countries P), was produced in the same region R (countries P). This hypothesis can be validated in the case of Worldnet 2005 because the modellers have tried to integrate the transport of goods into a worldwide transport chain including the country of origin of the
good, two intermediate zones of trans-shipment and its destination. In other words, we consider a perfect analogy between transport geography and economic geography.
Concerning the categories of crude petroleum (NST-R 3a) and solid mineral fuels (NST-R 2), the analysis mainly refers to statistical reports of ASPO International - The Association for the Study of Peak Oil and Gas (2007), BP (2009) and the European Association for Coal and Lignite EURACOAL (2005).
5.1. Crude petroleum
Table 17 shows the largest crude petroleum producing countries in the EU in 2005; the flows are compared with those of Worldnet. Inconsistencies can be observed such as in the case of Italy. Mt BP Production Worldnet Dispatches Norway 138.2 125.1 UK 84.7 62.2
The Netherlands Not available 22.7
Denmark 18.4 15.1
Italy 6.1 1
Germany Not available 2.1 Poland Not available 0.7
Table 17: Production (BP) and dispatches (Worldnet) of crude petroleum
Moreover, according to Worldnet, more than 2.5 Mt of crude petroleum are transported from Belgium. Again, the hypothesis that would explain this observation is that quasi-transit has over-estimated the dispatches of countries with seaports. This would also explain the figure of 22.7 Mt for the Netherlands.
Furthermore, an analysis of regional dispatches of crude petroleum shows that the seven Norwegian regions are with North Holland, Denmark and Merseyside, the ten largest regions of dispatches of crude petroleum in Europe. But according to Worldnet, the SørØstlandet region (NO03) is the largest, with 24.7 Mt in 2005, when in fact this region has no seaborne oilfield or pipeline directly connected to a petroleum storage station (Norwegian Petroleum Directorate, 2005). The same is true for the Oslo region (NO01) and for Hedmark and Oppland (NO02), which constitute, respectively, according to the Worldnet matrix, the fourth and seventh largest crude petroleum producing regions in Europe. The regional distribution of dispatches seems to be poorly made, perhaps according to the region of location of company headquarters, such as STATOIL in Oslo.
5.2. Coal and lignite
Coal and lignite are mainly represented by the NST-R 2 chapter. Table 18 shows their major production countries, according to BP and EURACOAL. Note that according to Worldnet, Hungary and France are not among these major coal and lignite producing countries. Major differences are observed, such as for Germany, where 203 Mt of coal and lignite were produced in 2005, but according to Worldnet, only 16 Mt were transported within this country or to another country. Moreover, the Worldnet figures for Spain and France would indicate that these countries dispatched more fuel than they would have actually produced.
Mt BP&EURACOAL Worldnet Germany 202.8 16.4 Poland 159.5 50.5 Greece 71.7 23.7 Czech Republic 62 15.8 U.K. 20.6 20.7 Spain 19.5 25.3 Hungary 9.6 2.7 France 0.6 6.5
Table 18: Production (BP) and dispatches (Worldnet) of coal and lignite
In the case of Germany, a large proportion of the extracted lignite is used to supply power plants located near the extraction site. However, the Worldnet matrix was constructed at NUTS level 3. Therefore, the part not taken into account in constructing the matrix might be intraregional transport at NUTS level 3.
Overall, Worldnet correctly identifies regions whose economy is characterized by the mining of coal and/or lignite. However, other regions acquire some significance in the Worldnet statistics although they are not a source of significant production on a European scale. Furthermore, Finland, Estonia and Latvia appear as major shippers of solid fuels, when in fact they have no coal or lignite mines. According to Worldnet, some regions of the Netherlands are also areas from which large quantities of minerals are transported. However, the EURACOAL (2005) report states that “The Netherlands is now the main transloading point for coal imports to Europe.”. The double counting of goods due to quasi-transit (for example, arrival in the port and from this port to the final destination) may be causing these differences. 5.3.Agricultural products and live animals
According to Worldnet, the proportion of agricultural product shipments to total shipments of Switzerland regions (from 76% to 91%) is eight to nine times the European average (9.55%). Switzerland is a rural country with an agricultural tradition, but can we imagine that nearly 87% of shipments of goods from the Zurich area involve agricultural products and/or live animals?
5.4. Ore and metal waste
According to Worldnet, West Macedonia in Greece was the largest region dispatching ore in Europe in 2005: over 25 Mt, three times more than the second ranking region (South Holland, 7.6 Mt). However, this region does not have any ore mining and is instead characterized by an agricultural economy (ESPON project 3.4.2, 2006). Note also that the ranking in second place of the South Holland region (Port of Rotterdam) supports the conclusion in Section 5.2 about double counting of goods due to quasi-transit.
5.5. Multi-modal terminals in Wallonia
There are several terminals in Wallonia (e.g. Athus Container Terminal, which handled 41,049 containers in 2005). However, according to the Worldnet matrix, there is no terminal or multimodal platform in this region because no Walloon province appears as a “Transhipment” zone 1 or 2. This raises the question of the validity of the representation of a multimodal transportation network, which plays an essential role in the modelling process and, ultimately, in determining the flow of goods via different transport networks.
6. Conclusion
Our analysis showed many dissimilarities, inconsistencies, aberrations and problematic cases were revealed. One explanation for the differences found between data sources could be that the use of the Eurostat trade statistics (COMEXT) is not justified for modelling the long haulage flow of goods as a worldwide transport chain. Indeed, intra-Community trade statistics take quasi-transit into account, making it difficult to know the exact country of origin and destination for a large proportion of the flow of goods. As a consequence, having used these statistics as well as extra-Community trade statistics, Worldnet modellers must have undertaken either a double counting of such goods (at the borders of EU member countries) or a misspecification of the transport chain. Also, in using a top-down approach, the modellers need to make a preliminary choice between the matrices of international trade import and export (because of their asymmetry).
Despite the desire of Worldnet modellers for greater transparency in the construction of the matrix through the use of harmonized data, using a variety of different statistics is essential because of the complexity of the freight transport sector. However, the question remains as to how it is possible to create coherent and plausible matrices using a combination of statistics from Eurostat, and from national, transnational, or private institutes such as railways, ports and others.
References:
ASPO (2007). “Reserves, Resources and Availability of Energy Resources 2006. Annual Report 2006”, http://www.tsl.uu.se/uhdsg/Data/BGR/BGR2005.pdf
BP (2009). “BP Statistical Review of World Energy June 2009”,
http://www.bp.com/liveassets/bp_internet/globalbp/globalbp_uk_english/reports_and_publications/statistical_en ergy_review_2008/STAGING/local_assets/2009_downloads/statistical_review_of_world_energy_full_report_20 09.pdf
Campbell, G. (2007). “Panorama of transport 1990-2005”,
http://epp.eurostat.ec.europa.eu/cache/ITY_OFFPUB/KS-DA-07-001/EN/KS-DA-07-001-EN.PDF.
Chen, M. (NEA Transport Research and Training) (2004). “ETIS (Core Database Development for the European Transport Policy Information System) – Discussion paper. Freight Demand data”,
http://www.iccr-international.org/etis/docs/ws5-chen2.pdf
Chevalier, S. (2010). “Modélisation du transport de marchandises en Europe : Vers une analyse critique de la matrice origine-destination Worldnet (TRANS-TOOLS 2005)”, Master’s thesis, Centre Interuniversitaire d’Etude de la Mobilité.
ESPON (Lead Partner: IGEAT – Institut de Gestion de l’Environnement et d’Aménagement du Territoire, Université Libre de Bruxelles), (2006)“ESPON project 3.4.2. Territorial impacts of EU economic policies and location of economic activities. Final Report”.
EURACOAL (2005). “Coal Industry across Europe 2005”,
http://www.eusustel.be/public/documents_publ/WP/WP3/coal_industry_2005_euracoal.pdf European Commission (2001). “White paper – European transport policy for 2010: time to decide”, http://ec.europa.eu/transport/strategies/doc/2001_white_paper/lb_com_2001_0370_en.pdf
European Commission (2005). “Mid-term review of the White Paper on the European transport policy”, http://ec.europa.eu/transport/strategies/2001_white_paper_en.htm
Eurostat (2006). “Statistics on the trading of goods – User guide”. Methods and Nomenclatures, http://epp.eurostat.ec.europa.eu/cache/ITY_OFFPUB/KS-BM-06-001/EN/KS-BM-06-001-EN.PDF
Federal Statistical Office of Germany - DESTATIS (2010). “Intra-Community Trade Statistics. Instructions on how to complete the intrastat forms. 2010”,
http://www.destatis.de/jetspeed/portal/cms/Sites/destatis/Internet/EN/Content/IntraExtrahandel/IntratradeInstruct ions.property=file.pdf
MOTOS Project - Transport modelling: towards an operational standards in Europe - TNO (2007). “Deliverable 3.1. MOTOS Handbook containing guidelines for constructing national and regional transport models.
Handbook of transport modelling (in Europe): learning from best practice”,
http://www.motosproject.eu/download_staticpages/handbook/handbook_motos.pdf.562p.
Newton, S. (NEA Transport Research and Training; OSC; MKMETRIC) (2009). “Deliverable 7. Freight Flows final. Worldnet Project (Worldnet. Worldwide Cargo Flows) Deliverable 7”. Funded by the European
Community under the Scientific Support to Policies (Framework 6),
http://www.worldnetproject.eu/documents/Public/D7%20Freight%20Flows%20final.pdf
Norwegian Petroleum Directorate, Production Figures from the Norwegian continental shelf, December 2005 and “Fact Maps”, http://www.npd.no
OTP, Observatoire franco-espagnol des trafics dans les Pyrénées (2008). “Transport de marchandises à travers les Alpes et les Pyrénées”, http://www3.midi-pyrenees.equipement.gouv.fr/rubrique.php3?id_rubrique=1269, 104 p.