HAL Id: hal-00952999
https://hal.archives-ouvertes.fr/hal-00952999
Preprint submitted on 28 Feb 2014
HAL is a multi-disciplinary open access
archive for the deposit and dissemination of sci-entific research documents, whether they are pub-lished or not. The documents may come from teaching and research institutions in France or abroad, or from public or private research centers.
L’archive ouverte pluridisciplinaire HAL, est destinée au dépôt et à la diffusion de documents scientifiques de niveau recherche, publiés ou non, émanant des établissements d’enseignement et de recherche français ou étrangers, des laboratoires publics ou privés.
Insights from a non-parametric analysis
Francois-Charles Wolff
To cite this version:
Francois-Charles Wolff. Lift ticket prices and quality in French ski resorts: Insights from a non-parametric analysis. 2014. �hal-00952999�
Lift ticket prices and quality in French ski resorts:
Insights from a non-parametric analysis
François-Charles Wolff
*February 2014
Abstract: Using a unique data set with 168 ski resorts located in France, this paper investigates the
relationship between lift ticket prices and supply-related characteristics of ski resorts. A non-parametric analysis combined with a principal component analysis is used to identify the set of efficient ski resorts, defined as those where the lift ticket price is the cheapest for a given level of quality. Results show that the average inefficiency per lift ticket price is less than 1.5 euros for resorts located in the Pyrenees and the Southern Alps. The average inefficiency is three times higher for ski resorts located in the Northern Alps, which is explained by the presence of large connected ski areas offering many more runs for a small surchage.
Keywords: data envelopment analysis, free disposal hull model, quality, lift ticket price, ski resorts
*
Corresponding author. LEMNA, Université de Nantes, BP 52231, Chemin de la Censive du Tertre, 44322 Nantes Cedex, France and INED, Paris, France.
1. Introduction
With Austria and the United States, France is considered as being one of the premier ski destinations in the world, with modern lift equipment and many linked skiable areas. According to the last report “Indicateurs et analyses 2012” published by the Domaines Skiables de France (2012), France became the most popular destination for skiers worldwide during the 2011-2012 season, with 55.3 million skier days1. Several figures highlight the vitality of the ski industry in France. Ski resorts are visited by around 10 percent of the French population each year and they attracted two million foreign tourists last year. More than 120,000 people work in ski resorts every year, ski activities contribute around two billion euros to French exports and 300 million euros are invested in ski areas each year (Domaines Skiables de France, 2012)2.
The mountainous space covers more than one-fifth of the French land mass, with six main mountain areas: the Northern Alps, the Southern Alps, the Pyrenees, the Massif Central, the Jura and the Vosges. France is the leading country in Europe in terms of ski area, with around 30% of the total world ski area, and also in terms of ski lifts (more than 3,300). The diversity of the ski resorts in France is undoubtedly one of the main attractions for tourists. There are more than 300 ski resorts in France which are either traditional mountain villages or purpose-built resorts. Over the last few years, some resorts have been linked together to create even bigger ski areas like Les Trois Vallees, l’Espace Killy or Paradiski, where skiers can explore a very high number of ski slopes.
French ski resorts differ widely both in their geographic and supply-side characteristics. The spectrum ranges from a few very large resorts built at high altitude, offering sufficient snow cover throughout the Winter and Spring seasons, to small resorts with low prices and limited ski runs, where skiing is possible only during the Winter season. In an intermediary position, there are medium-sized resorts which are more family-oriented, but also more sensitive to snow cover. These differences in quality are expected to explain differences in lift ticket prices across ski resorts. In this paper, I combine three different strands of literature to provide an innovative analysis of the price-quality relationship for a sample of French ski resorts.
Firstly, I rely on the literature of hedonic prices à la Rosen (1974) that has highlighted the role played by the characteristics of ski resorts on the selling price of ski passes in various countries (Falk, 2008, 2011, Pawlowski, 2011). Number of slopes, length of slopes and number of lifts are examples of ski resort characteristics that will explain lift ticket price formation. Secondly, I turn to a principal component analysis (PCA hereafter) to construct a synthetic index of quality for each ski resort. The PCA explains the variance structure of a matrix of data through linear combinations of variables,
1
This corresponds to an increase of 3% compared to the 2010-2011 season. Conversely, the United States and Austria have experienced drops in their daily visitor numbers (-15.8% and -2% respectively), essentially because of the economic crisis.
2
All these figures are drawn from the report published by the Domaines Skiables de France (2012). For additional details, see http://www.domaines-skiables.fr/downloads/uploads/Indicateurs-et-Analyses2012-Web.pdf.
which reduces the data to a small number of principal components (Jolliffe, 2002). Thirdly, following Ueda and Hoshiai (1997) and Adler and Golany (2001, 2002), a non-parametric analysis is combined with PCA to study the relative efficiency of ski resorts in the price-quality space.
I assume that the decision for a skier consists of selecting a combination of lift ticket price and resort quality. A ski resort is considered as efficient if a skier pays the lowest possible lift ticket price for a given quality, which includes attributes like number of runs or number of lifts. To identify the set of efficient ski resorts in the price-quality space, I assume that the production possibilities satisfy free disposability. This corresponds to the free disposal hull model (FDH hereafter) developed by Deprins et al. (1984). For each ski resort, the non-parametric approach allows me to determine the price paid in excess per lift ticket when skiing in an inefficient resort. An important assumption of my framework is that there are no externalities in selecting ski resorts. For instance, I leave aside the issue of housing accommodation or activities after ski in resorts. Also, I do not account for the possibility that skiers may not want to visit some large ski areas due to crowding or other factors.
Nowadays, there is high quality information on ski resorts available on the Internet, provided both by the resorts’ own websites and by comparative websites. The data that I use on lift ticket prices and resorts’ services was collected from the Ski Info website3. Specifically, I constructed a unique data set covering 168 ski resorts for the 2010-2011 season. I consider a large number of ski resort attributes which are expected to affect the willingness to pay of skiers. For each ski resort, a synthetic indicator of quality is computed using a principal component analysis. This index is then used in the non-parametric analysis to identify the set of efficient ski resorts. My results show that the average inefficiency per lift ticket price is less than 1.5 euros for resorts located in the Pyrenees and the Southern Alps. The average inefficiency is three times higher for ski resorts located in the Northern Alps. All these results are robust to the definition of the quality variable.
With respect to the existing literature, my contribution may be seen as complementary, but not redundant, to the econometric literature based on the hedonic price approach. Rather than focusing on the effect of quality on the average lift ticket price and providing implicit prices for each supply-related characteristics of ski resorts, I identify the set of resorts that should be preferred by skiers if they want to pay the lowest price for a given level of quality. A strength of my analysis is in calculating the money paid in excess for each inefficient resort. In doing so, I am able to highlight the best strategies for skiers to buy cheaper lift tickets for a given level of quality. In particular, I show that it is advantageous for skiers to ski on large connected ski areas as they offer many more runs for a small surcharge per lift ticket.
3
The remainder of this paper is organized as follows. In the next section, I briefly summarize the existing literature related to my research. I provide a description of the data set in Section 3, while Section 4 explains the construction a synthetic indicator of quality from the various resorts’ attributes. In Section 5, I present a non-parametric framework to study the price-quality relationship. I identify the set of efficient ski resorts in France in Section 6 and show that inefficiency per lift ticket is much higher in the Northern Alps than in the Southern Alps and the Pyrenees. Finally, Section 7 concludes.
2. Literature review
The seminal economic paper on the winter resort industry is by Barro and Romer (1987). In their model, ski area consumers purchase a ski lift ticket based on a future utility which depends on the number of lift rides. Both differences in quality and individual preferences will affect the willingness to pay for skiing. By focusing on the price-quality relationship, my contribution is more closely related to three distinct strands of literature.
The first one is hedonic pricing literature. Assuming that consumers value the utility of goods or services based upon their visible characteristics, “hedonic prices are defined as the implicit price of attributes and are revealed to economic agents from observed prices of differentiated products and the specific amounts of characteristics associated with them” (Rosen, 1974, p. 34). In the first-stage of the Rosen model, a regression analysis is used to obtain estimates of the contributory value of each characteristic to price4. As emphasized in Falk (2008), the strong competition faced by the various ski resorts is such that differences in lift ticket prices are expected to be strongly correlated with quality characteristics and demand factors.
A few papers have investigated this issue over the last years. Using data on 344 resorts located in the United States, Mulligan and Llinares (2003) find that the adoption of detachable chairlifts is positively correlated with ticket price. Pricing also depends on location, vertical drop or number of local competitors. Using a dataset of 84 Austrian ski resorts, Falk (2008) examines to what extent supply-related factors affect lift ticket prices5. Price dispersion is essentially explained by differences in lift capacities, ski runs and snow conditions, and attributes of ski resorts account for more than 60% of the variations in the ski lift ticket prices. In Italy, Alessandrini (2013) finds that willingness to pay is higher for the length of winter season than for transport or numbers of chairlifts and ski runs. Falk (2011) and Pawlowski (2011) propose comparative analyses using data from
4
In the second stage, implicit prices are regressed as a function of quantities chosen by individuals in order to obtain the marginal willingness-to-pay (identification of the inverse demand curve).
5
Using data from Austrian ski resorts and reported ski accidents, Borsky and Raschky (2009) find that the individual willingness to pay for a hypothetical increase in the possibility to undertake risk-taking activities ranges from 11% to 25% of the price of a lift ticket.
various European countries. Ski lift tickets tend to be significantly lower in France and Italy than in the other European countries net of the resorts’ characteristics.
The second strand is related to the measurement of economic efficiency in production. As shown in the seminal contribution of Farrell (1957), a decision making unit can be inefficient either by obtaining less than the maximum output available from a given level of inputs (technical inefficiency) or by not purchasing the optimal combination of inputs given prices and marginal factor productivities (allocative inefficiency). Researchers have considered two different paradigms for analyzing production efficiency: stochastic frontier analysis and DEA6. The DEA approach is a non-parametric method in which the efficient frontier is calculated from the sample observations in an empirical way. The efficient decision making units lie on the frontier envelopment surface obtained by solving a mathematical programming problem (Charnes et al., 1978) and an inefficiency score is calculated for each unit not on the frontier.
More recently, a few papers have investigated efficiency on markets using a non-parametric double-frontier methodology. This method was originally proposed by Lins et al. (2005) to the case of real estate value assessment. The double perspective DEA framework combines the maximization of outputs and the minimization of inputs in a setting where inputs under one perspective are the outputs under the other perspective (and vice-versa). This setting is especially well-suited to study efficiency of buyers and sellers in the price-quality space as shown in Mouchard and Vandresse (2007, 2010) for the freight transport and Ben Lakhdar et al. (2013) for illicit drug transactions7.
Efficient sellers are defined as those who obtain the highest price for a given quality and efficient buyers as those who pay the lowest price for a given quality. Application of non-parametric frontier techniques determines two encapsulating surfaces that enfold all the transactions in the price-quality space. Sellers obtaining the highest price for a given quality are located on the upper frontier, whereas consumers paying the lowest price for a given quality are located on the lower frontier. Assuming that the decision for a skier is to choose a combination of lift ticket price and quality, this setting is appropriate to study efficiency of ski resorts.
The last strand of literature deals with the inclusion of PCA in data envelopment analysis. The first contribution which has proposed using PCA as a means of weighting inputs and outputs in efficiency analysis is due to Ueda and Hoshiai (1997). When the number of inputs and outputs is large, then there are more efficient decision making units. Further, the efficiency evaluation is affected when there exists some correlation between the different inputs or outputs (Nunamaker, 1985). Adler and Galany (2001, 2002) propose specific DEA-PCA formulations to account for the fact
6
For an overview of these methods, see the surveys of Greene (2008) and Murillo-Zamorano (2004) among others.
7
Ben Lakhdar et al. (2013) also account for the negative relationship between quantity purchased and price through possible bulk-buy discounts. They identify the set of efficient transactions in the price-quality-quantity space.
that the selected principal components will not explain all the variance in the original input or output matrices. If all PCs are used in the DEA analysis, this will lead to the exact results of the original DEA. From an empirical perspective, results reported in Adler and Golany (2001) show that very similar results are obtained when considering all PCs or only a subset of them (the first two or first three PCs in their setting). Using Monte Carlo simulations, Adler and Yazhemsky (2010) have recently confirmed that DEA combined with PCA was really a powerful tool to correctly classify decision making units as efficient8.
In what follows, I present the data set on French ski resorts that I consider to estimate the lower non-parametric frontier in the price-quality space.
3. Data on French ski resorts
Over the last few years, many comparative websites related to skiing have flourished. They offer detailed characteristics on ski resorts located all around the world. The data used in this paper was collected from the Ski Info website during the 2010-2011 season9. This website provides a full description of ski attributes for each ski resort. It includes data on altitude (village, base station, top station), number of slopes and length of slopes with four different categories (beginner, intermediate, advanced, expert), and composition of lifts (gondola, cable cars, chair-lifts, funicular, etc). The website also indicates for each resort lift ticket prices for various durations: afternoon pass ticket, day pass ticket, six-day pass ticket or season ticket.
When constructing my sample, I paid careful attention to the definition of the ski area of the resorts. Indeed, nowadays there are many resorts in France which are linked to their neighbors, with a special ticket price for the extended domain. With respect to the quality-price setting, these connected areas correspond to one specific resort. In some cases, resorts combine their domains to form a larger ski area, but offer skiers the option of either buying a ticket for their own domain or buying a day pass ticket for the extended area. To give an example, the Espace Killy is one of the most famous world-class ski resorts, with 300 kilometers of runs, which covers the resorts of Tignes and Val d’Isere. Thus, skiers may buy a lift ticket to ski either in Tignes, in Val d’Isere or in the Espace Killy.
The final sample comprises 168 ski resorts and connected areas, with the following variables. Price in euros is for a one-day pass lift ticket. Several indicators shed light on the quality of the ski resort. First, ski lift conditions are measured through the number of ski-tows, ski-lifts, cable car, gondola or funicular. Skiers are expected to face reduced waiting time with more lifts. Secondly, ski
8
Nataraja and Johnson (2011) further investigate variable selection techniques in DEA. They show that the combined use of DEA and PCA performs well with highly correlated inputs.
9
opportunities are picked up by variables like total distance of ski runs in kilometers, number of slopes and type of slopes depending on the ski level (beginner, intermediate, advanced, expert). Thirdly, the maximum skiing altitude and the vertical drop of the resort are additional pieces of information correlated to both ski conditions and snow cover.
Descriptive statistics of the sample are reported in Table 1. There are large differences in lift ticket prices between the various French ski resorts. The mean price amounts to 25.3 euros. Ticket prices range between 5 and 50 euros per day, with a standard deviation of 9.4 euros. Not surprisingly, the average price is affected by the characteristics of the resorts. When comparing the different regions, the average price is significantly lower in the Southern Alps (22.9 euros), the Pyrenees (25.5 euros) and other regions (18.7 euros) than in the Northern Alps (27.4 euros). At the same time, the average resort in these regions offers fewer slopes and more constrained ski lift capacities. For instance, skiers have access to 106.7 kilometers of slopes on average in a resort located in the Northern Alp compared to 65.6 kilometers in the Southern Alps and 39.4 kilometers in the Pyrenees10.
Insert Table 1
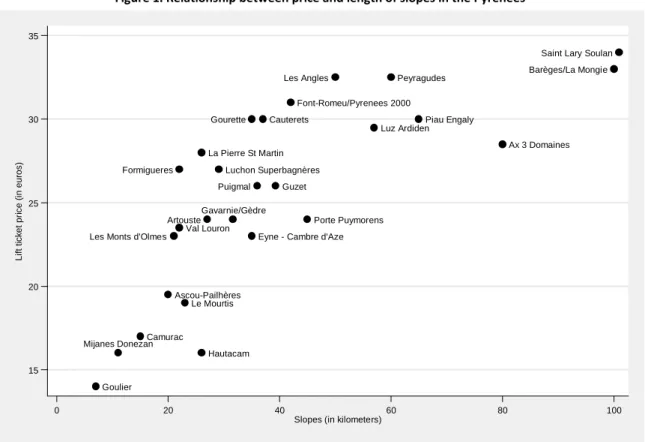
These descriptive results give credence to the idea that there is a strong, positive correlation between lift ticket price and quality of the various ski resorts. A similar conclusion has been emphasized by Falk (2008, 2011) and Pawlowski (2011) using different data sets from several countries. In France, simple calculations show that the coefficient of correlation is equal to 0.733 between price and length of slopes, 0.752 between price and number of ski runs, 0.771 between price and resort’s vertical drop, and 0.721 between price and number of chair lifts (all these correlations being significant at the 1 percent level). In Figure 1, I plot a scatter diagram representing lift ticket prices as a function of total length of slopes for ski resorts located in the Pyrenees. Clearly, the price of a one-day pass ticket strongly increases with the total slope length11.
Insert Figure 1
4. A synthetic index of ski quality
Although it is possible to account for several attributes related to quality in non-parametric frontier models, a difficulty with such an approach is that a very large number of ski resorts are likely to be efficient when there are too many inputs under consideration (especially with a limited number of decision making units). To overcome this potential shortcoming, I decided to construct a synthetic
10
The average number of runs is also much higher in the Northern Alps (57.1 per ski resort) compared to the Southern Alps (34.1) and the Pyrenees (27.9). Conversely, altitude of the base station (a proxy of snow conditions) is lower in the Northern Alps than in the Southern Alps or the Pyrenees.
11
indicator of quality combining characteristics like number of slopes, number of lifts or proxies for snow conditions.
However, one difficulty is knowing how to aggregate the various attributes into one variable measuring the overall quality of the ski resort. To choose the appropriate weights, I decided to rely on the statistical procedure of principal components (PCs hereafter). The use of this procedure in data envelopment analysis was originally suggested by Ueda and Hoshiai (1997) and Adler and Golany (2001, 2002), as a tool parsimoniously summarizing a large set of inputs (or outputs). Indeed, a PCA is a multivariate statistical technique which is used to reduce the number of variables into a small number of dimensions capturing the common information most successfully (see Filmer and Pritchett, 2001, Jolliffe, 2002). When there is a high degree of correlation among the selected variables, very few PCs are required to pick up common information.
To construct a linear quality index from the characteristics of the ski resorts using a PCA, I proceed in the following way. Suppose that there is a set of variables ( = 1, … , ) measuring several attributes of ski resort , with = 1, … , . Denoting by and respectively the mean and standard deviation of the various , each normalized resort’s attribute = ( − )/ is expressed as a linear combination of a set of components for each resort :
= + ⋯ +
…
= + ⋯ + (1)
In (1), the various coefficients are supposed to be invariant across ski resorts. By definition, only the left-hand side of each equation in (1) is observed. PCA can be thought of as revealing the structure of a multivariate dataset in a way which best explains the variance in the data. It is defined as an orthogonal linear transformation such that the first PC accounts for as much of the variability in the data as possible. Then, each succeeding component has the highest variance possible under the constraint that it is uncorrelated with the preceding component(s). By inverting the system defined by (1), it follows that:
= + ⋯ +
…
= + ⋯ + (2)
with a set of scoring factors. In what follows, I will consider the first PC A = ∑ δ q to reduce the dimensionality of the data. The central assumption behind this quality index is that quality explains the maximum variance in the attributes of the ski resorts. Nevertheless, to assess the robustness of my findings, I will also consider inclusion of additional PCs A! = ∑ δ! q .
I calculate the scoring factors from the PCs of the 13 quality indicators described in Table 112. The first PC explains 67.8% of the variation in the 13 selected attributes of the ski resorts, the corresponding eigenvalue being equal to 8.82. The contributions of the second and third PCs are 12.9% and 5.3% respectively, with eigenvalues equal to 1.68 and 0.69. These results suggest that the first PC contains most of the relevant information about the ski resorts’ quality. Since the first two PCs explain 80.8% of the variance of the data matrix and the first three PCSs explain 86.1% of the variance, I will also implement the non-parametric model with either one, two or three PCs. By construction, the mean value of each component is set to zero. For the quality index corresponding to the first PC, values range from -3 to 16.75 with a standard deviation equal to 2.97.
In Table 2, I describe the resorts (including connected areas) with the highest quality scores per region. To assess the reliability of the synthetic quality index, I also report on the relative ranking respectively for total number of lifts, vertical drop, length of slopes and number of slopes. Several results suggest that the quality index performs well. First, the average score is much higher in the Northern Alps (0.84) than in the Southern Alps (-0.56) and the Pyrenees (-1.04). This pattern was expected as the average resort in the Northern Alps has significantly more lifts (+15 compared to the Southern Alps), higher vertical drop (+167 meters compared to the Southern Alps) and longer slope length (+41 kilometers compared to the Southern Alps) than in other regions.
Insert Table 2
Secondly, the highest quality scores are found for the three following world-class connected skiing area: Les Trois Vallees, Les Portes du Soleil, and Paradiski. Les Trois Vallees is described as the largest ski area in the world. It links together three almost parallel valleys (Saint-Bon, Les Allues, Belleville) and offers 600 kilometers of interconnected slopes. Les Trois Vallees encapsulates the resorts of Courchevel, La Tania, Meribel, Bride Les Bains, Les Menuires, Val Thorens and Orelle. Les Portes du Soleil and Paradiski are also two internationally renowned ski areas, each of these connected domains offering more than 200 slopes and 400 kilometers of runs to skiers.
Thirdly, the relative rankings for the various quality attributes are strongly correlated to the ranking obtained from the overall quality index. In the Southern Alps for instance, Serre Chevalier has the overall leading position. This resort is ranked first for number of lifts, vertical drop and length of slopes in the region, and second for its number of slopes. Risoul-Vars is in second position for number of lifts and slope length and first place for number of slopes. Results from the PCA analysis indicate that this resort is ranked second in the Southern Alps. Similarly, in the Pyrenees, Barege La
12
There are four variables for lifts (number of ski-tows, number of ski-lifts, number of cable-cars, number of gondola-funiculars), three for altitude (altitude of the base station in meters, altitude of the top station in meters, vertical drop in meters), and six for slopes (slopes in kilometers, number of slopes, number of beginner slopes, number of intermediate slopes, number of advanced slopes, number of expert slopes).
Mongie and Saint Lary Soulan, which are the resorts with the highest quality scores, have also top rankings in terms of the number of lifts, the number and length of ski runs.
To summarize, the PCA method produces convincing results. It is internally coherent since resorts with high quality facilities for skiing are characterized by higher values for the synthetic quality index obtained from the first PC. In what follows, I explain how to calculate the outer envelope corresponding to efficient resorts in the price-quality space.
5. A non-parametric analysis of the quality-price relationship
I rely on a non-parametric frontier analysis to study the relationship between the lift ticket price and the quality of the ski resort. For this presentation, I suppose that one composite quality index derived from a set of ski resort attributes exists. What is needed to perform a ski resort efficiency analysis is a definition of efficiency. In what follows, ski resorts offering the lowest price for a given quality will be considered as efficient13. If a person has to choose between two resorts with the same quality to spend one day skiing then, everything else being constant, the ski resort with the cheapest price will always be preferred.
It is then straightforward to identify the set of efficient resorts in the price-quality space. All efficient resorts will be located on the outer envelope where price is the lowest for any given quality. A first possibility could be to consider the DEA model characterized by convex production sets and free disposability (Charnes et al., 1978). As emphasized in Cherchye et al. (2000) for instance, the axiom of convexity in DEA assumes away indivisible inputs and outputs, economies of scale and economies of specialization. However, the divisibility of inputs and outputs required by convexity is a challenging assumption in many economic settings, which was highlighted several decades ago by Farrell (1959, p. 378-379): “A glance at the world about us should be enough to convince commodities are to some extent indivisible and that many have large indivisibilities”.
The divisibility of price and quality seems clearly questionable in the setting I consider. The central concern is whether skiers can mix the attributes and ticket prices of two different ski resorts. This would be the case if a skier succeeds in combining, for example, half of a low lift ticket price associated with low quality with half of a high lift ticket price associated with high quality to obtain a medium lift ticket price with medium quality. Such a combination creates two main problems. On the one hand, the skier will be subjected to additional expenditure to be able to ski in two different resorts, related to transportation costs. On the other hand, since I am interested in the daily lift ticket price, the price of a half-day of skiing on a specific area should be one-half of the daily price.
13
Note that the focus is exclusively on the perspective of skiers. Alternatively, one could define efficiency from the perspective of ski resorts. A ski resort would be considered as efficient if it receives the highest price for a given level of quality.
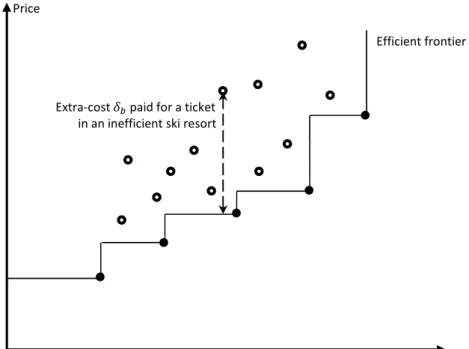
The convexity assumption is not consistent with the pricing strategy set by ski resorts in France. On average, according to my data, the price for one half-day of skiing is around 80% of that of a one-day ticket. So, the assumption of convexity has to be ruled out and I rely instead on the FDH model proposed by Deprins et al. (1984), which only assumes free disposability of the production set. I represent the locus of efficient points in Figure 2. Efficient resorts are located on a staircase frontier since convexity is precluded14.
Insert Figure 2
Formally, let " be the Buyer set, # the lift ticket price and the quality index (with # > 0 and > 0). The Buyer set comprises the various price-quality combinations (#, ) such that a skier is able to buy a lift ticket at price # with quality . Drawing on the framework originally proposed by Ben Lakhdar et al. (2013) in the price-quality-quantity space, I consider the following axioms for the buyer set ".
Axiom A1. If a transaction (#′, ′) is observed, then it is feasible and (#′, ′) ∈ ".
Axiom A2. If a transaction (#′, ′) ∈ ", then for all (#′′, ′′) with #((≥ #′ and ((≤ ′, (#′′, ′′) ∈ ".
Axiom A1 indicates that any price-quality combination observed in the real world is feasible. According to axiom A2, if a price-quality combination is observed, then any ski resort proposing a higher lift ticket price for a lower quality is also feasible from the skier’s perspective. In other words, if a skier chooses a specific ski resort, he could have paid a higher ticket price for at most the same quality in another ski resort. So, I consider that the best situation for the skier (in terms of price for a given quality) is observed, but a worst situation could have been possible for the skier.
Using a sample of ski resorts with information on price and quality, it is possible to estimate the Buyer set ". Assuming that the sample comprises ski resorts ( = 1, … , ), then the Buyer set is defined by:
" = +(#, ): ∑ - # ≥ # , ∑ - ≤ , ∑ - = 1 , - ∈ .0; 101 (3)
The last constraint - ∈ .0; 10 defines a non-convex set. Linear combinations of ski resorts are precluded and only one resort may be part of the optimal solution. It follows that the lower frontier corresponding to efficient resorts will be given by a staircase-shaped line.
For each ski resort, it is possible to measure its distance to the efficient frontier. This distance will indicate the extra cost paid by a consumer when skiing on a non-efficient ski resort. It is also the amount of money that skiers could have saved had they decided to ski in an efficient resort. Drawing on Shephard (1970), the inefficiency of each ski resort 2 with 3 = 1, … , is the solution of:
14
As shown in Figure 2, an alternative definition of efficiency leading to exactly the same FDH frontier consists in first selecting a given level of price. For that price, a ski resort will be considered as efficient if it offers the highest level of quality.
max78,9: 2
s. t. ∑ - # ≤ #2− 2, ∑ - ≥ , ∑ - = 1 , - ∈ .0; 10, 2≥ 0 (4)
From (4), I obtain a set of values 2 corresponding to the amount that could have been saved by a skier had he chosen to ski in an efficient ski resort. By definition, this amount is equal to zero for efficient resorts since the latter offer their tickets at the lowest price for a given quality. In what follows, I estimate the outer envelope of efficient resorts using the French sample of ski resorts.
6. Results from the FDH efficiency analysis
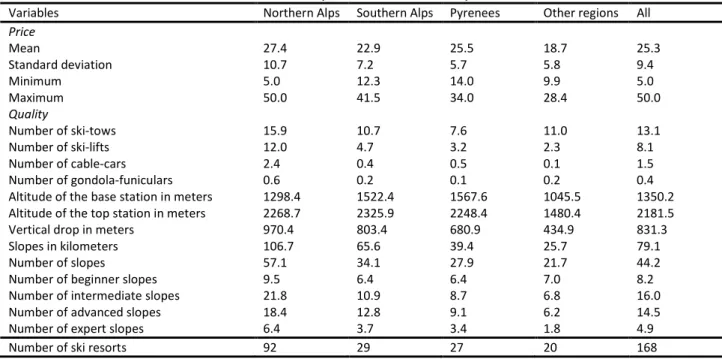
I apply the FDH model to the set of resorts characterized by lift ticket price # and quality index obtained from the first principal component such that = + ?2@+ 115. In Figure 3, I present the outer frontier obtained when using all ski resorts and connected areas. According to my calculations, there are 20 efficient resorts located on the staircase frontier. Ranked by ascending quality, these resorts are respectively Bramans, Bessans Val d’Arc, Col de Porte, Valdrome, Serre-Eyraud, Le Semnoz, Col de Rousset, Bernex, Chabanon, Les Aillons-Margeriaz, Monts Jura, Villard de Lans, Combloux, Val Cenis, Morzine, Espace Diamant, Megeve, Evasion Mont Blanc, Les Portes du Soleil and Les Trois Vallees.
Insert Figure 3
Several comments are in order. Firstly, very small ski resorts may be efficient when they offer attractive prices. Consider the case of Bessans Val d’Arc. This ski resort offers two lifts and three slopes for a total length of three kilometers. For beginner skiers, this resort is very attractive since, for that level of quality, it is impossible to find a cheaper lift ticket price in France. Secondly, in the upper part of the quality distribution, efficient resorts are essentially connected ski areas: Espace Diamant, Evasion Mont Blanc, Les Portes du Soleil, Les Trois Vallees. Although these resorts propose very high prices for a one day-pass lift ticket, they remain nonetheless attractive since they offer vast ski areas with so many lifts and runs convenient for skiers and snowboarders of all abilities.
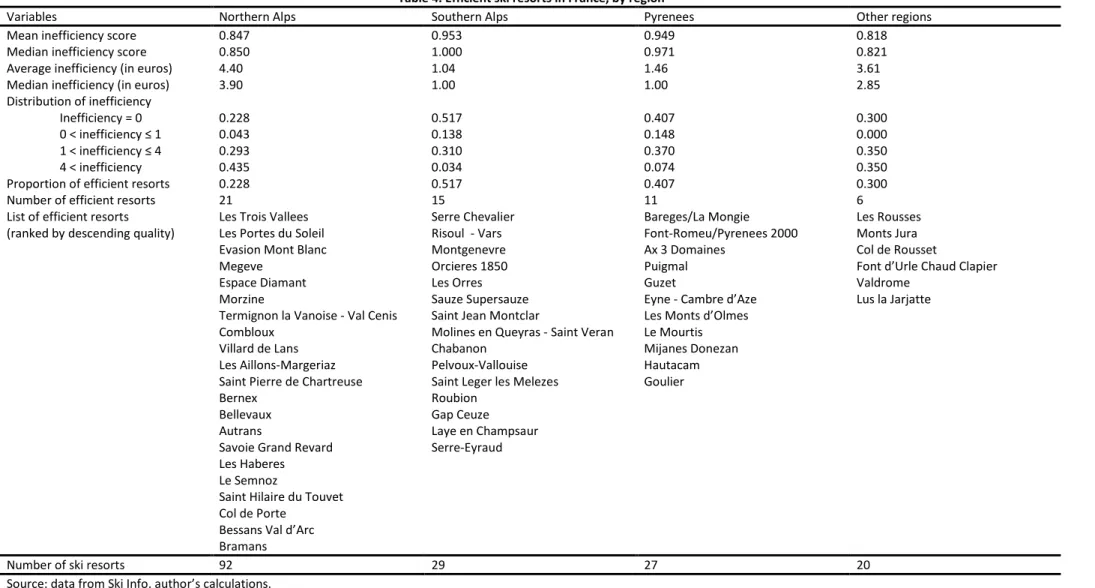
Next, I calculate for each resort its distance to the staircase frontier, which is a measure of its its inefficiency. On average, the lift ticket price could be 4.8 euros cheaper if all resorts were located on the efficient frontier. As shown in Figure 4, 11.9% of ski resorts are efficient, 35% are characterized by an inefficiency below 4 euros, but 20% charge more than 8 euros in excess per lift ticket. Interestingly, there are subtantional differences by regions in this excess price charged by ski resorts. The amount paid in excess is equal to 4.6 euros for ski resorts located in the Northern Alps, 3.2 euros in the Southern Alps and 7.2 euros in the Pyrenees. An explanation for this difference between the Alps and the Pyrenees could be the highest degree of competition between ski resorts
15
As emphasized in Adler and Golany (2001), a difficulty is that the results of a PCA can be negative. To ensure strictly positive data, we increase all PC input data by the most negative value in the vector plus one.
in the Alps16. Since there are many more ski resorts in the former region, they will have to set more competitive prices to attract skiers.
Insert Figure 4
At the resort level, I find large values of inefficiency (more than 10 euros) in very well-known resorts like Chamonix, Courchevel, Praz sur Arly, Les Arcs or Val d’Isere. At first sight, this pattern is rather surprising as these resorts are crowded during the Winter and Spring periods. In fact, recalling that many connected areas are located on the efficient frontier for the highest levels of quality, inefficiency is due to the fact that these resorts are all part of large ski domains. Consider for instance the case of Val d’Isere and Les Arcs. Compared to the efficient resorts, their lift ticket prices should be respectively 12.2 and 13.2 euros lower. Their lift ticket price is very expensive simply because skiers may have access to many more slopes and lifts by spending a few additional euros for the corresponding connected area. Val d’Isere is connected to Tignes and collectively form the Espace Killy, while Les Arcs and La Plagne belong to the Paradiski area17.
To assess the robustness of these findings, I decide to check the sensitivity of my non-parametric estimates with respect to the measurement of quality. Instead of using a synthetic indicator of quality, I determine the set of efficient resorts using the length of runs, the number of slopes and the number of lifts as quality indicators, respectively. The corresponding results are in Table 3. Overall, the mean inefficiency which is 0.815 with the synthetic indicator (first PC) is slightly lower when considering specific aspects of quality: 0.801 with length of runs, 0.765 with number of slopes, 0.734 with number of lifts. The proportion of efficient resorts remains fairly stable, ranging from 10.1% to 12.5%. However, I observe a few changes when considering the average amount of inefficiency. Compared to the synthetic index, selecting a specific component of quality tends to increase the average inefficiency: the average amount is 5.32 euros with length of runs, 6.24 with number of slopes and 7.08 with number of slopes. Coefficients of correlation range between 0.52 and 0.64 for inefficiency scores obtained from the various FDH models.
Insert Table 3 here
Interestingly, the choice of the quality variable has little impact on the sample of resorts setting too high a price for the quality they offer. With the synthetic indicator, 16 resorts are characterized by an inefficiency greater than or equal to 10 euros18. Most of them still remain very expensive when considering specific dimensions of quality: the price in excess paid per lift ticket is at
16
The number of resorts is much more important in the Alps (168 in the Northern Alps, 92 in the Southern Alps) than in the Pyrenees (27 resorts).
17
In terms of price, one day’s skiing in Val d'Isere costs 42.5 euros whereas skiing on the Espace Killy costs 44.5 euros. With this extra-cost of 2 euros per day, skiers have access to 300 kilometers of runs instead of 150 kilometers.
18
By alphabetic order, these resorts are: Chamonix Mont-Blanc; Courchevel; Crest Voland Cohennoz; Font-Romeu/Pyrenees 2000; Formigueres; La Bresse Hohneck; La Pierre St Martin; Les Angles; Les Arcs Bourg St Maurice; Les Houches; Notre Dame de Bellecombe; Peyragudes; Praz sur Arly; Serre Chevalier; Val d'Isère; Ventron.
least 10 euros for 13 resorts with length of runs, 14 resorts with number of slopes and 14 resorts with number of lifts. In columns (5) and (6) of Table 3, I report results obtained when two or three PCs are selected. I find very different results compared to the choice of the first PC only. In particular, the proportion of resorts classified as efficient is much higher: 36.9% with two PCs, 63.7% with three PCs. This illustrates the well-known conclusion that the discriminatory power of data envelopment analysis fails when there is an excessive number of inputs or outputs (Adler and Golany, 2002).
Consequently, the average amount of inefficiency falls to 2.62 euros with inclusion of two PCs and 1.42 euros with inclusion of three PCs. At the same time, I find a very high correlation between the efficiency scores when using either one or two PCs as indicators of quality. The corresponding coefficient of correlation is equal to 0.81219. With two PCs, there are only eight ski resorts characterized by an inefficiency greater or equal than 10 euros: Crest Voland Cohennoz, Formigueres, La Bresse Hohneck, Les Angles, Les Houches, Notre Dame de Bellecombe, Praz sur Arly and Ventron. All these resorts were already on top of the inefficiency amounts when calculating the FDH frontier with the first PC as quality index.
Calculation of specific FDH efficient frontiers for each region indicates that there are substantial differences both in the pricing and quality of resorts depending on their location. As shown in Table 4, among the 27 ski resorts in the Pyrenees, 11 belong to the outer efficient frontier. Goulier offers the lowest lift ticket price for low quality whereas skiers seeking a high quality should go to Bareges/La Mongie. Within the Pyrenees area, the mean amount of inefficiency is now very low (about 1.5 euros), while it was important when comparing the Pyrenees resorts to all other French ski resorts. 40.7% of resorts are efficient and 51.8% are characterized by an inefficiency below 4 euros. The most excessive price is found for the resort Les Angles, with an inefficiency of 6.5 euros per ticket. An explanation could be that this resort attracts many additional skiers coming from Spain, so it faces an increased demand and prices may be less competitive.
Insert Table 4
More than one-half of the resorts (51.7%) located in the Southern Alps are efficient. In this region, very few resorts are characterized by the same quality and one observes a very strong correlation between price and quality. This leads to a very low inefficiency on average (around one euro). Only one ski resort (Greolieres les Neiges) is concerned by an inefficiency exceeding 4 euros. Experienced skiers willing to enjoy vast domains with many lifts and runs (more than 100 kilometers) should choose locations like Serre Chevalier, Risoul-Vars, Montgenevre or Orcieres 1850. Conversely, less experienced skiers interested in limited areas should favor locations like Serre-Eyraud, Laye en Champsaur, Gap Ceuze or Roubion.
19
Conversely, the coefficient of correlation between efficiency scores is much lower (0.545) with one or three PCs, but this is essentially because nearly two-thirds of resorts become efficient with three PCs.
The situation is very different in the Northern Alps, with much more heterogeneity in ski resorts. Both the mean inefficiency and its standard deviation are equal to 4.6 euros. There are 21 efficient ski resorts (22.1% of the resorts). This includes connected ski areas with vast domain (Les Trois Vallees, Les Portes du Soleil, Evasion Mont Blanc and Espace Diamant), but also small resorts with few lifts and runs (less than 10 kilometers) offering cheap ticket prices (Bramans, Bessans Val d’Arc, Col de Porte, Saint Hilaire du Touvet). The distance to the frontier is substantial for most of the ski resorts that are part of connected areas20. Buying a lift ticket for the domain of the resort only and not for the connected domain is definitely an inefficient decision. Skiers could have access to much more slopes and lifts had they chosen to pay a small amount in addition.
7. Conclusion
In this paper, I have presented a simple setting based on the FDH frontier model to study efficiency in the price-quality space. Assuming that efficient consumers will choose the lowest price for a given quality, this implies that all efficient purchases will be located on the outer envelope where price is minimized for any given quality. This setting is applied to a data set on 168 ski resorts in France which includes detailed information on lift ticket prices and resort attributes like the number of lifts, the number and length of slopes or altitude. Using a synthetic index of quality obtained from a PCA analysis, I identify efficient resorts by solving a FDH program in the price-quality space.
Among the 168 resorts under consideration, 20 of them are efficient. Many expensive connected areas offering a very large number of runs and lifts are located on the efficient frontier. The average inefficiency is equal to 4.8 euros, which represents 19% of the average ticket price, and around one-third of the resorts are characterized by an inefficiency below 4 euros. Interesting differences are found when calculating specific regional FDH frontiers. In the Pyrenees and the Southern Alps, the mean inefficiency per ticket price is low, less than 1.5 euros on average. Conversely, the average inefficiency is three times higher for ski resorts located in the Northern Alps. This pattern is explained by the higher heterogeneity in the price-quality relationship in that region. In the Northern Alps, skiers have the possibility to buy lift tickets for large connected ski areas which cost a little bit more than tickets for the resort belonging to this connected area, but give access to many more lifts and slopes. Many resorts are thus very inefficient compared to these vast domains.
A conclusion of my research is that skiers interested in resorts featuring a large number of lifts and slopes should preferably buy a lift ticket for a connected area rather than for the restricted
20
Ten ski resorts are characterized by an inefficiency exceeding 10 euros. By decreasing inefficiency, these resorts are Chamonix Mont-Blanc, Les Menuires, Courchevel, Les Houches, Crest Voland Cohennoz, Notre Dame de Bellecombe, Les Arcs Bourg St Maurice, Praz sur Arly, Val d’Isere and Saint Jean d'Arves.
domain of the resort. While this choice corresponds to an efficient purchase decision, it would be nonetheless interesting to know whether skiers efficiently use their ski pass. It may be for instance that some skiers, having bought access to a vast domain, complete only a few runs during the day, which would be in turn very inefficient given the very high cost per run. The pricing strategy of interlinked resorts charging a high price for the lift ticket of the resort’s specific domain and a slightly higher price for access to the connected area is undoubtedly very interesting for experts and ardent skiers, whereas it could be not so efficient for recreational skiers.
Acknowledgments
This paper is dedicated to my wife Sandrine. I am indebted to participants at the ETEPP workshop (Aussois) and two anonymous reviewers of the journal for their very helpful comments and suggestions. Any remaining errors are mine.
References
Adler N., Golany B., (2001), “Evaluation of deregulated airline networks using data envelopment analysis combined with principal component analysis with an application to Western Europe”,
European Journal of Operational Research, vol. 132, pp. 260-273.
Adler N., Golany B., (2002), “Including principal component weights to improve discrimination in data envelopment analysis”, Journal of the Operational Research Society, vol. 53, pp. 985-991.
Adler N., Yazhemsky E., (2010), “Improving discrimination in data envelopment analysis: PCA–DEA or variable reduction”, European Journal of Operational Research, vol. 202, pp. 273-284.
Alessandrini S., (2013), “Quality of ski resorts and competition between the Emilian Apennines and Altipiani Trentini. An estimate of the hedonic price”, Review of Economic Analysis, vol. 5, pp. 42-69. Barro R.J., Romer P.M., (1987), “Ski-lift pricing, with applications to labor and other markets”,
American Economic Review, vol. 77, pp. 875-890.
Ben Lakhdar C., Leleu H., Vaillant N., Wolff F.C., (2013), “Measuring efficiency of purchasing and selling agents in markets when quality matters: The case of illicit drug transactions”, European
Journal of Operation Research, vol. 226, pp. 646-657.
Borsky S., Raschky P.A., (2009), “The hedonics of hedonism. Estimating the value of risk-taking activities”, Kyklos, vol. 62, pp. 210-225.
Charnes A., Cooper W.W., Rhodes E., (1978), “Measuring the efficiency of decision-making units”,
European Journal of Operational Research, vol. 2, pp. 429–444.
Cherchye L., Kuosmanen T., Post T., (2000), “Why convexify ? An assessment of convexity axioms in DEA”, mimeo, Helsinki School of Economics and Business Administration, Working Paper W-270. Deprins D., Simar L., Tulkens H. (1984), “Measuring labor inefficiency in post offices”, in Marchand M., Pestieau P., Tulkens H., (eds.), The Performance of Public Enterprises: Concepts and
measurements, pp. 243-267.
Domaines Skiables de France, (2012), Indicateurs et analyses 2012, L’Observatoire.
Falk M., (2008), “A hedonic price model for ski lift tickets”, Tourism Management, vol. 29, pp. 1172-1184.
Falk M., (2011), “International price differences in ski lift tickets”, Swiss Journal of Economics and
Statistics, vol. 147, pp. 303-336.
Farrell M.J., (1957), “The measurement of productive efficiency”, Journal of the Royal Statistical
Society, vol. 120, pp. 253–281.
Farrell M.J., (1959), “Convexity assumption in theory of competitive markets”, Journal of Political
Economy, vol. 67, pp. 377-391.
Filmer D., Pritchett L.H., (2001), “Estimating wealth effect without expenditure data – or tears: An application to educational enrollments in states of India”, Demography, vol. 38, pp. 115-132.
Greene W., (2008), “The econometric approach to efficiency analysis”, in Fried H., Lovell K., Schmidt S., (eds.), The Measurement of Efficiency, Oxford University Press, pp. 92-250.
Jolliffe I.T., (2002), Principal Component Analysis, Springer.
Lins M.P., Novaes L.F., Legey L.F., (2005), “Real estate appraisal: A double perspective data envelopment analysis approach”, Annals of Operations Research, vol. 138, pp. 79–96.
Mouchart M., Vandresse M. (2007), “Barganing powers and market segmentation in freight transport”, Journal of Applied Econometrics, vol. 22, pp. 1295-1313.
Mouchart M., Vandresse M., (2010), “A double-frontier approach for measuring market imperfection”, Annals of Operations Research, vol. 173, pp. 137-144.
Murillo-Zamorano L.R., (2004), “Economic efficiency and frontier techniques”, Journal of Economic
Surveys, vol. 18, pp. 33-77.
Mulligan J.G., Llinares E., (2003), “Market segmentation and the diffusion of quality-enhancing innovations: The case of downhill skiing”, Review of Economics and Statistics, vol. 85, pp. 493-501. Nataraja N.R., Johnson A.L., (2011), “Guidelines for using variable selection techniques in data envelopment analysis”, European Journal of Operational Research, vol. 215, pp. 662-669.
Nunamaker T.R., (1985), “Using data envelopment analysis to measure the efficiency of non-profit organizations: A critical evaluation”, Managerial and Decision Economics, vol. 6, pp. 50-58.
Pawlowski T., (2011), “Hedonic prices for ski-lift passes in Europe”, Empirical Economics Letters, vol. 10, pp. 819-825.
Rosen S., (1974), “Hedonic prices and implicit markets: Product differentiation in pure competition”,
Journal of Political Economy, vol. 82, pp. 34-55.
Shephard R.W., (1970), Theory of Cost and Production Functions, Princeton University Press, Princeton.
Ueda T., Hoshiai Y., (1997), “Application of principal component analysis for parsimonious summarization od DEA inputs and/or inputs”, Journal of the Operations Research, vol. 40, pp. 466-478.
Figure 1. Relationship between price and length of slopes in the Pyrenees
Source: data from Ski Info, author’s calculations.
Ascou-Pailhères
Ax 3 Domaines
Camurac
Cauterets
Eyne - Cambre d'Aze
Font-Romeu/Pyrenees 2000 Goulier Guzet Hautacam La Pierre St Martin Le Mourtis Luchon Superbagnères Luz Ardiden Peyragudes Piau Engaly Porte Puymorens Val Louron Artouste Barèges/La Mongie Formigueres Gourette Les Angles
Les Monts d'Olmes
Puigmal
Saint Lary Soulan
Gavarnie/Gèdre Mijanes Donezan 15 20 25 30 35 L if t ti c k e t p ri c e ( in e u ro s ) 0 20 40 60 80 100
Figure 2. Efficient ski resorts in the price-quality space
Price
Efficient frontier
Extra-cost B paid for a ticket in an inefficient ski resort
Quality Legend: efficient ski resorts , inefficient ski resorts
Figure 3. FDH efficiency analysis of French ski resorts
Source: data from Ski Info, author’s calculations. Morzine
Megève
Evasion Mont Blanc
Les Portes du Soleil
Les Trois Vallées
Col de Porte Valdrome Le Semnoz Col de Rousset BernexChabanon Les Aillons-Margeriaz Monts Jura Villard de Lans Combloux Val Cenis Espace Diamant Bramans Bessans Val d'Arc
Serre-Eyraud 0 10 20 30 40 50 L if t ti c k e t p ri c e ( in e u ro s ) 0 5 10 15 20 Quality index
Figure 4. Distribution of inefficiencies of lift ticket prices
Source: data from Ski Info, author’s calculations.
0 5 10 15 20 25 D is tr ib u ti o n ( in % )
Table 1. Descriptive statistics of the sample
Variables Northern Alps Southern Alps Pyrenees Other regions All
Price Mean 27.4 22.9 25.5 18.7 25.3 Standard deviation 10.7 7.2 5.7 5.8 9.4 Minimum 5.0 12.3 14.0 9.9 5.0 Maximum 50.0 41.5 34.0 28.4 50.0 Quality Number of ski-tows 15.9 10.7 7.6 11.0 13.1 Number of ski-lifts 12.0 4.7 3.2 2.3 8.1 Number of cable-cars 2.4 0.4 0.5 0.1 1.5 Number of gondola-funiculars 0.6 0.2 0.1 0.2 0.4 Altitude of the base station in meters 1298.4 1522.4 1567.6 1045.5 1350.2 Altitude of the top station in meters 2268.7 2325.9 2248.4 1480.4 2181.5 Vertical drop in meters 970.4 803.4 680.9 434.9 831.3 Slopes in kilometers 106.7 65.6 39.4 25.7 79.1 Number of slopes 57.1 34.1 27.9 21.7 44.2 Number of beginner slopes 9.5 6.4 6.4 7.0 8.2 Number of intermediate slopes 21.8 10.9 8.7 6.8 16.0 Number of advanced slopes 18.4 12.8 9.1 6.2 14.5 Number of expert slopes 6.4 3.7 3.4 1.8 4.9 Number of ski resorts 92 29 27 20 168
Table 2. Descriptive statistics of the sample
Rank Quality score (first PC)
Ski resort Number of lifts Vertical drop (in meters) Slopes (in kms) Number of slopes Panel A. Northern Alps (N=92)
1 16.75 Les Trois Vallees 160 2620 600 330 (2) (1) (2) (1) 2 13.78 Les Portes du Soleil 209 1566 650 266
(1) (10) (1) (2)
3 11.39 Paradiski 137 2050 425 236
(3) (2) (4) (3)
Mean 0.84 30.9 970.4 106.7 57.1
Panel B. Southern Alps (N=29)
1 4.39 Serre Chevalier 57 1600 250 103 (1) (1) (1) (2) 2 3.01 Risoul - Vars 49 900 185 108 (2) (12) (2) (1) 3 1.58 Montgenevre 26 840 100 86 (5) (14) (7) (3) Mean -0.56 16.1 803.4 65.6 34.1 Panel C. Pyrenees (N=27) 1 1.36 Bareges - La Mongie 28 1050 100 70 (1) (2) (2) (1) 2 0.71 Saint Lary Soulan 25 800 101 56 (2) (7) (1) (2) 3 -0.31 Font-Romeu - Pyrenees 2000 17 501 42 44 (4) (20) (9) (4)
Mean -1.04 11.4 680.9 39.4 27.9
Table 3. FDH efficiency results, by type of inputs
Variables (1) (2) (3) (4) (5) (6)
Measure of quality First PC Length of runs Number of slopes Number of lifts First and second PCs First, second and third PCs Mean inefficiency score 0.815 0.801 0.765 0.734 0.888 0.944 Median inefficiency score 0.833 0.806 0.765 0.736 0.936 1.000 Proportion of efficient resorts 0.119 0.125 0.101 0.107 0.369 0.637 Average inefficiency (in €) 4.78 5.32 6.24 7.08 2.62 1.42 Median inefficiency (in €) 4.00 4.30 6.55 6.55 1.50 0.00 Proportion of resorts with inefficiency ≥ 5 € 0.399 0.446 0.571 0.601 0.220 0.119 Correlation between inefficiency scores
First PC 1.000 0.635 0.637 0.516 0.812 0.545
Length of runs 1.000 0.626 0.555 0.516 0.423
Number of slopes 1.000 0.673 0.463 0.473
Number of lifts 1.000 0.257 0.245
First and second PCs 1.000 0.706
First, second and third PCs 1.000
Table 4. Efficient ski resorts in France, by region
Variables Northern Alps Southern Alps Pyrenees Other regions
Mean inefficiency score 0.847 0.953 0.949 0.818
Median inefficiency score 0.850 1.000 0.971 0.821
Average inefficiency (in euros) 4.40 1.04 1.46 3.61
Median inefficiency (in euros) 3.90 1.00 1.00 2.85
Distribution of inefficiency
Inefficiency = 0 0.228 0.517 0.407 0.300
0 < inefficiency ≤ 1 0.043 0.138 0.148 0.000
1 < inefficiency ≤ 4 0.293 0.310 0.370 0.350
4 < inefficiency 0.435 0.034 0.074 0.350
Proportion of efficient resorts 0.228 0.517 0.407 0.300
Number of efficient resorts 21 15 11 6
List of efficient resorts Les Trois Vallees Serre Chevalier Bareges/La Mongie Les Rousses (ranked by descending quality) Les Portes du Soleil Risoul - Vars Font-Romeu/Pyrenees 2000 Monts Jura
Evasion Mont Blanc Montgenevre Ax 3 Domaines Col de Rousset
Megeve Orcieres 1850 Puigmal Font d’Urle Chaud Clapier
Espace Diamant Les Orres Guzet Valdrome
Morzine Sauze Supersauze Eyne - Cambre d’Aze Lus la Jarjatte Termignon la Vanoise - Val Cenis Saint Jean Montclar Les Monts d’Olmes
Combloux Molines en Queyras - Saint Veran Le Mourtis Villard de Lans Chabanon Mijanes Donezan Les Aillons-Margeriaz Pelvoux-Vallouise Hautacam Saint Pierre de Chartreuse Saint Leger les Melezes Goulier
Bernex Roubion
Bellevaux Gap Ceuze Autrans Laye en Champsaur Savoie Grand Revard Serre-Eyraud Les Haberes
Le Semnoz
Saint Hilaire du Touvet Col de Porte
Bessans Val d’Arc Bramans
Number of ski resorts 92 29 27 20