Development of a Test Bench to Study
Self-Loosening of Bolted Joints
by
Amir HASRAK
THESIS PRESENTED TO ÉCOLE DE TECHNOLOGIE SUPÉRIEURE
IN PARTIAL FULFILLMENT FOR A MASTER’S DEGREE
WITH THESIS IN MECHANICAL ENGINEERING
M.A.Sc.
MONTREAL, SEPTEMBER 25 2018
ÉCOLE DE TECHNOLOGIE SUPÉRIEURE
UNIVERSITÉ DU QUÉBEC
This Creative Commons licence allows readers to download this work and share it with others as long as the author is credited. The content of this work can’t be modified in any way or used commercially.
BOARD OF EXAMINERS
THIS THESIS HAS BEEN EVALUATED
BY THE FOLLOWING BOARD OF EXAMINERS
Prof. Hakim Bouzid, Thesis Supervisor
Mechanical Engineering Department at École de Technologie Supérieure
Prof. Anh Dung Ngo, President of the Board of Examiners
Mechanical Engineering Department at École de Technologie Supérieure
Prof. Mohammad Jahazi, Member of the jury
Mechanical Engineering Department at École de Technologie Supérieure
THIS THESIS WAS PRENSENTED AND DEFENDED
IN THE PRESENCE OF A BOARD OF EXAMINERS AND PUBLIC SEPTEMBER 7th, 2018
ACKNOWLEDGMENT
I would like to thank my thesis supervisor, Hakim Bouzid, for his technical, financial, and moral support throughout these years. His great experience in experimental and analytical research was always a trustable reference and his attitude to share his experience with his students was always encouraging.
My special thanks go to Mr. Ngo and Mr. Jahazi for their participation to the board of examiners.
I would like to thank my wife for her patience, support, and encouragement during my study and my parents who inspired me with their guidance and open mind. Finally, I would like to thank my son, Rodmehr, for giving me motivation to overcome my hard days of work and his patience when I am away for work.
This research was enabled in part by support provided by Calcul Quebec (www.calculquebec.ca) and Compute Canada (www.computecanada.ca)
DÉVELOPPEMENT D'UN BANC D'ESSAI POUR ÉTUDIER L'AUTO-DESSERAGE DES JOINTS BOULONNÉS
Amir HASRAK
RÉSUMÉ
Les méthodes courantes pour étudier l'auto-desserrage des assemblages boulonnés sont la théorie, les simulations numériques et l'expérimentation. Les méthodes théorique et numérique, utilisant principalement la méthode des éléments finis, sont utilisées pour comprendre, évaluer et quantifier ce phénomène, tandis que la méthode expérimentale est surtout utilisée à des fins de validation et de vérification.
La plupart des études expérimentales précédentes sur l'auto-desserrage des assemblages boulonnés ont été réalisées avec une machine d'essai connue sous le nom de Machine Junker qui utilise une cellule de charge conventionnelle et un capteur de rotation qui modifient la géométrie de l’assemblage et les conditions de charge. L'insertion d'un capteur de force ou d'un capteur de rotation modifie la longueur de serrage et la rigidité de l’assemblage, qui sont tous deux des facteurs importants pour l'intégrité du système et le comportement d'auto-desserrage. La non-utilisation de ces capteurs peut grandement simplifier l'étude des assemblages boulonnés et des principaux paramètres. Il est important de ne pas modifier la longueur de serrage et la rigidité de l’assemblage lorsqu'elles sont le sujet principal de l'étude. Dans la conception du banc d'essai actuel, la géométrie de l'assemblage boulonné est exactement la même que dans l'application réelle et dans l'analyse par éléments finis utilisée pour la validation. Le banc d'essai conçu offre la possibilité d'étudier des assemblages boulonnés de différentes épaisseurs de pièces de serrage en combinaison avec différentes pré-charges et déplacements latéraux imposés. Un système de collecte de données numériques est mis en place pour fournir la possibilité de mesurer et d'enregistrer la charge axiale du boulon (précharge), le déplacement latéral imposé et la force latérale résultante, la rotation relative de la vis par rapport à l’écrou, la température, le temps et le nombre de cycles.
Dans un premier temps, un dispositif de serrage a été conçu pour recevoir l’assemblage boulonné et son instrumentation. Une articulation a été fixée à la plaque inférieure pour minimiser les forces et les moments de flexion indésirables. Une analyse par éléments finis de la nouvelle conception a été effectuée pour s’assurer de l'intégrité structurelle des éléments permettant l’assemblage et l’installation des plaques, qui sont le point le plus faible du mécanisme. Les capacités maximales de toutes les autres pièces mécaniques standards sont définies par leurs fabricants respectifs et sont comparées aux résultats de l’analyse par éléments finis.
Dans la deuxième étape, les engrenages d'entraînement du système bielle-manivelle ont été modifiés afin d'améliorer leurs performances pour s'adapter aux nouvelles connexions. Dans la troisième étape, deux ensembles de pièces ont été conçus pour recevoir le capteur de déplacement latéral et le capteur de rotation. Les deux ensembles ont été conçus pour s'adapter à différents contextes d'essai en utilisant des calles simples et peu coûteux. Un compteur magnétique numérique est ajouté au système pour enregistrer le nombre de cycles.
VIII
Un thermocouple a également été envisagé pour mesurer la température des plaques dans le cadre d'études ultérieures. Comme dernière étape, tous les capteurs ont été connecté à un ordinateur par l'intermédiaire d'une carte d’acquisition et de control de données et une carte PCB. Le système de collecte de données est visualisé et contrôlé par le logiciel LabView. Pour des fins de validation et des essais préliminaires, une analyse complète 3D par éléments finis de l’assemblage a été réalisée et les résultats ont été comparés à des essais expérimentaux. Dans cette étape, un assemble composé de deux plaques d'acier (d'une épaisseur de 10 mm), de deux rondelles d'acier, d'un boulon et d'un écrou a été évalué. Les résultats montrent que la machine développée est fonctionnelle et peut être utilisée pour la prochaine étape de la recherche.
Mots-Clés: Auto-desserrage, analyse par éléments finis, pré-charges, force latérale, déplacements latérale.
DEVELOPMENT OF A TEST BENCH TO STUDY SELF-LOOSENING OF BOLTED JOINTS
Amir Hasrak
ABSTRACT
Common methodologies to study self-loosening of bolted joint are analytical, finite element, and experimental. Analytical and finite element methods are used to find, evaluate, and quantify this phenomenon while the experimental method is mostly used for validation and verification purposes. Most of the previous experimental studies on self-loosening of bolted joints have been performed with a test machine known as Junker Machine which uses a conventional load cell and a rotation sensor which change the geometry of the joint and loading condition. Inserting a load cell or a rotation sensor changes the clamping length and joint stiffness, which both are important factors in joint integrity and self-loosening behavior. Their non-use of load cell can greatly simplify the study of bolted joints and the investigation of other parameters. It is important to not alter the clamping length and stiffness of the joint when they are the main subject of study. In the design of the current test rig, the geometry of the bolted joint is maintained exactly the same as in the real application and in the finite element analysis used for validation. The designed test bench provides the possibility of studying bolted joints with different thicknesses of clamping parts in combination with different preloads and lateral imposed displacements. A digital data gathering system is put in place to provide the possibility of measuring and recording of bolt axial load (preload), imposed lateral displacement and resulting force, relevant rotation of the bolt and nut, temperature, time and number of cycles.
In the first step, a clamping device was designed to accommodate the test plate clamping joints and its instrumentation. A universal joint has been attached to the lower plate to minimize undesirable bending force and moments. A finite element analysis of the new design has been carried out to ensure the integrity of the plate attachments which are the weakest point in the mechanism. The maximum capacity of all other standard mechanical parts is defined by their respective manufacturers and are compared with results from the analysis.
In the second step, the driving gears and crank system have been repaired and modified to improve their performance to adapt with the new connections.
In the third step, two mounting assemblies have been designed to hold the lateral displacement sensor and the rotation sensor. Both assemblies have been designed to accommodate different test settings using simple and low cost inserts. A digital magnetic counter is added to the system to record the number of cycles. A thermocouple has also been considered to measure temperature of plates in further studies.
As the last step, all sensors have been connected and synchronized to a computer via a PCB. Data gathering system is visualized and controlled by LabView software.
As the first phase of the project, a full 3D FE analysis of the joint has been performed and results have been compared to experimental test. In this step, a clamping joint consisting of
X
two steel plates (with 10 mm thickness), two steel washers, a bolt and a nut has been evaluated.
The results show that the developed machine is functional and can be used for the next step of the research.
TABLE OF CONTENTS
Page
INTRODUCTION ...1
CHAPTER 1 LITERATURE REVIEW ...7
1.1 Introduction to previous work studies...7
1.2 Analytical modeling ...9
1.3 Experimental studies ...16
1.4 Finite Element ...20
1.5 Objectives of the current study ...24
CHAPTER 2 EXPERIMENTAL TEST RIG ...27
2.1 General description of the developed test rig ...27
2.2 Requirements and limitations ...30
2.3 Preload sensor ...32
2.4 Rotation sensor ...41
2.5 Lateral load cell...47
2.6 LVDT displacement sensor ...54
2.7 Cycle counter ...58
2.8 Test plates ...59
2.9 Data acquisition system ...61
CHAPTER 3 FINITE ELEMENT ANALYSIS ...65
3.1 Description of general model simulation ...65
3.2 Material description ...65
3.3 Geometry...66
3.4 Meshing...70
3.5 Mesh convergence criteria ...76
3.6 Boundary conditions ...76
3.7 High-Performance Computing of Calcul Quebec. ...80
3.8 Post-Processing ...81
CHAPTER 4 DISCUSSION OF RESULTS...83
4.1 Introduction ...83
4.2 Experimental results...83
4.3 Finite element results ...94
CONCLUSION ...105
FUTURE STUDIES...109
APPENDIX I ...111
LIST OF TABLES
Page
Table 2-1 Boundary condition reaction- relative displacement of plates ...52 Table 4-1 Effect of preload on self-loosening ...91
LIST OF FIGURES
Page
Figure 1-1 Self-loosening process (Jiang, Zhang, & Lee, 2006) ...7
Figure 1-2 Theoretical and experimental comparison of the self-loosening behavior for the bolt-nut assembly for five wedge angles under a preload of 12000 N (Yang & Nassar, 2011a) ...10
Figure 1-3 Effect of the hole clearance on loosening behavior (Yang & Nassar, 2011b) ...11
Figure 1-4 Effect of bolt grip length on the threshold preload for ½”-13 fasteners at 0.365 mm excitation (A. M. Zaki et al., 2011). ...12
Figure 1-5 Effect of Young’s modulus of bolt material on the threshold preload (Yang et al., 2010) ...12
Figure 1-6 Effect of under head conical angle on the self-loosening behavior (A. M. Zaki et al., 2012) ...14
Figure 1-7 Free body diagram of bolt and nut thread contact (Zhang et al., 2007) ...15
Figure 1-8 Effect of friction combination on the rate of self-loosening (A. Zaki et al., 2010) ...15
Figure 1-9 Experimental Setup (Jiang et al., 2006) ...17
Figure 1-10 Test setup developed by Nassar & Housari (Nassar & Housari, 2007) ...18
Figure 1-11 Section view of test machine used by (Eccles et al., 2010) ...19
Figure 1-12 section view of test machine (Sawa et al., 2012) ...20
Figure 1-13 Simplified model of thread’s contact (Zhang et al., 2007) ...21
Figure 1-14 Finite element result of studied joints (Sawa et al., 2012) ...22
Figure 1-15 FEA model of the eccentric nut (Sawa et al., 2010) ...23
Figure 1-16 Comparison of loosening in joints with hexagon and eccentric nut (Sawa et al., 2010) ...24
XVI
Figure 2-1 Fatigue and endurance testing machine
(Systems Integrators LLC, 2011) ...28
Figure 2-2 Main board and electrical kit assembly ...29
Figure 2-3 Grip length before inserting load cell ...32
Figure 2-4 Grip length after inserting load cell ...33
Figure 2-5 Strain gage (KYOWA Catalog, See APPENDIX I) ...34
Figure 2-6 Cylinder with and without hole ...35
Figure 2-7 Preload sensor position in the bolt ...35
Figure 2-8 Effect of tolerance on inclination angle ...36
Figure 2-9 Installation fixture ...38
Figure 2-10 Adapter, Part A ...38
Figure 2-11 Adapter, Part B...39
Figure 2-12 Adapter set with bolt ...39
Figure 2-13 Bolt calibration results ...40
Figure 2-14 Bolt strain stability results ...40
Figure 2-15 Strain gage installed in the bolt ...41
Figure 2-16 Rotation sensor (MIDORI_PRECISIONS, 2009) ...42
Figure 2-17 Sensor’s support ...42
Figure 2-18 Nut holder ...43
Figure 2-19 Spacer - M12 bolt and 10mm plates assembly ...44
Figure 2-20 Fixture of rotation sensor ...45
Figure 2-21 Section of rotation fixture ...46
Figure 2-22 Bolt model with notch on the end ...46
Figure 2-23 Calibration of rotation sensor ...47
Figure 2-25 Plate section in transducer connection area ...49
Figure 2-26 Boundary Conditions ...50
Figure 2-27 Coordinate system used in FEA results ...50
Figure 2-28 Equivalent stress in axial (Z) direction ...51
Figure 2-29 Equivalent stress around the hole ...51
Figure 2-30 Equivalent stress distribution through plate thicknesses ...52
Figure 2-31 Results of load cell calibration ...53
Figure 2-32 Macro sensor, CD 375 (TE_Connectivity_Corporation, 2017) ...55
Figure 2-33 Concept of LVDT performance (TE_Connectivity_Corporation, 2017) ...55
Figure 2-34 LVDT fixture ...56
Figure 2-35 LVDT holders, position and details ...57
Figure 2-36 Dimensions of LVDT holders ...57
Figure 2-37 Results of LVDT calibration ...58
Figure 2-38 Cycle counter position ...59
Figure 2-39 Bolted joint set-up ...60
Figure 2-40 Test plate geometry ...61
Figure 2-41 A part of the main vi program of LabView ...62
Figure 2-42 Data acquisition user interface ...63
Figure 3-1 Material definition ...66
Figure 3-2 Actual geometry of the bolt’s thread (ASME, 2001) ...67
Figure 3-3 Simplified geometry of the bolt thread. ...67
Figure 3-4 Actual geometry of the bolt head ...68
Figure 3-5 Bolt Geometry ...68
XVIII
Figure 3-7 Washer geometry ...70
Figure 3-8 Plate geometry ...70
Figure 3-9 Consistant bodies of the nut cylinder and thread ...71
Figure 3-10 Meshing of the nut thread and bonded area ...72
Figure 3-11 Meshing of the nut cylinder ...72
Figure 3-12 Meshing of the plate ...72
Figure 3-13 Meshing of the washer ...73
Figure 3-14 Bonded area of the washer to the plate ...73
Figure 3-15 Bolt stem, consisting bodies and meshing ...74
Figure 3-16 Meshing of the bolt threads...75
Figure 3-17 Bonding surfaces of the bolt threads and stem ...75
Figure 3-18 Lateral displacement vs. load time ...76
Figure 3-19 Boundary conditions ...77
Figure 3-20 Contact between threads ...78
Figure 3-21 Contact surface between the bolt cap and plate ...78
Figure 3-22 Nut to plate contact surface ...79
Figure 3-23 Plate-to-plate contact surface ...79
Figure 4-1 Preload vs. Cycles (8.1 KN & 0.025mm) ...84
Figure 4-2 Lateral force vs. Cycles (8.1 KN & 0.025mm) ...85
Figure 4-3 Rotation vs. Cycles (8.1 KN & 0.025mm)...85
Figure 4-4 Preload vs. Cycles (7.7 KN & 0.025mm) ...86
Figure 4-5 Lateral force vs. Cycles (7.7 KN & 0.025mm) ...87
Figure 4-6 Rotation vs. Cycles (7.7 KN & 0.025mm)...87
Figure 4-8 Lateral force vs. Cycles (3.2 KN & 0.075mm) ...88
Figure 4-9 Preload vs. time (Eccles et al., 2010) ...89
Figure 4-10 Rotation vs. Cycles (3.2 KN & 0.075mm)...89
Figure 4-11 Preload vs. Cycles (3.9 KN & 0.06mm) ...90
Figure 4-12 Lateral force vs. Cycles (3.9 KN & 0.06mm) ...90
Figure 4-13 Rotation vs. Cycles (3.9 KN & 0.06mm)...91
Figure 4-14 Preload vs. Cycles (4.1 & 4.2 KN & 0.005mm) ...92
Figure 4-15 Lateral force vs. Cycles (4.1 & 4.2 KN & 0.005mm) ...93
Figure 4-16 Rotation vs. Cycles (4.1 & 4.2 KN & 0.005mm) ...94
Figure 4-17 Preload (15 KN and 0.44mm) ...95
Figure 4-18 Lateral force (15 KN and 0.44mm) ...96
Figure 4-19 Rotation (accumulated) (15 KN and 0.44mm) ...96
Figure 4-20 Rotation per cycle (15 KN and 0.44mm) ...97
Figure 4-21 Transverse displacement between threads (15 KN and 0.44mm) in actuation direction ...97
Figure 4-22 FE Rotation vs. rotation proposed by (Zhang et al., 2007) ...98
Figure 4-23 Transverse displacement and rotation per cycle ...99
Figure 4-24 Preload drop comparison ...101
Figure 4-25 Preload drop in 20 cycles (8.1kN and 0.02mm displacement) ...102
Figure 4-26 Lateral force in 20 cycles (8.1kN and 0.02mm displacement) ...102
LIST OF ABREVIATIONS
3D Three Dimensional
ANSI American National Standards Institute APDL ANSYS Parametric Design Language ASME American Society of Mechanical Engineers
B.C. Boundary Condition
CNC Computer Numerical Control CPU Central Processing Unit Deg. Degree
ETS École de Technologie Supérieure FEA Finite element analysis
GHz Giga Hertz
HPC Hi-performance calculation ID Identification
IDLH Immediately Dangerous to Life and Health LVDT Linear Variable Differential Transformer MAZ Mettre à Zero (set to zero)
MB Mega Byte
NIOSH National Institute for Occupational Safety and Health OSHA Occupational Safety and Health Administration PCB Printed Circuit Board
Ppm Parts-Per Notation
R&D Research and Development
TB Tera Byte
UNF Unified National Thread - Fine series USD United States Dollar
LIST OF SYMBOLS Kt Total stiffness Kj Joint stiffness Kb bolt stiffness, Kn nut stiffness Km Member stiffness Kw washer stiffness Kp plate stiffness
Ad section areas of the unthreaded portion of bolt
At section areas of the threaded portion,
Lt effective threaded length
Ld length of the unthreaded portion
E Young Modulus A area
Sy Yield strength
dx Deformation in axial direction
Rotation vector L Length PL Preload D Applied displacement d Circumferential displacement β Pitch angle α Half-apex angle μ Friction coefficient t Transverse displacement
INTRODUCTION
0.1 Description of a bolted joint
Bolted joints are the most common non-permanent clamping method in the world because of their short assembling and dissembling time and low fabrication and maintenance costs. They are widely used in many industries like automobile, petroleum, power and energy and construction. The demand for bolted joints and fasteners use in equipment is growing all the time. According to Shish “The global industrial fastener demand will grow 30% to USD 93.8 billion by 2018, among which global automotive fastener demand accounts for 27.8% (USD 26 billion)” (Shih, 2015).
A basic bolted joint includes at least two mating parts or clamping plates, one bolt and one nut. In the tightening process of a bolted joint, the helical geometry of the threads converts the relative angular movement of the bolt and nut to an axial elongation in the bolt. The elongation in the bolt creates a force in the bolt called preload or axial load. This force is responsible for the integrity of the joint assembly. Designers might decide to add other elements to the design of the joint to improve its performance (e.g. washer, spring washer, lock-washer and lock-nut), but the general behaviour of the joint will remain the same. Several factors affect preload, such as thread pitch, thread friction, thread angle, stiffness of the joint, etc. Many studies have been conducted to identify and improve these factors to increase the efficiency and endurance of bolted joints but there are still many unknown factors.
0.2 Problems associated to bolted joints
The most important problem associated with bolted joints is the loss of preload. “The key issue as far as bolt life and integrity are concerned is, however, the tension in it” (Bickford, 2008). In order to keep the integrity of the joint, minimum preload has to be maintained in the bolt. Problems associated with bolted joints are divided into two categories; a) problems causing material failure or fracture and b) problems causing loss of preload without material failure.
2
Fatigue, creep, and over-load are the most important causes of material failure in bolted joints. Many studies have been conducted to increase bolt life in vibration and high temperature applications. Although transverse lateral movement can cause fatigue and self-loosening, the failure process is quite different in each case. Even though mechanical rupture is a severe failure in a system, self-loosening is, statistically, the most considerable and major problem in bolted joints. The sources of such problems will not be studied throughout this research.
When a joint is subjected to transverse lateral movement, depending on the preload magnitude and other joint parameters, preload might drop with or without relative rotation of bolt and nut. This phenomenon is called self-loosening. “Self-loosening is the gradual loss of the clamping force in the bolted connections under cyclic external loading, especially transverse loading” (Zhang, Jiang, & Lee, 2007). This problem is pervasive in automobile, aerospace, petroleum, and energy industries. A significant portion of customer service claims in the automobile industry are caused by the loosening of bolted connections which come at a significant financial cost to the industry. The most important bolted joint in the petroleum and energy industries are flanged connections. Any preload drop in flanges increases the chance of leakage which is problematic in sour, flammable, and explosive services. The importance of sealing performance is greater when 20ppm of Hydrogen Sulfide (H2S) is present as the general industry ceiling limit and 100ppm as NIOSH IDLH (Immediately Dangerous to Life and Health) (OSHA, 2013).
Many parameters can affect preload loss and despite the many pieces of research conducted to discover and quantify them, there are still many unknown factors in self-loosening. Friction between threads, between the nut/bolt head and mating parts, and between mating parts are of the most important factors in self-loosening. The pitch and angle of the threads also play a large role in the self-loosening of bolted joints. The friction of pitch and angle of the threads are the determinant factors in locking of bolts. The effective factors for self-loosening will be enumerated in the literature review chapter in greater details.
Some solutions, like adding a nut-lock, spring-nut, or spring washer have been suggested and evaluated to prevent self-loosening. However, no definitive solution has been found up to now. Some researchers have found and suggested a safe design zone to avoid self-loosening, but it does not cover all types of bolted joints and as such, the design of joints out of this range remain in the danger zone.
0.3 Overall aim of the present study
The overall aim of this study is to develop a test rig to evaluate the effect of joint stiffness on the self-loosening of bolted joints. Stiffness is a dependent variable which depends on the thickness of plates and material modulus of elasticity of the clamping parts. Both variables have been studied separately before but their effects have not been studied in term of stiffness.
The first important study in self-loosening was carried out in 1969 by Junker who invented a machine to test joints under transverse loads. Some modifications have been applied to his original design of the machine, known as a Junker machine, to improve its performance, but the concept remains the same. The basic concept of all self-loosening test machines is the same; a power source and a linkage mechanism, which serves to convert and transfer power, usually from an electrical motor, exert lateral movement on the tested bolted joint.
Because commercial self-loosening machines are expensive, which does not fit in this project budget, and do not fulfill the required conditions, an in-house instrumented bolted joint system (designed and installed in the lab) is mounted on a simple tensile machine to make a self-loosening test bench.
The overall aim of the first phase of this research is to develop an instrumented test bench that can be mounted on a tensile machine which provides cyclic movement to test samples with different thicknesses. This machine must be able to test a bolted joint consisting of a bolt, a nut, two plates, and two washers. Studying a bolted joint with different plate thicknesses will allow us to evaluate the effect of joint stiffness and joint clamping length.
4
In order to study the self-loosening phenomenon, a machine with the following capabilities is needed:
- Measuring the relative rotation of bolt and nut; - Measuring the preload;
- Measuring lateral force in mating parts; - Measuring the relative movement of plates; - Measuring the test time;
- Counting the number of cycles during the test time;
- Integrating and correlating the above-mentioned parameters.
Most of vibration and repeated loads in nature and in industry are displacement control; this point obliges all designs to be conducted based on a displacement control. To do so, lateral displacement can be provided by an electrical motor and displacement amplitude can be adjusted via a gearbox or variable linkage mechanism. These systems are easier to drive, but are high in integrity failure risk and stress level control. As a small displacement can cause high stress, it is very important to find and evaluate the most critical point of the system in test rig design to avoid any risk of rupture and danger. To make sure that the test bench works well and the measuring devices are accurate enough, one bolted joint has been analyzed with FE and the results have been compared to experimental tests done by test bench.
0.4 Description of the thesis content
In the second chapter, previous research on self-loosening will be reviewed to clarify problems and methodologies. Different methods and their advantages and disadvantages are reviewed and discussed and their results are compared.
The steps taken in test bench design are discussed and explained in detail in chapter three. The general overview of the system, requirements, simplifications, and limitations in the design process are mentioned. Some of the detailed calculations used in the design and fabrication of parts are also shown. Detailed drawings of all parts are given in the related appendices and their functionality is discussed.
In chapter four, the performed finite element analysis is explained in detail. The simplifications and assumptions of the geometry and boundary conditions are also detailed and the meshing and high-performance calculation information is presented. The tools used for post-processing and the mesh convergence criteria are discussed as the last subjects in this chapter.
Chapter five contains all results from the experimental and finite element analysis. The experimental results are compared to their finite element counterpart and all disparities are discussed. The experimental and finite element comparison is used to justify the accuracy and suitability of the test rig.
Chapter six gives the overall conclusion of the performed study and chapter seven presents some recommendation to improve the rig and future work to be conducted on the study of self-loosening.
CHAPTER 1 LITERATURE REVIEW
1.1 Introduction to previous work studies
The self-loosening phenomenon is related to bolt load drop and has been identified to happen in two stages. Stage I involves the gradual clamping force reduction with no relative rotation of nut and bolt. Cyclic plastic deformation and the resulted stress redistribution and ratcheting deformation in the bolt are responsible for this first stage of self-loosening (Figure 1-1). Stage II is related to the backing-off of the nut and is associated to the relative motion of the nut and bolt causing drastic clamp force reduction. Researchers have studied these two stages using different methods that can be categorised into finite element, analytical, and experimental studies. Each method has advantages and disadvantages depending on the parameters of interest.
Figure 1-1 Self-loosening process (Jiang, Zhang, & Lee, 2006)
Analytical methods to treat self-loosening involve complex mathematical equations. The bolted joint is a statically indeterminate structure that requires the development of a system of complex equations based on the free body diagrams of the individual joint members and
8
the compatibility equations of the displacements and rotations that exist between them. Assumptions must be made to simplify the system geometry and equations in order to solve the problem. A lot of time is required to solve the problem because of the many iterations involves, but once completed, all the considered variables can be evaluated with reasonable accuracy. The analytical method is time-consuming and a high-performance computer HPC should be considered for most cases to solve the differential equations. However, the analytical model can easily be extended to cover many different applications and other bolted joint cases by changing the geometry, boundary conditions and loads. The basic differential equation formulation is determined by the joint parameters; therefore, new mathematical models must be elaborated for each independent case. Some researchers focused on this method to develop models for different types of bolts and nuts. Parameters such as preload, bolt/nut friction with joint members, friction between nut and bolt threads have been previously studied. Conversely, there have been few theoretical studies about the effect of the different joint element stiffness’s on the self-loosening of bolted joints which is one of the purpose for which the rig has been developed.
The finite element method is widely used in all industries. FE modeling of bolted joints is a relatively a simple task to do nowadays, however the simulation of the self-loosening mechanism is not a straight forward task to be conducted by even an experienced design engineer. The modeling is complex and tedious and HPC is still needed. The simplification of the geometry and the boundary conditions causes some deviation from realistic conditions. Due to complicated helical geometry and non-linear contact surface behaviour in bolted joints, special modeling techniques should be used to yield accurate results. Different material behaviors can be studied more easily with FE when compared to analytical methods. Researchers in different universities and R&D institutions are using FEA to study different combination of joint members, materials, material models, and loadings to see how they affect self-loosening behaviour. In previous studies, stage I and II of self-loosening were studied and different parameters were covered, but there has not been a study that combines both stages and the effect of joint stiffness on the self-loosening.
The experimental method is the most realistic and preferred mean to study the behavior of structures in general and the self-loosening of bolted joints in particular. Valuable data can be obtained by using controlled realistic test conditions; however, cost, measurement limitations and equipment capacity are some restraints to name a few. It is almost impractical to simulate certain load cases or joint combinations with laboratory facilities. Experiments are usually used to verify results derived from other methods such as analytical and numerical simulations. Most of experimental tests are conducted using a Junker machine used in conjunction with instruments that may affect the results like the presence of a load cell in a joint. Indeed, a load cell affects joint stiffness and grip length. In order to avoid such interference new settings are required to maintain acceptable conditions to study the effect of joint stiffness. The distinguishing feature of the test rig that was developed for this project is its faithful representation of the physical behavior of a bolted joint. In this chapter, previous studies are grouped and reviewed based on the method of analysis used.
1.2 Analytical modeling
Yang et al. (Yang & Nassar, 2012) developed an analytical model to study different parameters leading to self-loosening of bolted joints. Bolt and nut differential rotational angle, friction and local slippage behaviour, bolt bending deflection and transverse displacement, and clamping force are to name a few the results have been compared with experimental ones. Their results confirm that higher preload leads to a higher self-loosening resistance.
Yang et al. (Yang & Nassar, 2011a) have also studied the effect of wedge angle on loosening both analytically and experimentally. They proposed a model to predict the self-loosening and validated their model experimentally using tests on a modified Junker machine. This model shows that a sufficiently large wedge angle of the nut under head surface can reduce considerably self-loosening as shown in Figure 1-2.
10
Figure 1-2 Theoretical and experimental comparison of the self-loosening behavior for the bolt-nut assembly for five wedge angles under a preload of
12000 N (Yang & Nassar, 2011a)
The effect of thread profile angle and the clearance of the thread and hole have been studied using an analytical method (Yang & Nassar, 2011b). They have concluded that increasing the thread and hole clearance reduces the self-loosening resistance of the joint Figure 1-3. It is also concluded that increasing the thread profile angle increases the self-loosening resistance significantly.
A formula to find a preload threshold (minimum initial preload) for self-loosening of countersunk bolts, depending on their bearing friction, thread pitch, and excitation amplitude have been developed (Zaki, Nassar, & Yang, 2011). The authors discussed the effect of grip length, which is an independent factor that joint stiffness depends on. Their results show that decreasing grip length increases the preload threshold non-linearly, such that a joint with a grip length 8% shorter needs a 40% bigger preload in order to not be affected by self-loosening (Figure 1-4). They also confirmed that bearing friction and thread clearance,
respectively, have positive and negative effects on self-loosening. The experimental validation was also conducted on the same machine.
Figure 1-3 Effect of the hole clearance on loosening behavior (Yang & Nassar, 2011b)
Yang et al. proposed a novel criterion for the self-loosening of threaded fasteners. They developed a new approach to investigate the effect of “bearing and thread friction coefficients, bolt grip length, thread pitch, material, and the cyclic amplitude of the transverse excitation” (Yang, Nassar, & Wu, 2010). The new approach illustrates the true behaviour of the joint in the presence of transversal excitation.
Their results conformed to other research results and confirmed that using fine thread fasteners improves self-loosening resistance, increasing bearing friction and thread friction also increases self-loosing resistance significantly, and excitation amplitude is linearly related to the threshold preload. As illustrated in Figure 1-5, increasing Young modulus decreases self-loosening resistance, and points to the fact that higher preload is required to prevent self-loosening.
12
Figure 1-4 Effect of bolt grip length on the threshold preload for ½”-13 fasteners at 0.365 mm excitation
(A. M. Zaki et al., 2011).
Figure 1-5 Effect of Young’s modulus of bolt material on the threshold preload (Yang et al., 2010)
Nassar and his research team focused on the analytical method and have performed a number of studies to investigate other factors and joint types. They studied the effect of thread fit and hole clearance using analytical and experimental methods (Nassar & Housari, 2007). It was illustrated that preload drops faster and that less cycles are needed for a complete loosening when the hole clearance is increased and the applied displacement is significant enough to slide the bolt all the way through the hole clearance. Thread fit was found to have the same effect on self-loosening resistance, where a tighter thread fit results in a higher loosening resistance. A modified Junker machine was used to perform the experimental test. The experimental and analytical results match well and the deviation between them is justified by the nominal clearance used in the analytical calculations. Clearance has an exact and distinct value for each thread designation in the analytical method whereas it can be defined within a range in the experiment with a max and a min values defined by the standard designation.
In another piece of research, Zaki et al. studied the effects of conical angle and thread pitch on the self-loosening of a bolted joint in the presence of transverse cyclic displacement (A. M. Zaki, Nassar, & Yang, 2012). The different steps for the analytical method including the free body diagram, the compatibility and equilibrium equations, and final solutions are explained and presented. The pitch, which is defined as the distance between the tips of two adjacent threads is found to have an important effect on the loosening. However, increasing conical angle has a direct effect on self-loosening resistance. As illustrated in Figure 1-6, increasing the conical angle improves the loosening resistance of the joint. Like in other studies, a modified Junker machine was used for the experimental tests and preload was measured using a load cell.
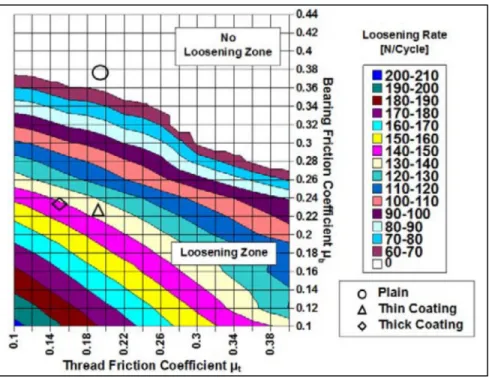
Zaki et al. investigated the effect of thread and bearing friction on the self-loosening of countersunk bolts (A. Zaki, Nassar, & Yang, 2010). As the friction coefficient is directly influenced by the coating type and thickness, this study helps predicting the effect of coating on self-loosening. The analytical model they developed was solved using a MATLAB code and the resulting data showed a good correlation with the experimental results. They defined different zones of loosening and no-loosening based on thread and bearing friction. The
14
bordered zones define the combinations of thread and bearing friction with excitation amplitude, so that a loosening life cycle can be estimated. Alternatively, a desired thread and bearing friction can be found to improve self-loosening resistant in a bolted joint (Figure 1-8). As with the other studies conducted by this research team, the Junker machine was used to perform the experimental tests.
Figure 1-6 Effect of under head conical angle on the self-loosening behavior (A. M. Zaki et al., 2012)
Zhang et al. performed an analytical study to clarify the self-loosening mechanism. Their proposed model is based on a simple block sliding in a double inclined plane (Figure 1-7)(Zhang et al., 2007). This model shows that the back-off of the nut, which is the main reason for preload drop in stage II of self-loosening, is caused by “repeated micro slip between the contact surfaces of the engaged threads and the reversed bending moment exerted on the bolt and the nut” (Zhang et al., 2007).
Many different types of self-loosening resistant bolts and nuts have been invented and are being used in industry. Any combination of bolt and nut makes a different bolted joint that behaves differently when subjected to lateral vibration. The prevailing torque nut (locknut) is currently one of the most popular nuts used in industries to enhance loosening resistance.
Figure 1-7 Free body diagram of bolt and nut thread contact (Zhang et al., 2007)
Figure 1-8 Effect of friction combination on the rate of self-loosening (A. Zaki et al., 2010)
Eccles et al. investigated the self-loosening behavior of joints with a locknut. Their study showed that although prevailing torque nuts improves self-loosening resistance, they increase the chance of complete detachment of the joint when axial load and transverse movement are
16
applied simultaneously (Eccles, Sherrington, & Arnell, 2010). In joints with regular nuts, the rotation of the nut stops when the axial load of the bolt reaches zero, nevertheless the axial load provided by the elastic deformation of a locknut presumes the loosening process to the complete detachment of the nut. The analytical model used in this study is similar to the one used by Zhang et al. A simplified free body diagram of the bolt and nut thread contact is used to explain the loosening mechanism based on slippage.
1.3 Experimental studies
Junker performed one of the earliest experimental studies on the self-loosening of bolted joints. He discussed the theory of loosening and conducted experimental tests with a machine that laid the groundwork for many future experimental studies (Junker, 1969). The basic components of his machine are an electrical motor to provide excitation displacement, a gear and linkage system to control and transfer the displacement, clamps, and sensors to gather information during the test. He used rollers to reduce friction between the mating plates and consequently reduces the required lateral force; however, this creates an unrealistic condition. The displacement control is far from the joint centerline and the displacement values are influenced by the deformation of other parts. Adding a rotation measurement device might be the most important modification to study stage II of self-loosening. This machine is the basic concept for most test rigs although it has been modified to study different cases. Altogether, he is the founder of self-loosening experimental study. The finite element and analytical investigations from the following studies are discussed in the analytical and finite element sections, therefore, only the experimental test rigs are reviewed in this section.
Zhang et al. performed an experimental study using a hydraulic material testing system to evaluate the effect of the thickness of the mating parts and the applied load direction in an M12 bolted joint (Jiang et al., 2006). A load cell is used between the clamp part and the bolt head to measure axial load. It is important to note that the grip length is one of the two main factors studied in this research and that using a load cell to measure axial load changes the
grip length of the joint and deviates the results from realistic conditions (Figure 1-9). On the other hand, because joint stiffness is changed by the load cell, the axial force will be also affected. The investigated joint consists of two plates and two insert plates that serve to change the thickness of the mating parts. An extensometer is installed on the plates to measure the relative displacement between the two mating parts. Unfortunately the captured displacement does not include slippage or the relative displacement of the insert plates and nut/bolt. A rotation sensor is supported on the nut using a fixture in a way that the tip of the sensor touches the end of the bolt. The captured rotation is the exact relative rotation of the bolt and nut. The authors conclude that increasing clamp length and loading angle enhances self-loosening resistance. This research team used the same machine as (Jiang, Zhang, & Lee, 2003) to study the effect of preload and excitation.
Figure 1-9 Experimental Setup (Jiang et al., 2006)
Nassar and Housari developed the test setup demonstrated in
Figure 1-10 to study the effects of hole clearance and thread fit using a modified version of the Junker machine.
An electrical motor with a set of pulleys is used to supply the required displacement to the mobile plate using an eccentric mechanism. As in other studies, a load cell is used to measure the axial load of a ½ -13 bolt (equivalent of M14x2). A rotation sensor captures bolt head
18
rotation via a short belt that is connected to a mounted socket cap on the bolt head. Slippage between the belt and cap and the belt and sensor pulley can be a source of error for the rotation measurement. In the current study, the rotation sensor is connected to the bolt directly to avoid such a problem. The eccentric mechanism gives the capability to provide different excitation amplitudes. As previously discussed in section 1.2, the authors concluded that a tighter tolerance in both plate holes and threads increases self-loosening resistance (Nassar & Housari, 2007).
Figure 1-10 Test setup developed by Nassar & Housari (Nassar & Housari, 2007)
Zaki et al. used the same Junker machine to study self-loosening (A. M. Zaki et al., 2012). Lateral cyclic displacement is applied to the upper plate and a load cell is used to monitor preload changes in a ½ -13 bolt (equivalent of M14x2). The same machine is used by Zaki et al. to study the effect of thread pitch, excitation amplitude, and bearing friction (A. M. Zaki et al., 2011) and also to study the effects of thread and bearing friction (A. Zaki et al., 2010) on the self-loosening of countersunk bolts.
Eccles et al. modified the Junker machine (Figure 1-11) to be able to transmit axial load and transverse displacement simultaneously to study the effect of a prevailing torque nut in bolted joints (Eccles et al., 2010). A hydraulic jack is used to provide an independent regulated axial load. Excitation is applied to the upper plate which is in contact with the
lower mating plate via needle bearings to minimize friction between the two parts. A combination of an electric motor and an eccentric cam system is used in this design to generate and adjust the excitation displacement with the axial load of the bolt (M8) that is measured by a load cell. Unfortunately, the complicated joint design and the multiple inserted elements alter the experimental results from actual values. This special design is used to simulate the behaviour of a prevailing torque nut in bolted joints.
Sawa et al. designed a fixture based on the Junker machine to study the effects of the utilization of a double nut, spring plate washer, and hexagon nut with a flange on self-loosening (Sawa, Ishimura, & Nagao, 2012). They studied a joint fastened with an M10 bolt with a load cell inserted underneath the fixed plate. A dial gauge is supported on the far side of the fixed plate while its tip touches the end of the mobile part (Figure 1-12). As the installation point of the gauge is far from the joint centerline, measured values are affected by deformation of the part. Steel bars are used as bearings between the mating parts. Although they decrease the friction and lateral force, they change the grip length and joint stiffness. Valuable information could have been extracted from the test rig had a lateral force and a rotation sensors been incorporated. This machine is also used by Sawa et al. to study the effect of the mating parts inclined bearing surface (Sawa, Ishimura, & Karami, 2010).
20
Figure 1-12 section view of test machine (Sawa et al., 2012)
1.4 Finite Element
Zhang et al. performed a three-dimensional elastic-plastic finite element analysis to study the first stage of loosening (Jiang et al., 2003). As rotation is negligible in stage I of self-loosening, they did not consider it and used a symmetric model. The bolt and nut thread connection is modeled as a circumferential groove. These simplifications enhance the CPU performance but unfortunately affect considerably stress distribution on the threads. Local mesh refinement is applied in the first engaged thread with all thread contacts being frictionless, and only sticking behavior is modeled as a restrain with a high critical shear stress. Thermal expansion of the upper mating plate is used to simulate the preload in the bolt. They concluded that “the localized cyclic plastic deformation caused the stresses to redistribute in the bolt, and the result was the gradual loss of clamping force with loading cycles” (Jiang et al., 2003, p. 1). Their results show that lateral displacement is a determinant factor for the preload drop in the first stage of self-loosening whereas friction between the clamping parts does not play an important role.
Zhang et al. conducted another study in 2007 on the second stage of self-loosening using finite the element method (Zhang et al., 2007). Unlike their previous study, due to the importance of the relative rotation of the thread of the nut and bolt the helical geometry of the threads is considered. Because plastic deformation is not a dominant factor in stage II, only the elastic behavior of the material is considered. Due to deformation and displacement occurring in all directions, the researchers were forced to use a full 3D model to study the second stage of self-loosening. An isotropic frictional and infinitesimal-sliding contact is defined in the thread contacts. All other contacts are defined in the same way as the thread contacts with a different friction factor. The thermal expansion method is again used to simulate the preload of the bolt. The plate adjacent to the bolt is fixed and a transverse displacement is applied in four stages to the other mating plate. They concluded that “microslip between the engaged threads and the variation of the contact pressure were identified to be the major mechanisms responsible for the self-loosening of a bolted joint”. They also used a simplified FE model of the thread contact to prove their suggested mechanism (Figure 1-13).
Figure 1-13 Simplified model of thread’s contact (Zhang et al., 2007)
Sawa et al. conducted a FE analysis to study conventional methods (e.g. double nut, sprig plate washer and flanged nut) used to reduce the loosening of bolted joints (Sawa et al.,
22
2012). 8-noded hexahedral elements are used in the analysis with the penalty method for the contact behaviour of the thread contacts (male and female) and the nut and plate contact area. In this research study, just one plate is modeled and the effect of frictional contact between the bolt head and the two mating plates is neglected. All contacts are considered to have maximum possible realistic conditions. Preload is modeled using forced displacement in the axial direction of the bolt which is restrained in all other directions. Transverse displacement is applied to the plate which is constrained in all directions. They concluded that joints with a flanged nut have the highest rate of loosening and that a spring washer improves joint performance the most among the studied methods (Figure 1-14).
Figure 1-14 Finite element result of studied joints (Sawa et al., 2012)
Yang and Nassar conducted a study using the FE and analytical methods (Yang & Nassar, 2012). Material behaviour is considered as fully elastic and the frictional contacts are defined in the following connections: bolt to plate, plate to plate, nut to plate, and thread-to-thread. They used the preload feature of the ABAQUS software as in the current study to facilitate and accelerate preload modeling. One side of the lower plate is restrained in one direction and a triangular displacement excitation with time is applied to the opposite side of upper
plate. The FE model is not explained in detail nevertheless it was used to validate a proposed analytical equation to prevent self-loosening of bolted joints.
Sawa and Ishimura conducted a study to research the effect of inclined bearing surfaces and eccentric nuts on loosening, using the FE method (Sawa et al., 2010). Like in their previous research, only one plate is considered in the FE model and the contact between the bolt head and the two mating parts is neglected. 8-noded hexahedral elements are used in the analysis and the penalty method is used for contact behaviour, which is located at the thread contact area (male and female) and the nut and plate contact area. Contact between the convex surface of the lower nut and the concave surface of the upper nut is neither mentioned nor described. The tightening procedure and the inclined surface effect is explained as “After tightening the lower nut, the upper nut is tightened. At this time, a gap and continuously applied lateral clamping force which prevent loosening is occurring” (Sawa et al., 2010). Preload is modeled using a forced displacement in the axial direction of the bolt which is restrained in all directions. Transverse displacement is applied to one of the plates and it is constrained in the other directions. Figure 1-15 shows the described FE model. Different inclined plate angles of 0, 2, and 3 degrees are evaluated with this FE model.
Figure 1-15 FEA model of the eccentric nut (Sawa et al., 2010)
24
Material behaviour is considered as elasto-plastic. Sawa and Ishimura concluded that “the reduction in axial bolt force with large angle of the incline is larger than that with small angle of the incline” (Sawa et al., 2010).
Figure 1-16 Comparison of loosening in joints with hexagon and eccentric nut
(Sawa et al., 2010)
1.5 Objectives of the current study
The objective of the current study is to develop a test machine to study the effect of plate stiffness and thickness on self-loosening. As mentioned before, very little research has been conducted with experimentally representative test rig. One of the general targets defined in the beginning of the project was the improvement of the measurement systems to avoid problems and disadvantages that test machines used in previous researches suffered from. Reviewing papers and reports from different researchers gives us a good idea about the requirements and expectations of the target test rig. The final machine must be able to test a bolted joint with different plate thicknesses and materials. It should also be able to measure bolt preload, lateral load, lateral displacements, number of cycles, temperature, time, and nut rotation continuously while the real bolted joint geometry and stiffness is not altered. A finite
element analysis will be conducted to unsure that the design of feasible and that the measured parameters are realistic.
With the developed test rig, bolted joint behavior will be studied under different load cases and the experimental results will ultimately be compared with finite element and theoretical results. The results will be also compared with results from previous studies.
The specific objectives are:
1- Design a test fixture to be used with a tensile compression machine to study the self-loosening of bolted joints.
2- Design the clamping plates with variable thickness and bolts with variable length and their adaptors to be able to study the effect of assembly stiffness on the self-loosening.
3- Incorporate all necessary instrumentation to measure bolt load, transverse load, displacement, rotation, temperature, number of cycles and time.
4- Write an interface program in Labview to monitor and record the data in a computer through a data acquisition system.
Conduct preliminary testing of self-loosening of a bolted joint and compare the result using numerical FEM.
CHAPTER 2
EXPERIMENTAL TEST RIG
2.1 General description of the developed test rig
As discussed previously, the general and essential requirements for a self-loosening machine are providing cyclic lateral displacement and the ability to measure preload and the studied parameters. Development of a test rig to study the effect of stiffness and grip length is the ultimate objective of the test rig. The stiffness of a bolted joint is a function of the material and the geometry of the bolt, mating parts, washers, and nut. Any changes in the material of the mating parts only change the stiffness whereas changes to thickness change stiffness and clamping parts simultaneously. Hence, the machine should be designed to also be able to measure other parameters so that they can be compared to the parameters that are influenced by grip length. To do so, the target machine should be able to measure at least rotation, lateral force, lateral displacement, and the number of cycles.
The design is based on an existing fatigue machine as the source of power to minimize the time and cost of the project. The original machine includes the following parts (See Figure 2-1):
- Holding structure, - Electrical motor,
- Adjustable crank system,
- Basic control panel for start-stop and frequency adjustment, - Cycle mechanical counter with precision of 10 cycles, - Lever with three loading point and spring end fulcrum, - Mobile mounting structure,
- Grips and universal joint, - Adjustable stem.
The holding structure, electrical motor, lever, mobile mounting structure, and adjustable stem are unmodifiable. The adjustable crank system is repaired and the cycle counter is bypassed
28
and replaced by a magnetic digital counter. A basic control panel is connected to the designed control system and its outputs are transferred to the control and monitoring program. Speed control is directly connected to the electrical motor and the frequency can be adjusted manually.
Figure 2-1 Fatigue and endurance testing machine (Systems Integrators LLC, 2011)
The grips and universal joint section has been completely replaced with a new design that will be explained in next sections.
The lever of the test rig is essentially a “class 2 lever”. The displacement provided by the electrical motor and crank system is applied to one end of the lever to produce the load and the test specimens can be installed between the universal joint and the load cell. According to work and energy law, with a certain amount of effort, the maximum load can be reached with the lowest displacement; hence, the closest point to the fulcrum point of the machine is used to install the test specimens in order to have the highest load capacity. The developed test rig is able to apply a lateral displacement from zero to 0.25 (inches) with a maximum frequency of 5000 cycles per minute. The maximum lateral force is 2000 lbs, which is a function of lateral displacement and stiffness of the joint in the lateral direction.
Instrumentation has been centralized via a PCB that is used as the main board to connect all of the measuring devices to a computer. (See Figure 2-2)
30
The control program is written in Lab View (Laboratory Virtual Instrument Engineering Workbench). This control and monitoring program can continuously display and record lateral displacement, lateral force, axial force, rotation, number of cycles, time and temperature. For safety reasons, the machine can be switched off via software or the control panel on the machine, but it can only be switched on from the control panel.
2.2 Requirements and limitations
Like in all experimental researches, measuring essential variables is the basic requirement of a test rig. Axial force, displacement, and rotation are the essential variables for the self-loosening test. Besides precision and measurement range being crucial factors for sensor selection, compatibility with the control system and measurement devices can be a limiting factor. Finding a feasible combination of available sensors is a challenge in the design of the measurement and control step.
The ability to test different plate thicknesses and bolt sizes is one of the desired specifications of the final test machine, which is limited by machine capacity. Increasing bolt size requires a higher transverse load to reach the same lateral to axial force ratio at the same bolt tightening stress ratio. Matching measurement accessories with different diameters and thicknesses limits the machine design with regards to feasibility, cost, and fabrication equipment. Limitations and their applied solutions are discussed in detail in each section.
In order to have realistic results, the joint geometry has to be kept, as much as possible, in conditions close to industrial applications. This requirement renders many measurement methods and devices ineffectual. As mentioned in the previous chapter, using a load cell to measure axial load affects grip length and joint stiffness directly and creates significant changes in the results when studying joint stiffness. In the current study, the bolted joint is subjected to transverse load conditions, hence, the test rig has to be designed to avoid undesirable loads, such as bending while keeping pure transverse excitation.
When the stiffness of the joint is the subject of a study, it is very important to minimize the modifications made to the parts. Any excessive weakening or reinforcement will affect the properties of the joint and the test results. To meet this requirement, the coaxiality of the plates (mating parts), the fixed point, and the excitation point are considered as determinant factors. These geometrical restraints must be respected in all design modes (different plate thicknesses and their combinations).
The instrumentation fixtures, the maximum capacity of machine, the possibility of performing tests with different frequencies, and the above mentioned geometrical restraints form the major challenges for the design of the grips.
The test rig must be designed and fabricated in such a way that all load cases can be performed safely to both protect the operator and to insure the durability and performance of the machine. The applied safety provisions in the design and programing are as below:
- “General force limit”; Because the maximum force capacity of the machine is defined in the manufacturer manual as 8000 lbs, the program is set to terminate the test if the lateral force is higher than 7000 lbs.
- “Adjustable force limit”; In each test, a value smaller than “General force limit”, which is dependent on the load case condition, can be set in the interface panel to terminate the test.
- “Number of cycles limit”; an adjustable limit can be set for each test in the interface panel.
- “Mechanical cycle counter limit”; the count down cycle counter can be set to a value close to the limit entered in interface panel as a backup safety parameter in case of a program malfunction or error.
- “Excitation amplitude limit”; this can be set for each test in the interface panel to control the displacement.
As with all other projects, the available fabrication equipment should be considered in the feasibility of the design to minimize the budget.
32
2.3 Preload sensor
Preload keeps the mating parts together and decreases in preload can lead to serious problems, such as structural integrity and leakage failures; hence, the integrity of a bolted joint is usually assessed by its capacity to maintain the bolt axial load.
The objective of all research on self-loosening is to evaluate and quantify the effects of different parameters that prevent self-loosening or to estimate the number of cycles before self-loosening occurs in order to help create a safe and effective maintenance program. Hence, finding an accurate measurement method that matches the whole design and causes the least possible deviation from the actual joint properties (standard industrial set up) is one of the most important points of the design.
Figure 2-4 Grip length after inserting load cell
As mentioned above, in most previous studies researchers used load cells to measure preload. The advantages of using a load cell are easy replacement, maintenance, and set-up. However, the biggest disadvantage of this is a significant change in the geometry of the joint. To measure preload, a load cell must be inserted between the bolt head and plate or between the nut and plate. In doing so changes the grip length and stiffness of the joint. (See
Figure 2-3).
Grip length is a dominant parameter for both bending moment and stiffness. Yang et al. have shown that a reduction of bending stiffness of the bolt, which is inversely proportional to length, increases resistance to self-loosening. (Yang et al., 2010)
Total joint stiffness before inserting load cell is (Adapted from Budynas & Nisbett, 2008, page 413):
= + + + + + (2-1)
and after inserting load cell will be:
= + + + + + + (2-2)
34
= (2-4)
Where , , and are section areas of the unthreaded portion, section areas of the threaded portion, effective threaded length, and length of the unthreaded portion, respectively. Therefore, adding a load cell to the joint changes joint stiffness directly by adding stiffness to the system and changing bolt stiffness.
Accordingly, when the effect of self-loosening is the objective of the study, using a load cell is not an acceptable method for preload measurement.
To resolve this problem in the current study, a strain gauge that can be installed in the bolt is used as the preload sensor to keep the grip length and bolt’s stiffness unchanged. As shown in Figure 2-5, a KYOWA KFG-3-120-C20-11 strain gauge with a cylindrical shape is specifically designed and fabricated to measure bolt strain.
Figure 2-5 Strain gage (KYOWA Catalog,
See APPENDIX I)
A 2mm diameter hole in the bolt is required to install this gauge (KYOWA Catalog, See APPENDIX I, Strain gage catalog, KYOWA). To compare the stiffness of the bolt before and after installation of the gauge, a simplified calculation for a cylinder with an equal diameter to the bolt is presented below.
Figure 2-6 Cylinder with and without hole
= , ′ = → = = = = 0.97
Even if the hole is considered as a thru-hole, it can only change the stiffness of the bolt by about 3%. In order to measure the force more accurately, the strain gauge should be installed as far as possible from the bolt head and nut. Therefore, it has been installed at a depth equal to the average distance of the plate contact surface (14mm from bolt head, see Figure 2-7). The actual length of the hole is about 25mm. As a result, the change in the stiffness of the bolt will be much less than 3% in real conditions for an M12 bolt, which is quite acceptable.
Figure 2-7 Preload sensor position in the bolt
The strain gauge is installed according to the manufacturer manual, using epoxy glue. To make sure that the strain gauge returns correct values, it must be coaxial with the bolt.
36
Increasing this gap will lead to have an excessive thickness of the glue film and can increase the possible inclination angle (see Figure 2-8).
An automatic CNC machine was used to drill the bolts to achieve a 0.1 mm tolerance. The maximum possible inclination for this sensor will be 0.5°, which is completely negligible.
Figure 2-8 Effect of tolerance on inclination angle
Max inclination angle = = . 0.5
Essentially, a strain gauge is a sensitive electrical resistor inserted into a very thin, flexible, conductive sheet. Usually, the resistor portion is called the grip or coil. The non-conductive sheet is attached to the surface of the object using a suitable adhesive (depending on base material). As the object deforms, it moves the coil and changes its electrical resistance. These changes are translated to strain values using a constant value called “gauge factor”. When the adhesive film between strain gage and the object surface is too thick, the measured data is a combination of object strain and shear deformation of the adhesive layer. Hence, it is very important that the layer between the gauge and object surface be as thin as possible. For the strain gauge used in the current design, the hole tolerance affects the glue