Journal of Fundamental and Applied Sciences is licensed under a Creative Commons Attribution-NonCommercial 4.0 International License. Libraries Resource Directory. We are listed under Research Associations category.
KRIGING METHOD OF STUDY OF THE GROUNDWATER QUALITY USED FOR IRRIGATION - CASE OF WADI DJENDJEN PLAIN (NORTH-EAST ALGERIA)
A. Boufekane* and O. Saighi
Department of Geology, Faculty of Earth Sciences and Country Planning, University of Sciences and Technology Houari Boumediene, Algiers, Algeria
Received: 28 December 2015 / Accepted: 02 April 2016 / Published online: 01 May 2016
ABSTRACT
The groundwater of wadi Djendjen plain (Jijel, North-East Algeria) have always been used as drinking water supply in the cities and the irrigation of agricultural lands. This confers this aquifer, which has already been the subject of numerous hydrogeological studies, a particular interest in terms of qualitative and quantitative monitoring. Its exploitation is today encountering excessive salinity problems, evidenced by measurements of the electrical conductivity of the water and the alkalinisation of soils. This degradation of the environment results, among others, from ion exchange which involves cations (sodium, calcium and magnesium), water / clay interaction as reflected by the sodium absorption ratio (SAR). Analyses on samples of groundwater destined for irrigation and the application of a geostatistical approach have enabled to map the most affected zones by this phenomenon.
Keywords: groundwater; quality; irrigation; geostatistical analysis; kriging.
Author Correspondence, e-mail: boufekane_ab@yahoo.fr doi: http://dx.doi.org/10.4314/jfas.v8i2.12
1. INTRODUCTION
The irrigated agriculture is today facing new challenges such as the risk of salinity that can be appreciated by the electrical conductivity and alkalinization of the soils.
The main water resources for irrigation of wadi Djendjen plain consist of groundwater storages. Groundwater samples for irrigation were analyzed as well as the application of
ISSN 1112-9867
geostatistical approach on these analyzed water points were used to select favourable areas for the implementation of water points for the irrigation in accordance with international standards.
Geoscientists often face interpolation and estimation problems when analyzing sparse data from field observations. Geostatistics is an invaluable tool that can be used to characterize spatial or temporal phenomena [1] [2].
Geostatistics originated from the mining and petroleum industries, starting with the work by Danie Krige in the 1950's and was further developed by Georges Matheron in the 1960's [3]. Geostatistics has since been extended to many other fields in or related to the earth sciences, hydrogeology, hydrology, meteorology, oceanography, geochemistry, geography, soil sciences, forestry, and landscape ecology. In this class, both fundamental development of geostatistics and simple, practical applications in the earth sciences will be presented [4]. Advantage of geostatistics is the use of quantitative measures of spatial correlation, commonly expressed by variograms (Diodato and Ceccarelli 2005) [5]. The semivariogram is a fundamental tool in geostatistics [6].
The main objective of this work is to make a statement on the current state of the chemical quality of water used for irrigation in the wadi Djendjen plain (Jijel, North-East Algeria) and its risks by using the geostatisticalapproach.
2. MATERIALS AND METHODS 2.1. Presentation of the study area
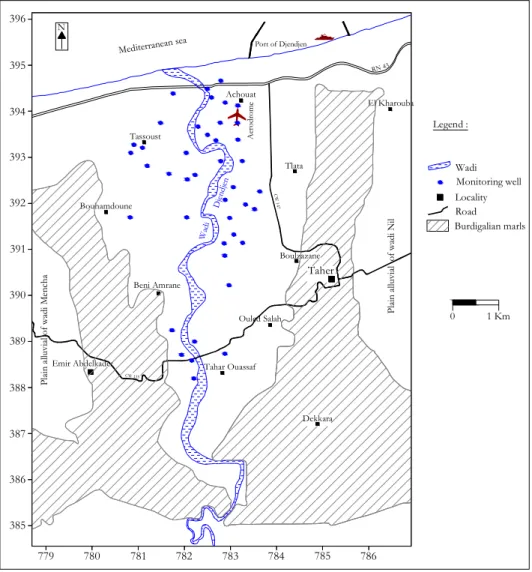
The studied area is located in the north-east of Algeria (Fig. 1). It is an agricultural and industrial oriented region. It covers an area of 58 km2 and opens to the north of the Mediterranean Sea. It corresponds to the upstream part of wadi Djendjen and its tributaries which contribute to the groundwater recharge.
Fig.1. Location of the study area
The coastal location of this plain gives it a mild and damp climate. Between the winter and summer, the monthly median values of temperatures vary from 11°C to 25°C (the average air temperature is 17°C/year), relative humidity from 70% to 75% and the evaporation from 41 mm to 80 mm. The rainfall, relatively high, reaches 900 mm/year [7].
The geological substratum of the area consists of gneiss and schists. However, sedimentary formations mainly marly Miocene age and Pliocene cover these metamorphic facies. Finally, the depressions and valleys are filled with quaternary alluvial deposits which are interesting terraces aquifers. The groundwater recharge is mainly controlled by infiltration of rainfall and the low water situation by the wadi Djendjen (Fig. 2). The aquifer permits the socioeconomic development of the region by the exploitation of the domestic and irrigation wells or boreholes (25 millions m3/year) [8].
Mediterranean se a Port of Djendjen Boulzazane Achouat Tassoust Bouhamdoune Tlata Emir Abdelkader P la in a llu vi al o f w ad i M en ch a P la in a llu vi al o f w ad i N il RN 43 CW 135 C W 1 47 El Kharouba Beni Amrane Ouled Salah Tahar Ouassaf Dekkara Wad i Dje ndj en 396 395 394 393 392 391 390 389 388 387 386 385 779 780 781 782 783 784 785 786 Taher 0 1 Km 4 8 12 16 20 24 28 A er o d ro m e N Legend : Wadi Locality Road Burdigalian marls 4 Piezometric level Direction of flow
Fig.2. Piezometric map in wadi Djendjen plain (May 2012)
2.2. Creation of the database
Determination of physic-chemical characteristics of water is essential of assessing the suitability of water for various purposes like drinking, industrial and agriculture [9].
The analyzed samples are taken from boreholes and wells whose data are collected from the National Agency Hydraulic Resources. The analyzed data correspond to the May 2012 campaign and come from 42 monitoring points (Fig. 3).
Mediterranean se a Port of Djendjen Boulzazane Achouat Tassoust Bouhamdoune Tlata Emir Abdelkader P la in a llu v ia l o f w ad i M en ch a P la in a llu vi al o f w ad i N il RN 43 CW 135 C W 1 47 El Kharouba Beni Amrane Ouled Salah Tahar Ouassaf Dekkara Wad i Dje nd jen 396 395 394 393 392 391 390 389 388 387 386 385 779 780 781 782 783 784 785 786 Taher 0 1 Km A er o d ro m e N Legend : Wadi Locality Road Burdigalian marls Monitoring well
Fig.3. Location of groundwater monitoring well
The targeted parameters in this study are the Electrical Conductivity (EC), the Sodium Adsorption Ratio (SAR) and the Todd Ratio.
EC depends on water mineralization and reflects the overall content of dissolved salts. Generally, the values are reduced to 25 °C. For agricultural uses little water causes problems beyond 0.750 m.mhos/cm.
Table 1. Classification of irrigation water quality based on Electrical Conductivity (EC)
EC (m.mhos/cm) Salinity hazard
0.10-0.25 Low
0.25-0.75 Medium
0.75-2.25 High
>2.25 Very High
exchange which is a very interesting example because it plays an important role in the stability of clay soils irrigated by ion exchange. SAR report was proposed by Richard (1954) to classify the irrigation water according to the following formula [10]:
(1)
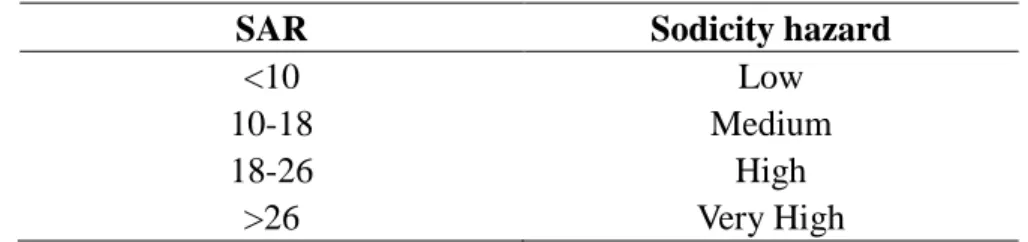
Table 2. Classification of irrigation water quality based on Sodium Absorption Ratio (SAR)
SAR Sodicity hazard
<10 Low
10-18 Medium
18-26 High
>26 Very High
In the downstream of wadi Djendjen plain, the soft water aquifer comes into contact with the marine area. The proximity to the sea makes the groundwater’s exploitation very delicate. According to Todd, the report proposed by Revelle (1941) is a marine invasion indicator [11]. Higher values of this report reflect the contamination by seawater. In an attempt to circumscribe the problem of salty bevel, we relied on the report. It is obtained by the formula:
(2)
Table 3. Classification of water quality based on Todd Ratio
Todd Salinity hazard
0.5-1.3 Low
1.3-2.8 Medium
2.8-6.6 High
6.6-15.5 Very High
Note:
1- The first two parameters are very important for the classification of water used for irrigation. The three parameters are calculated in order to judge the degree of contamination by sea water (salinity) at the coastal aquifer.
2- The electrical conductivity (EC) was measured on the site during the sampling collection. In the laboratory, water samples have been analyzed for the main anions and cations such as Na+, Ca++, Mg++, K+, Cl-, SO4--, NO3- and HCO3-.
2.3. Geostatistics
one of the most important tools for quantifying spatial correlation between data points. Variogram is actually the variance of data values in two points separated by h distance from each other. In general, the purpose of calculating the variable mode is to estimate changes in variables with respect to temporal and spatial variations. To calculate this variability, the total squared difference between pairs a distance h from each other is determined and plotted against h, in a semivariogram, as given in equation (3) [13].
(3) Where:
h: denotes the distance (lag) between pairs of sampling points. Var: is the variance.
Z(x): is the observed value of one parameter at point xi. Z(x+h): is the value of parameter at point xi+h.
The variogram is a quantitative descriptive statistics that can be graphically represented in a manner which characterizes the spatial continuity (i.e. roughness) of a data set. In order to interpolate with different methods, a theoretical model must be fitted to the experimental data of the semivariogram. By fitting a theoretical model to the value of the empirical model and by applying linear and nonlinear models, unknown variables can be estimated [13].
After calculating experimental (cross) semivariogram, a theoretical model should be fitted to the experimental data. The most common semivariogram models are spherical, exponential, linear and gaussian models [6].
In this study, two types of models (gaussian and spherical) were used to determine the best model variable mode. Gaussian and spherical models are expressed as following [14]:
Spherical model (4)
Gaussian model (5)
Where:
C0: is the nugget effect.
a: is the range of influence.
After fitting the model, (cross) semivarigram characteristics will be used in kriging system of equations in order to interpolate the desired variable.
2.4. Ordinary Kriging
Ordinary Kriging is an unbiased linear method which is based on the logic of a moving average (Krige 1978, Delhomme 1978, Webster and Oliver 2001) [15].
The most obvious advantage of Kriging algorithm is to calculate the error associated with each estimate.
In this method, the results should be unbiased weighting coefficients which are determined so that their sum is one (Eq. 6). In normal Kriging the average value is unknown but is independent of the coordinates. The Kriging estimator satisfies the following conditions [15]:
(6) Where:
λi: is the Kriging weight.
Z*: is an estimator of unknown true value of Z(x0).
2.5. Cokriging
In cokriging (COK) one or more secondary variables, which are correlated with the main variable are used for the interpolation. It is supposed that these secondary variables can improve the accuracy of the estimation. COK estimator is defined as [12]:
(7) Where:
and : are the weights assigned to the known values of the primary and secondary variables Z and S, respectively.
n and m : are the number of primary and secondary observations.
The weights are determined through COK system of equations similar to OK [12].
2.6. Comparison of interpolation methods
A cross-validation approach is used to assess the performance of OK and COK. The comparison criteria used are mean bias error (MBE), root mean square error (RMSE) and determination coefficient (R2). Mathematical formula for MBE and RMSE are given as [14]:
(8) (9) Where:
Z*(xi) and z(xi) are the estimated and observed values at location xi, respectively.
N: is the number of observations. For an appropriate estimator, MBE should be close to zero. R2 should be close to 1 and RMSE should be as small as possible.
3. RESULTS AND DISCUSSION 3.1. A statistical analysis
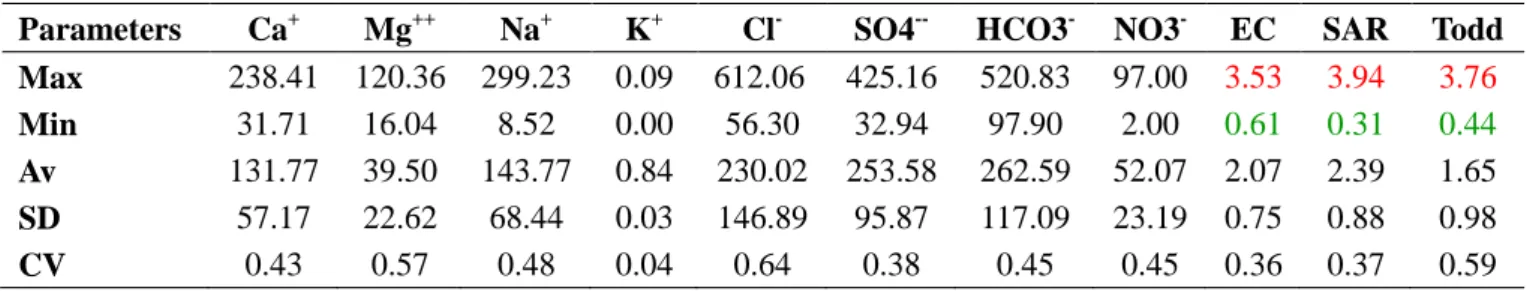
The elementary statistical analysis of 42 analyzed water points of wadi Djendjen plain is summarized in the table below.
For groundwater of wadi Djendjen plain:
- The EC values vary between 0.61 m.mhos / cm and 3.53 m.mhos / cm. - The SAR varies between 0.31 and 3.94.
- Todd report varies between 0.44 and 3.76.
Table 4. Basic Statistics of the chemical elements
Parameters Ca+ Mg++ Na+ K+ Cl- SO4-- HCO3- NO3- EC SAR Todd Max 238.41 120.36 299.23 0.09 612.06 425.16 520.83 97.00 3.53 3.94 3.76 Min 31.71 16.04 8.52 0.00 56.30 32.94 97.90 2.00 0.61 0.31 0.44 Av 131.77 39.50 143.77 0.84 230.02 253.58 262.59 52.07 2.07 2.39 1.65 SD 57.17 22.62 68.44 0.03 146.89 95.87 117.09 23.19 0.75 0.88 0.98 CV 0.43 0.57 0.48 0.04 0.64 0.38 0.45 0.45 0.36 0.37 0.59
Max: maximum ; Min: Minimal ; Av: average ; SD: standard deviation ; CV: Coefficient of variation 3.2. Modelling and Validation
In this study, the regionalized variables are electrical conductivity (EC), the sodium adsorption ratio (SAR) and Todd Ratio. The geostatistical study consists of two main phases: - Characterization of the spatial structure of the regionalised variability.
- The estimation of this variable by using an interpolation tool.
3.2.1. Modelling variograms
The EC surface variogram of the groundwaters (Fig. 4) presents an isotropic around the 45° direction. This value of isotropy will be considered for the experimental variogram. The adjusted model is gaussian. The equation of the variogram is:
γ (h) = 0.02 + 0.60gaus 2.40 (h) and its range is 2.4 km.
The validation is given by the IGF index (Indicative Goodness Fit). It gives a value of 0.087, it indicates the proper adjustment (it is close to the value 0).
Fig.4. Surface variogram and adjusted variogram of the EC
- SAR Variography
SAR surface variogram of the groundwater (Fig. 5) provides an isotropic around the 45° direction. This value of isotropy will be considered for the experimental variogram. The adjusted model is of spherical type. The equation of the variogram is:
γ (h) = 0.11 + 0.80sph 2.40 (h) and its range is 2.40 km.
The index (IGF) shows a value of 0.023 (the validation test is accepted for this adjustment).
Fig.5. Surface variogram and adjusted variogram of the SAR - Todd Variography
The Todd ration surface variogram of groundwater (Figure 6) gives an isotropy around the direction 65°. This value of isotropy will be considered for the experimental variogram. The adjusted model is of linear type. The equation of the variogram is:
γ (h) = 0.08 + 1,15sph 2.40 (h) and its range is 2.40 km.
The index (IGF) shows a value of 0.091 (the validation test is accepted for this adjustment).
Fig.6. Surface variogram and adjusted variogram of the Tood ratio
3.2.2. Kriging
- Spatial prediction of groundwater quality parameters
In this study COK is used to produce the maps of the spatial distribution of EC, SAR and Todd Ration. Afterwards sampling point layer is superposed on the classification layer and expected values are compared with observed values. The results show that expected and observed values are highly correlated.
- Map of the Electrical Conductivity
The spatial variation of the EC (Fig. 7) allows to distinguish increase of contents of the plain from South to northward. Values are above 2.50 m.mhos / cm, across the littoral band and reach on the seafront values above 3.50 m.mohs / cm (advancement of the seawater). We observe that in some areas (such as the southeast and southwest area), the value of the EC increases with increasing amounts of sulfate and bicarbonate. In the rest of the plain, the values range between 0.61 and 2.43 m.mhos / cm. in the rest of the plain, the values range between 0.61 and 2.43 m.mhos / cm.
Mediterranean se a Port of Djendjen Emir Abdelkader W ad i M en ch a p la in W ad i N il p la in El Kharouba Dekkara 396 395 394 393 392 391 390 389 388 387 386 385 779 780 781 782 783 784 785 786 Taher 0 1 Km N Legend : < 0.75 EC (m.mohs/cm) 0.75 - 1.50 1.50 - 2.50 2.50 - 3.50 > 3.50 Wad i Dje nd jen Boulzazane Achouat Tassoust Bouhamdoune Tlata Beni Amrane Tahar Ouassaf A er o d ro m e Wadi Locality Burdigalian marls Monitoring well
Fig.7. The spatial variation of EC using Co-Kriging method
- Map of the SAR
SAR values in the area of study (Fig. 8) range from 0.31 to 3.94 EPM. All the examined water points on the left bank of the wadi Djendjen belong to the category of C3S1 class, indicates a fairly good way typed at the water that can be used for irrigation [12]. The analyzed water points, located in the category of C4S1 class indicate a very high salinity threat, are in the northern part (position near the sea) and the east area of the plain. This is due to the strong mineralization of its water, which is the result, on one hand, of leaching of the land and, on the other hand, the anthropic contamination (the agglomerations discharges with a lack of
sewage system) and marine invasion. Mediterranean s ea Port of Djendjen Emir Abdelkader El Kharouba Dekkara 396 395 394 393 392 391 390 389 388 387 386 385 779 780 781 782 783 784 785 786 Taher 0 1 Km N Legend : Wadi Locality Burdigalian marls Monitoring well < 1.00 SAR (EPM) 1.00 - 2.50 2.50 - 3.50 > 3.50 Wad i Dje ndje n Boulzazane Achouat Tassoust Bouhamdoune Tlata Beni Amrane Tahar Ouassaf A er o d rom e W ad i M en ch a p la in W ad i N il p la in
Fig.8. The spatial variation of SAR using Co-Kriging method
- Map of Todd Ratio
The spatial variation of the Todd Ratio (Fig. 9) shows that the high concentration zone is noted close to the sea water (coastline). The excessive concentrations levels of chlorine confer to the water an unfit character for human use. The remaining water from the aquifer is generally characterized by a slight contamination. Todd ratio values of the study area ranged from 0.44 to 3.76.
Mediterranean se a Port of Djendjen Emir Abdelkader El Kharouba Dekkara 396 395 394 393 392 391 390 389 388 387 386 385 779 780 781 782 783 784 785 786 Taher 0 1 Km N Legend : 1,50 < 0.50 Todd 0.50 - 1.50 1.50 - 3.00 > 3.00 Wad i Dje ndj en Boulzazane Achouat Tassoust Bouhamdoune Tlata Beni Amrane Tahar Ouassaf A er o d ro m e W ad i M en ch a p la in W ad i N il p la in Wadi Locality Burdigalian marls Monitoring well
Fig.9. The spatial variation of Todd ratio using Co-Kriging method
4. CONCLUSION
This present work on wadi Djendjen plain (Jijel, North-East Algeria) is to determine the waters suitable for irrigation. It was achieved through the use and synthesizing of a considerable amount of hydro climatic data, geological, hydrogeological, pedological or other ..., in our study area to coordinate them better in order to understand the phenomenon of salinity and propose later conceptual solutions. The results of groundwater analysis and the modelling emphasize:
The effects of salinity on the water quality.
The impact of "pumping" in the downstream area on the progress of the salty bevel. Distribution of geologic facies aquifer formations and recharge areas.
Misuse of fertilizers in agriculture (nitrates).
For a better management of this aquifer and to minimize these effects, it is necessary to: Control the exploitation flows and groundwater levels.
The implementation of a policy to protect vulnerable areas. Prohibit the establishment of coastal drilling.
Further hydrochemical studies should be carried out to investigate the impacts of land use and anthropogenic activities on groundwater quality in the study area. Factors influencing the groundwater quality should be addressed as early as possible and kept as minimum as possible [16].
Finally, future investigations of the groundwater quality in the study area would benefit by the improvement in hydrogeological and hydrochemical data monitoring.
5. ACKNOWLEDGEMENTS
The authors are grateful to the authorities of Jijel for providing data and permitting to pursue and publish the present work.
6. REFERENCES
[1] Ahmadi SH and Sedghamiz A. Geostatistical analysis of spatial and temporal variations of groundwater level. Environ. Monit. Assess., 2007, 129: 277–294.
[2] Cay T and Uyan M. 2009). Spatial and Temporal Groundwater Level Variation Geostatistical Modeling in the City of Konya, Turkey. Water Research., 2009, 81(12): 2460–2470.
[3] Lambrakis N, Antonakos A and Panagopoulos G. The Use of Multicomponent Statistical Analysis in Hydrogeological Environmental Research. Water Research., 2004, 38: 1862–1872.
Groundwater Quality with Geostatistics, Case Study: Yazd-Ardakan Plain. World Applied Sciences Journal., 2008, 4(1): 9–17.
[5] Feng-Guang Y, Shu-You C, Xing-Nian L and Ke-Jun Y. Design of Groundwater Level Monitoring Network with Ordinary Kriging. Journal of Hydrodynamics., 2008, 20, 339–346. [6] Delay F and Marsily G. The integral of the semivariogram: A powerful method for adjusting the semivariogram in geo- statistics. Math. Geol., 1994, 26: 301–321.
[7] Boufekane A and Saighi O. Assessment of groundwater pollution by nitrates using intrinsic vulnerability methods: A case study of the Nil valley groundwater (Jijel, North-East Algeria). African Journal of Environmental Science and Technology., 2013, 7: 949–960. [8] Boufekane A and Saighi O. Effect of Recharge and Irrigation on the Variation of Nitrate in the Groundwater of Wadi Djendjen (Jijel, North-East Algeria). Journal of Water Resource and Protection., 2013, 5: 972–977.
[9] Shroff P and Vashi RT. Seasonal variations in groundwater quality of valsad district of south Gujarat (india). Journal of Fundamental and Applied Sciences., 2015, 7(2): 163–168. [10] Shroff P and Vashi RT, Champaneri VA and Patel KK. Correlation study among water quality parameters of valsad district of south Gujarat (india). Journal of Fundamental and Applied Sciences., 2015, 7(3): 340–349.
[11] Cemek B, Guler M and Arslan H (2006). Determination of salinity distribution using GIS in Bafra plain right land irrigated area. Ataturk University, Journal of Agricultural Faculty., 2006, 37(1): 63–72.
[12] Goovaerts P. Geostatistical Approaches for Incorporating Elevation into the Spatial Interpolation of Rainfall. Journal of Hydrology., 2000, 228: 113–129.
[13] Theodossiou N and Latinopoulos P. (2006). Evaluation and optimization of groundwater observation networks using the kriging methodology. Environmental Modelling and Software., 2006, 21: 991–1000.
[14] Barca E, Passarella G. Spatial evaluation of the risk of groundwater quality degradation. A comparison between disjunctive kriging and geostatistical simulation, Environ. Monit. Assess., 2008, 137: 261–273.
[15] Amini M and Khadi H. Comparison of kriging and co-kriging methods for estimating Cl- concentration of soil. Iranian Journal of Agricultural Science., 2002, 33(4): 741–748.
[16] Arslan H, Guler M, Cemek B and Demir Y. Assessment of groundwater quality in Bafra plain for irrigation. Journal of Tekirdag Agricultural Faculty., 2007, 4(2): 219–226.
How to cite this article:
Boufekane A, Saighi O. Kriging method of study of the groundwater quality used for irrigation - Case of wadi Djendjen plain (north-east Algeria). J. Fundam. Appl. Sci., 2016,