HAL Id: hal-03109220
https://hal.archives-ouvertes.fr/hal-03109220
Submitted on 2 Feb 2021
HAL is a multi-disciplinary open access
archive for the deposit and dissemination of
sci-entific research documents, whether they are
pub-lished or not. The documents may come from
teaching and research institutions in France or
abroad, or from public or private research centers.
L’archive ouverte pluridisciplinaire HAL, est
destinée au dépôt et à la diffusion de documents
scientifiques de niveau recherche, publiés ou non,
émanant des établissements d’enseignement et de
recherche français ou étrangers, des laboratoires
publics ou privés.
models: Implications for climatic mitigation
Akihiko Ito, Tomohiro Hajima, David M. Lawrence, Victor Brovkin, Christine
Delire, Bertrand Guenet, Chris D. Jones, Sergey L. Malyshev, Stefano
Materia, Sonali Shukla Mcdermid, et al.
To cite this version:
Akihiko Ito, Tomohiro Hajima, David M. Lawrence, Victor Brovkin, Christine Delire, et al.. Soil
car-bon sequestration simulated in CMIP6-LUMIP models: Implications for climatic mitigation.
Environ-mental Research Letters, IOP Publishing, 2020, 15 (12), �10.1088/1748-9326/abc912�. �hal-03109220�
Soil carbon sequestration simulated in CMIP6-LUMIP models:
implications for climatic mitigation
To cite this article: Akihiko Ito et al 2020 Environ. Res. Lett. 15 124061
View the article online for updates and enhancements.
Environmental Research Letters
OPEN ACCESS RECEIVED 20 August 2020 REVISED 23 October 2020 ACCEPTED FOR PUBLICATION 10 November 2020 PUBLISHED 15 December 2020 Original content from this work may be used under the terms of theCreative Commons Attribution 4.0 licence. Any further distribution of this work must maintain attribution to the author(s) and the title of the work, journal citation and DOI.
LETTER
Soil carbon sequestration simulated in CMIP6-LUMIP models:
implications for climatic mitigation
Akihiko Ito1,2 , Tomohiro Hajima2 , David M Lawrence3 , Victor Brovkin4,5 , Christine Delire6 , Bertrand Guenet7 , Chris D Jones8 , Sergey Malyshev9 , Stefano Materia10 , Sonali P McDermid11 , Daniele Peano10 , Julia Pongratz4,12 , Eddy Robertson8 , Elena Shevliakova9 , Nicolas Vuichard13 , David Wårlind14 , Andy Wiltshire8
and Tilo Ziehn15
1 National Institute for Environmental Studies, Tsukuba, Japan
2 Japan Agency for Marine-Earth Science and Technology, Yokohama, Japan
3 Climate and Global Dynamics Laboratory, National Center for Atmospheric Research, Boulder, CO, United States of America 4 Max Planck Institute for Meteorology, Hamburg, Germany
5 Centrum für Erdsystemforschung und Nachhaltigkeit, Universität Hamburg, Hamburg, Germany 6 CNRM, Universit´e de Toulouse, M´et´eo-France, CNRS, Toulouse, France
7 Laboratoire de G´eologie de l’ENS, PSL Research University, UMR8538 du CNRS, 24 rue Lhomond, 75231, Paris cedex 05, France 8 Met Office Hadley Centre, Exeter, United Kingdom
9 NOAA, Geophysical Fluid Dynamics Laboratory, Princeton, NJ, United States of America
10 Climate Simulation and Prediction, Centro Euro-Mediterraneo sui Cambiamenti Climatici, Bologna 40127, Italy 11 New York University, New York, NY, United States of America
12 Ludwig-Maximilians-Universität Munich, Munich, Germany
13 Laboratoire des Sciences du Climat et de l’Environnement, LSCE/IPSL, CEA-CNRS-UVSQ, Universit´e Paris-Saclay, Gif-sur-Yvette,
France
14 Lund University, Lund, Sweden
15 Commonwealth Scientific and Industrial Research Organization, Melbourne, Australia
E-mail:[email protected]
Keywords: carbon sequestration, climate change, Earth system models, land-use change, soil organic carbon Supplementary material for this article is availableonline
Abstract
Land-use change affects both the quality and quantity of soil organic carbon (SOC) and leads to
changes in ecosystem functions such as productivity and environmental regulation. Future changes
in SOC are, however, highly uncertain owing to its heterogeneity and complexity. In this study, we
analyzed the outputs of simulations of SOC stock by Earth system models (ESMs), most of which
are participants in the Land-Use Model Intercomparison Project. Using a common protocol and
the same forcing data, the ESMs simulated SOC distribution patterns and their changes during
historical (1850–2014) and future (2015–2100) periods. Total SOC stock increased in many
simulations over the historical period (30
± 67 Pg C) and under future climate and land-use
conditions (48
± 32 Pg C for ssp126 and 49 ± 58 Pg C for ssp370). Land-use experiments indicated
that changes in SOC attributable to land-use scenarios were modest at the global scale, in
comparison with climatic and rising CO
2impacts, but they were notable in several regions. Future
net soil carbon sequestration rates estimated by the ESMs were roughly 0.4‰ yr
−1(0.6 Pg C yr
−1).
Although there were considerable inter-model differences, the rates are still remarkable in terms of
their potential for mitigation of global warming. The disparate results among ESMs imply that key
parameters that control processes such as SOC residence time need to be better constrained and
that more comprehensive representation of land management impacts on soils remain critical for
understanding the long-term potential of soils to sequester carbon.
1. Introduction
Soil is an essential resource for human sustainabil-ity that provides important ecosystem services such as
water purification, nutrient cycling, and disaster pre-vention (Keith et al 2016). Any change in the huge stock of soil organic carbon (SOC) under climate change or land-use change can lead to feedback in
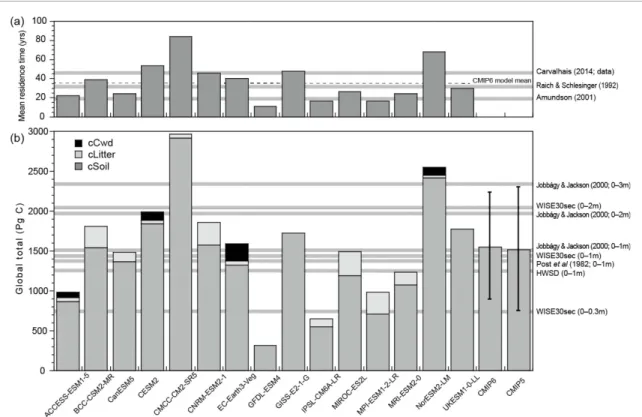
Figure 1. Comparison among CMIP land models of (a) estimated global mean residence times of SOC and (b) present global soil carbon pools, cSoil (if available), cLitter, and cCwd, in the 15 models in the 2000s simulated by the historical experiment (or by theland-hist experiment of CMCC-CM2-SR5). The mean CMIP6 and CMIP5 results (11 models, Todd-Brown et al2013) are shown at the right, and observational data are shown by the gray horizontal bars.
the climate–carbon cycle (Jones et al 2005, Bond-Lamberty and Thomson2010, Hugelius et al2014, Crowther et al2016). Land-use conversion can ser-iously affect SOC by modifying plant debris input and biophysical conditions at the soil surface (Smith
2008) and by enhancing horizontal soil displacement associated with wind and rainfall (Lal2003, van Oost
et al2007). The historical use of land for agriculture and human settlement has caused soil degradation in many regions, thereby threatening the sustainabil-ity of human society (Houghton1995, Pongratz et al
2010, Sanderman et al2017).
Through appropriate land management practices, profitable soil functions that contribute to a soil’s abil-ity to absorb carbon from the atmosphere can be conserved, utilized, and enhanced (Stockmann et al
2013, Paustian et al 2016, Govers et al 2017). Fuss
et al (2018) reviewed 22 studies on global soil car-bon sequestration and estimated that the technically feasible potential is, on average, 4.28 Gt CO2 yr−1
(1.17 Pg C yr−1), with a range of 2–5 Gt CO2 yr−1.
Recently, Bossio et al (2020) conducted a compre-hensive global analysis and obtained the remarkable value of 5.5 Gt CO2yr−1. The levels of SOC
sequest-ration imply that it can be a cost-effective option. The Food and Agriculture Organization has initi-ated a program to evaluate the global SOC sequest-ration potential (GSOCseq; Smith et al2020). At the 21st Conference of the Parties of the United Nation Framework Convention on Climate Change, held in
Paris in 2015, an ambitious mitigation initiative called the ‘4 per 1000 (4‰) Initiative’ was launched as a part of the Global Climate Action Agenda (Baveye
et al2017, Minasny et al2017, Soussana et al2019). This initiative set a goal of sequestering anthropo-genic carbon in world soils at a rate of 4‰ of total car-bon stock per year. Focusing on land areas where best management practices can be implemented, Minasny
et al (2017) estimated that a 4‰ increase in SOC stock in these areas would compensate for 20%–35% of current anthropogenic emissions, but to achieve this mitigation target scientific challenges and prac-tical barriers must be overcome (Amundson and Biardeau2018, Stockmann et al2013, Riahi et al2017, Yamagata et al2018).
Earth system models (ESMs), in which a biogeo-chemical carbon cycle scheme is coupled with phys-ical climate schemes, are widely used for climate stud-ies, including assessments of climate projections and mitigation options (Intergovernmental Panel on Cli-mate Change [IPCC] 2013). Following their early application to the assessment of climate–carbon cycle feedbacks (e.g. Cox et al 2000, Friedlingstein et al
2006), ESMs have been increasingly used for land-use change studies (e.g. Pongratz et al2010, Arora and Montenegro2011, Lawrence et al 2018). How-ever, ESMs have difficulties in replicating contempor-ary soil properties and dynamics (Todd-Brown et al
2013,2014, Luo et al 2016, Hashimoto et al2017). The objective of this study was to examine historical
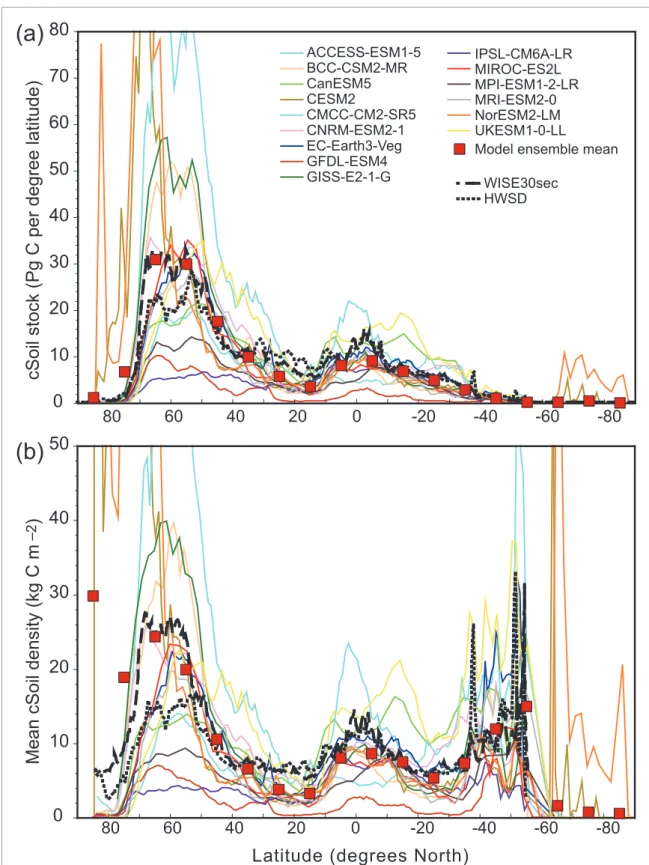
Figure 2. Latitudinal distributions of (a) carbon stocks in cSoil and (b) mean areal carbon density, simulated by CMIP6 ESMs in the 2000s. Distributions in the global soil datasets HWSD and WISE30sec (1 m soil depth) are included for comparison.
and future changes in the global SOC stock, mainly in the context of land-use change, as simulated by the ESMs being used for the IPCC Assessment Reports. The examination of the impacts of land-use change on global SOC stock in historical and future periods in this study is a first step in assessing the effectiveness of land management in climate change mitigation.
2. Methods
2.1. Land-use model intercomparison project data 2.1.1. Overview
This study analyzed output data from the
Land-Use Model Intercomparison Project (LUMIP)
intercomparison projects of the Coupled Model Intercomparison Project Phase 6 (CMIP6; Eyring
et al2016). As the metric of soil carbon stock, we used SOCtotal, which includes cSoil (CMIP variable
name for soil carbon density) and other soil carbon pools. LUMIP was designed to investigate specific issues related to land-use and land-cover changes, and it examines not only individual biogeophys-ical and biogeochembiogeophys-ical processes on land but also interactions and feedbacks among these processes (e.g. Boysen et al 2020, who describe an idealized deforestation experiment). ESMs were driven by data of the Land-Use Harmonization dataset (LUH2, Hurtt et al 2020, Ma et al 2020), which includes global gridded timeseries of historical and projected land-cover and land-use changes. Several example maps are shown in figure S1 (available online at
stacks.iop.org/ERL/15/124061/mmedia).
This study used output data from 15 ESMs (table1), in which land surface processes are simu-lated by specific sub-models. Note that CESM2 and NorESM2-LM share the same land model, CLM5. The land sub-models of the ESMs have similar bio-physical schemes (Sellers et al1997) but differ greatly in their parameterizations of land-use change and management, such as crop and wood harvesting, pas-ture management, and fertilizer and irrigation inputs to croplands. Several of the sub-models consider gross land-use changes (i.e. concurrent, bidirectional trans-formations between forest and cropland within a grid cell), whereas others consider only net land-use changes. In general, the representation of gross trans-itions is known to substantially increase carbon losses to the atmosphere (Stocker et al2014).
2.1.2. Target variables and metrics
The global total soil carbon stock was calculated by summing grid-mean soil carbon density (cSoil) weighted by grid area land fraction. By definition, cSoil represents the carbon mass in the full depth of the soil model and corresponds to both mineral soil and humus in soil surveys. Note, however, that dif-ferent models use difdif-ferent soil depths. Several mod-els also showed anomalously high carbon stocks in the northern or southern high latitudes because of extremely high carbon stocks (>100 kg C m−2) in a few grid cells. Several models separate plant lit-ter (variable name, cLitlit-ter) and coarse woody debris (cCwd) from cSoil (see table 1) to account for labile components. Therefore, to assess soil dynam-ics on a decadal time scale, we examined the total stock (SOCtotal) including both cSoil and cLitter
(plus cCwd). Carbon flows that affect the SOC stock were also examined: namely, litter input from vegetation (variable name, fVegLitter), and microbial decomposition and heterotrophic respiration (vari-able name, rh).
2.1.3. Experiments
A full description of the LUMIP experimental pro-tocol is given by Lawrence et al (2016). For this study, we selected experiments appropriate to our aim of analyzing historical to future SOC changes under dif-ferent land-use conditions. First, we analyzed outputs of baseline experiments (hereafter, experiment names are in italics) conducted with fully coupled models (i.e. in which climate is internally evolving):
• historical: 1700 or 1850 (model dependent) to 2014 • ssp126 and ssp370: 2015–2100.
The historical experiment was driven by histor-ical atmospheric and land conditions, and ssp126 and
ssp370 were driven by the SSPs 1–2.6 (low end) and
3–7.0 (middle to high end) scenarios from Scen-arioMIP (O’Neill et al 2016). More extensive crop-land expansion and forest loss occur in the ssp370 future than in the ssp126 future (Riahi et al2017). An additional experiment with prescribed (i.e. common among models) climate conditions was conducted by several ESMs:
• land-hist: driven by bias-adjusted observational
climate data, Global Soil Wetness Project phase 3 (van den Hurk et al2016).
LUMIP also includes specific experiments to eval-uate land-use impacts as differences from baseline experiments:
• hist-noLu: uses constant land-use conditions in the historical run
• land-noLu: uses constant land-use conditions in
the land-hist run
• ssp126_ssp370Lu: uses ssp370 land-use data in the ssp126 run
• ssp370_ssp126Lu: uses ssp126 land-use data in the ssp370 run
No experiment using constant land-use condi-tions for the future period was conducted because sensitivity to future land-use conditions is assessed by the land-use forcing exchange experiments (ssp126_ssp370Lu and ssp370_ssp126Lu). Data in CMIP format were obtained from the CMIP6 Portal provided by the Earth System Grid Federa-tion (https://esgf-node.llnl.gov/search/cmip6/; as of August 2020).
2.2. Analyses
2.2.1. Benchmarking of the current stock
cSoil values in 2000–2009 estimated in the
histor-ical experiment (or in the land-hist experiment in
the case of CMCC-CM2-SR5) were compared with two soil inventory datasets (which were produced
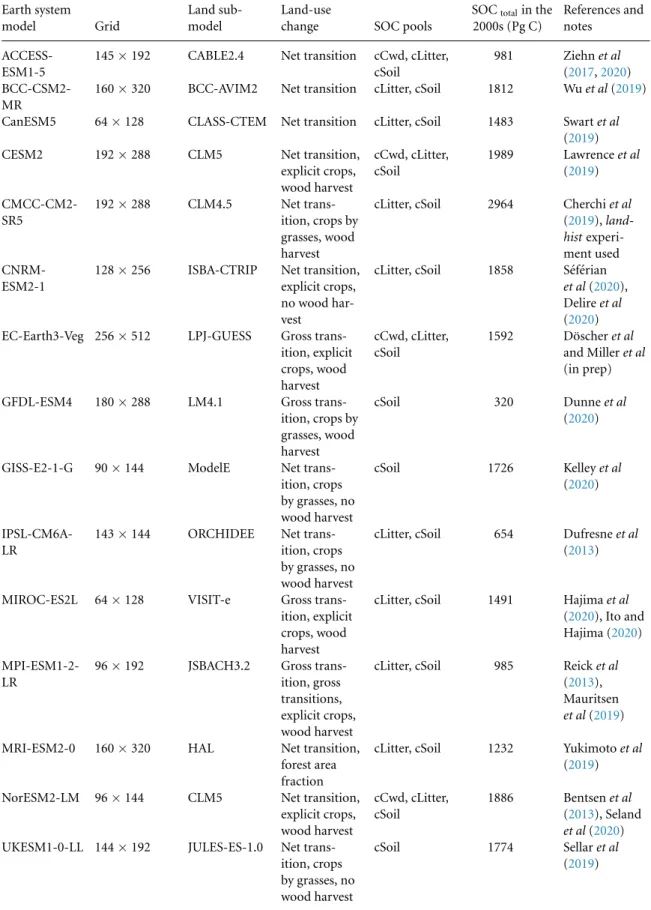
Table 1. Models analyzed in this study, land-use processes included, and present-day global total soil organic carbon (SOCtotal) stocks. Earth system model Grid Land sub-model Land-use
change SOC pools
SOCtotalin the
2000s (Pg C)
References and notes
ACCESS-ESM1-5
145× 192 CABLE2.4 Net transition cCwd, cLitter, cSoil
981 Ziehn et al (2017,2020)
BCC-CSM2-MR
160× 320 BCC-AVIM2 Net transition cLitter, cSoil 1812 Wu et al (2019) CanESM5 64× 128 CLASS-CTEM Net transition cLitter, cSoil 1483 Swart et al
(2019) CESM2 192× 288 CLM5 Net transition,
explicit crops, wood harvest cCwd, cLitter, cSoil 1989 Lawrence et al (2019) CMCC-CM2-SR5 192× 288 CLM4.5 Net trans-ition, crops by grasses, wood harvest
cLitter, cSoil 2964 Cherchi et al (2019),
land-hist
experi-ment used
CNRM-ESM2-1
128× 256 ISBA-CTRIP Net transition, explicit crops, no wood har-vest
cLitter, cSoil 1858 S´ef´erian
et al (2020), Delire et al (2020) EC-Earth3-Veg 256× 512 LPJ-GUESS Gross
trans-ition, explicit crops, wood harvest cCwd, cLitter, cSoil 1592 Döscher et al and Miller et al (in prep) GFDL-ESM4 180× 288 LM4.1 Gross
trans-ition, crops by grasses, wood harvest
cSoil 320 Dunne et al (2020)
GISS-E2-1-G 90× 144 ModelE Net trans-ition, crops by grasses, no wood harvest cSoil 1726 Kelley et al (2020) IPSL-CM6A-LR
143× 144 ORCHIDEE Net trans-ition, crops by grasses, no wood harvest
cLitter, cSoil 654 Dufresne et al (2013)
MIROC-ES2L 64× 128 VISIT-e Gross trans-ition, explicit crops, wood harvest
cLitter, cSoil 1491 Hajima et al (2020), Ito and Hajima (2020)
MPI-ESM1-2-LR
96× 192 JSBACH3.2 Gross trans-ition, gross transitions, explicit crops, wood harvest
cLitter, cSoil 985 Reick et al (2013), Mauritsen
et al (2019) MRI-ESM2-0 160× 320 HAL Net transition,
forest area fraction
cLitter, cSoil 1232 Yukimoto et al (2019) NorESM2-LM 96× 144 CLM5 Net transition,
explicit crops, wood harvest cCwd, cLitter, cSoil 1886 Bentsen et al (2013), Seland et al (2020) UKESM1-0-LL 144× 192 JULES-ES-1.0 Net
trans-ition, crops by grasses, no wood harvest
cSoil 1774 Sellar et al (2019)
by a number of soil profile surveys): the Harmon-ized World Soil Database v 1.21 (HWSD; FAO/IIAS-A/ISRIC/ISSCAS/JRC2012) and WISE30Sec (Batjes
2016). Global SOC estimates were also compared to empirical estimates by Post et al (1982) and Jobb´agy and Jackson (2000). Mean residence time (turnover, in years) of SOC was calculated by the simplest-model
approach (Todd-Brown et al2013) based on estim-ates for the 1850s (closer to equilibrium, because most models started their historical experiment in 1850 from an unforced control simulation). The use of near-equilibrium estimates avoids confounding factors from transient environmental changes such as ‘false priming’ (Koven et al2015).
2.2.2. Trends and patterns of SOC sequestration change
The annual global SOC sequestration rate was cal-culated for each experiment as the slope of a lin-ear regression applied to the data for given peri-ods (1950s [1950–1959], 2000s [2000–2009], 2030s [2030–2039], 2060s [2060–2069], and 2090s [2090– 2099]). The trends were calculated for the global total and for latitudinal zones (25◦ S–25◦ N and 25◦– 55◦ N). The relative change rate (‰ yr−1) was cal-culated by dividing the trend by the base SOC stock in the 2000s simulated by each ESM.
3. Results and discussion
3.1. Total soil carbon stock
Global SOCtotalsimulated in the 2000s ranged from
320 Pg C in GFDL-ESM4 to 2964 Pg C in CMCC-CM2-SR5 (table 1 and figure 1). Across the 15 ESMs, global SOCtotal averaged 1553 ± 672 Pg C
(mean± standard deviation [SD]), and most simu-lated global cSoil stocks fell within the range of obser-vational values. Global cLitter (12 ESMs) + cCwd (4 ESMs) and cSoil stocks were simulated as 185± 88 Pg C and 1413 ± 688 Pg C, respectively. On average, cLitter + cCwd accounted for 11.9% of SOCtotal; the global cLitter + cCwd fraction ranged
from 1.7% to 27.8% among the ESMs. Most models simulated high carbon stocks in the northern high latitudes and low carbon stocks in the middle to low latitudes (figure2; see figure S2 for cSoil maps), con-sistent with findings by Todd-Brown et al (2013) and Carvalhais et al (2014) for CMIP5 models. This sim-ulated latitudinal gradient reflects variations in the decomposition rate and is consistent with large-scale patterns seen in observational soil carbon datasets.
Global mean residence time of SOCtotal in the
1850s was calculated as 36.8± 20.5 years and ranged from 11.4 years in GFDL-ESM4 to 84.1 years in CMCC-CM2-SR5 (figure1). In most models, the res-idence time fell within the observational range of 18.5–45.8 years (Raich and Schlesinger1992, Amund-son 2001, Carvalhais et al 2014). The difference in mean residence time explains about 88% of the variation of global SOC stock among the models (figure S3). Previous studies have pointed out that the turnover rate is an important metric of ecosystem car-bon pools (e.g. Bonan et al2013, Todd-Brown et al
2013, Carvalhais et al 2014, Friend et al 2014). For example, Erb et al (2016) and Nyawira et al (2017) reported an acceleration of SOC turnover that they attributed mostly to a reduction in litter input driven by deforestation and crop and wood harvesting.
3.2. Temporal change in SOC stock 3.2.1. Historical period (1850–2014)
Throughout the historical experiment, the multi-model mean net SOC accumulation rate was
simulated to be 0.18 ± 0.41 Pg C yr−1 or
0.11 ± 0.31‰ yr−1 (mean ± SD of 15 models): historical total, 29.9± 66.9 Pg C. The highest accu-mulation rate was simulated by BCC-CSM2-MR: 1.1 Pg C yr−1 or 0.66‰ yr−1. Simulated changes in the global SOC stock showed model-specific tra-jectories (figure 3). A cluster analysis (figure 4(a)) showed that the trajectories could be categorized into two large groups, one considering of 4 models and the other of 11 models. The former group showed a steady increase of SOC total through the
histor-ical period, although the magnitude of the increase differed, from 39 Pg C in IPSL-CM6A-LR to 177 Pg C in BCC-CSM2-MR. The latter group was divided into two sub-groups: one comprised EC-Earth3-Veg and GFDL-ESM4, and the other consisted of the other nine models. The former group showed sub-stantial decreases in SOCtotal of 32 Pg C in
GFDL-ESM4 and 86 Pg C in EC-Earth3-Veg (both adopted gross land-use transition, table1), whereas the latter showed, in general, stable or weakly decreasing SOC
totaltrends to about 1950, followed by gradual
accu-mulations. As a result, net changes in SOCtotalduring
the 20th century were small in this model group. In all models, the historical change in SOC total is at
least partly attributable to land-use changes such as tropical deforestation. On an area-basis (figure S4), SOC total decreased at a rate of 3.0 ± 6.7 (median
2.5) Pg C per million km2 of cropland expansion
and 1.0± 2.2 (median 0.8) Pg C per million km2of
cropland and pasture expansion.
Historical changes in SOC stocks occurred het-erogeneously over the land surface and differed among ESMs (figure S5). Three models (ACCESS-ESM1-5, BCC-CSM3-MR, and CNRM-ESM2-1) showed extensive increases, whereas two models (EC-Earth3-Veg and GFDL-ESM4) that used gross land-use transition showed decreases in most land areas. The others showed a mixture of increases and decreases, depending on cultivation intensity and climate conditions. We focused on highly cultivated areas (see figure S1), which showed marked incon-sistencies among the model results. In Europe, for example, the majority of models simulated a net increase of SOC, whereas CanESM5 and GFDL-ESM4 simulated regional decreases of SOC stocks except in a few countries. In North America (Midwestern United States), the simulated historical change was obvi-ously inconsistent among the models: clear increases were simulated by six models, clear decreases by five models, and mixed patterns by four models. Similar inconsistencies were simulated in other cultivated areas such as in central South America and East Asia (China). In primary (naturally vegetated) lands, the SOC responses were mainly caused by climate change, but they were also inconsistent among the models. For example, in the Eurasian tundra and central Amazon, some models simulated a SOC increase, whereas others simulated a decrease.
Figure 3. Temporal trajectories of global total SOC simulated by ESMs in the LUMIP and CMIP6 experiments.
3.2.2. Future period (2015–2100)
In the ssp126 experiment, most models simu-lated increases in SOC total at model-specific rates:
0.57 ± 0.38 Pg C yr−1 or 0.39 ± 0.35‰ yr−1 (mean ± SD): total 47.8 ± 32.2 Pg C by the end of the 21st century. In the ssp370 experiment, the models also simulated increases in SOC total; the
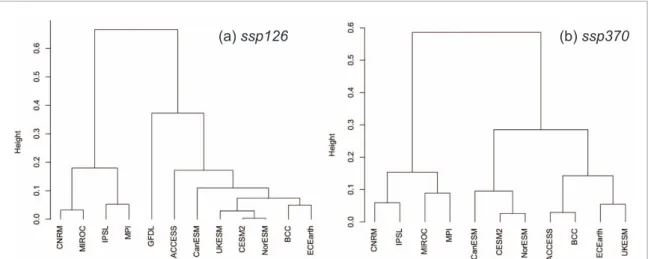
mean projected value was similar to that simulated in ssp126 but there was wider inter-model variabil-ity: 0.59 ± 0.69 Pg C yr−1 or 0.42 ± 0.50‰ yr−1 (total 49.3± 57.8 Pg C). A cluster analysis divided the change patterns simulated in the ssp126 exper-iment into two groups (figure 5(a)), one showing clear increasing trends and the other showing weak
Figure 4. Dendrogram of SOCtotalchange patterns
simulated in the historical experiment by the ESMs. The data are standardized to the values in the year preceding the analysis period. Clustering was conducted based on Euclidean distance (height) and conducted by the furthest neighbor method with R software (R Core Team2020).
or mixed trends. The fastest SOC accumulation rate of 1.27 Pg C yr−1 was simulated by CNRM-ESM2-1, and in terms of relative change, the fastest rate of 0.92‰ yr−1 was simulated by MPI-ESM1-2-LR. The simulated SOCtotalchange patterns of the ssp370
experiment were also divided into one group showing a steady increasing trend and a second group show-ing weak or mixed trends (figure5(b)). The mixed-trend group, e.g. ACCESS-ESM1-5 and UKESM1-0-LL, typically showed a parabolic trajectory, with an initial increase to saturation followed by a decrease (figure3).
Future changes in the SOC stock also occurred heterogeneously, with consistency between scenarios and differences among the models (figures S6 and S7). As seen in the historical experiment, in agricul-tural areas, the changes were inconsistent among the models and ranged from strong losses (e.g. central North America by CanESM5 and UKESM1-0-LL) to substantial gains (e.g. Europe by CESM2, MIROC-ES2L, and NorESM2-LM). As in the historical experi-ment, the soil responses in natural lands, for example, high-latitude lands dominated by boreal forest and tundra, to climate change were different among the models (figures S5 and S6); these results are consist-ent with previous climate impact studies (e.g. Friend
et al 2014, Todd-Brown et al 2014). Because these model-specific results are attributable to not only soil schemes but also the climate simulations, detailed investigations of biogeophysical and biogeochemical feedbacks for each ESM are needed (e.g. Ito and Hajima2020).
3.2.3. Land-use data exchange experiments
The land-use forcing exchange experiments
(ssp126-ssp370Lu and ssp370-ssp126Lu), conducted by seven
ESMs, helped us to assess the impacts of future land-use change on SOC. The magnitude of global
SOC change associated with a land-use scenario was evaluated as the difference between pairs of experiments (see figure 3). First, we identified sev-eral regions that were sensitive to anticipated future land-use changes (figure6). For example, in central Africa, CNMR-ESM2, MIROC-ES2L, and MPI-ES1-2-LR simulated larger SOC stocks in ssp370-ssp126Lu than in ssp370. In contrast, CanESM5 and UKESM1-0-LL simulated lower SOC stocks under the same conditions. Although the global total change in SOC (5.5–5.9 Pg C) was not markedly large, we should pay attention to these potentially vulnerable regions.
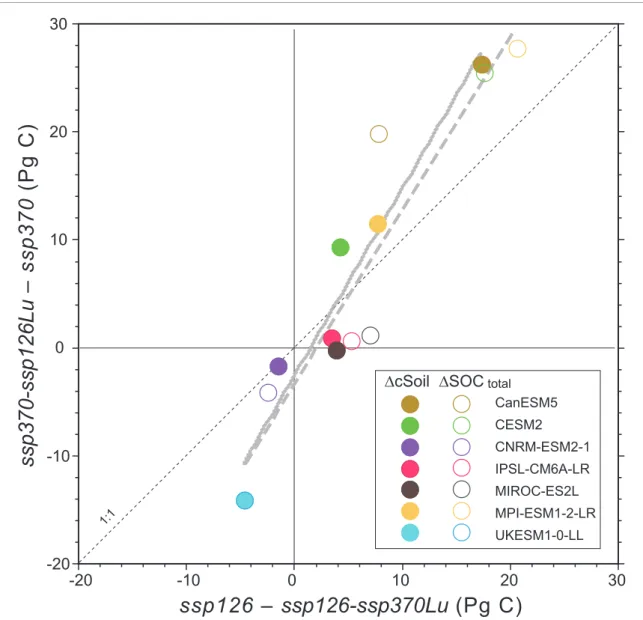
Second, among the ESMs, the model response to land-use change was asymmetric. The differences among ESMs were larger in the ssp370-based sim-ulations (−14 to 28 Pg C, y-axis of figure7) than in the ssp126-based simulations (−4 to 21 Pg C,
x-axis of figure7); these results imply that the impacts of land-use change are greater under higher green-house gas forcing. This asymmetry is likely due to the stronger CO2 fertilization effect at higher
CO2 levels, which causes larger gains and losses
to be associated with reforestation and deforesta-tion. In the ssp126-ssp370Lu experiment, SOC was more strongly reduced than in the ssp126 experiment because of weaker land-use regulation and continued deforestation.
Third, cLitter and cCwd showed characteristic contributions seen as the difference between the cSoil and SOCtotalresults in figure7. In MPI-ESM1-2-LR,
for example, the SOC stock in the ssp370-ssp126Lu simulation was 28 Pg C higher than it was in the simu-lation using the ssp370 land-use data. This SOC stock difference was associated with the smaller cropland expansion in the ssp126 land-use scenario. Interest-ingly, the detritus soil component responded sensit-ively to land-use change; cLitter accounted for about 60% of the SOC difference. The SOC response in the
ssp126-ssp370Lu experiment was opposite to that in
the ssp370-ssp126Lu experiment, and its magnitude was smaller. In contrast, in UKESM1-0-LL, less car-bon was stored when ssp126 land-use data were used with ssp370. However, the responses of several models were insensitive to the land-use change data used.
3.3. Implications for refinement of soil scheme in ESMs
The SD of global SOC total among the 15 ESMs,
±672 Pg C, was as large as that obtained by
previous-generation CMIP5 models,±770 Pg C (Todd-Brown
et al 2013). This large SD implies that the inter-model difference, stemming from inter-model uncertainty (e.g. Falloon et al 2011, Tian et al 2015), has not been markedly diminished since 2013. Previous stud-ies have reported similar inter-model variability. For example, Todd-Brown et al (2014) found that the sim-ulated global SOC response ranged from a 72 Pg C loss to a 253 Pg C gain. Nishina et al (2015) applied
Figure 5. Dendrogram of SOCtotalchange patterns in the results of the (a) ssp126 and (b) ssp370 experiments simulated by the
ESMs.
Figure 6. Distribution of the impacts of land-use change on SOCtotalin the 2090s. The difference (∆SOCtotal) between
ssp370-ssp126Lu and ssp370 simulated by each of the seven ESMs used for these experiments are shown.
the analysis of variance method to the simulation res-ults of six land models and found that the majority of the uncertainty in SOC projections (up to 90%) was attributable to differences in the sensitivity of land models in terms of responses to environmental change. The comparison among the simulated SOC responses to land-use forcing is a novel attempt of the present LUMIP-based analysis.
It is difficult to offer an explanation for the incon-sistency among the simulated SOC patterns that is both comprehensive and mechanistic. Nyawira et al (2017) devised a universal setup to isolate input-driven from turnover-input-driven soil carbon changes following land-use change. To conduct
correspond-ing analysis in a simpler manner, SOC variation is assessed to be caused by changes in carbon input by litterfall or in the decomposition rate associ-ated with the turnover rate. First, we examined input (fVegLitter) and output (rh) carbon flows of the SOC stock to examine the consistency between inputs and outputs across models. We found that although the magnitude of simulated flows differed among the ESMs, the relationship between the two flows was consistent across ESMs and SSPs (figures8(a) and (b)), and that the fVegLitter–rh relationship was quite linear in all cases. The mod-erate and model-specific relationships between the cumulative fVegLitter change and SOC change imply
Figure 7. Relationships of the simulated responses of cSoil and SOCtotal(i.e. including cLitter and cCwd) in 2100 between the pair
of land-use change experiments. Dotted and dashed gray lines show linear regression lines fitted to ∆cSoil and ∆SOCtotal,
respectively.
a substantial influence of different rates of car-bon loss by decomposition (figures8(c) and (d)). Moreover, this dynamic SOC response result is consistent with the static SOC stock result, which is well-correlated with mean residence time (figure S3(b)).
Certain processes and parameters of the soil mod-els implemented in ESMs can be improved, such as the decomposition rate and its sensitivity to temper-ature and moisture conditions. However, consider-ing the complexity of soil processes, a more practical strategy would be to constrain bulk (whole soil) metrics instead of individual parameters. Consider-ing its importance, in the carbon dynamics, mean residence time of SOC may be one candidate for such a constraint (e.g. Carvalhais et al 2014). The use of modern numerical algorithms would make it possible to optimize multiple parameters (e.g. base decomposition rate and temperature dependence) by minimizing errors in target metrics. By contrast, model structure improvements require deep insights
into biogeochemical processes. For example, different treatment of C–N interactions might lead to very dif-ferent responses in terms of SOC stocks. In fact, react-ive nitrogen deposition, acting in synergy with other environmental drivers, can enhance terrestrial car-bon sequestration in N-limited ecosystems (Zaehle
et al2011) but not, apparently, in N-saturated eco-systems (Bertolini et al2016). Other processes such as peat accumulation and permafrost thawing, although they occur locally, are nonetheless important in terms of the greenhouse gas budget of soils under global change. Establishing parameterizations for these pro-cesses is a big challenge for soil, ecosystem, and cli-mate model researchers.
3.4. Implications for soil management for climatic mitigation
Although the model results presented here appear inconsistent, nonetheless have implications for soil management for mitigation of global warming
Figure 8. Relationships between cumulative changes in carbon input by litterfall (fVegLitter) and (a), (b) carbon output as heterotrophic respiration (rh) or (c), (d) soil carbon (SOC) stock in the (a), (c) ssp126 and (b), (d) ssp370 experiments. The change term (∆) is defined as the difference from the 2000s mean, and∑represents the accumulation from 2015 to 2100.
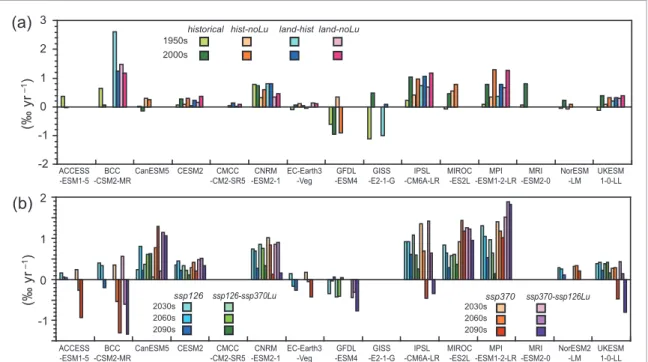
through carbon sequestration. First, the results indic-ate a range of possible rindic-ates of global SOC stock change (figure 9; see figure S8 for zonal results). In the 2000s in the historical experiment, the global SOC increment was simulated to increase at rates of around 0.46± 0.48 Pg C yr−1(0.28± 0.49‰ yr−1) by the 15 ESMs. This change rate seems modest in comparison with the technical potential of SOC sequestration (1.17 Pg C yr−1; Fuss et al2018), but at about one-third of net land sink (e.g. Friedlingstein
et al 2019), it is significant in terms of the global contemporary carbon budget. In the future ssp126 and ssp370 experiments, the change rate accelerates to about 0.78 Pg C yr−1 by the 2030s; a particularly high sequestration rate of about 1.9 Pg C yr−1 was simulated by CNRM-ESMs in the 2030s, and one
of 2.1 Pg C yr−1 was simulated by MIROC-ES2L
in the 2060s. The simulated future SOC accumu-lation induced by climate change and conventional land use (around 0.4‰ yr−1) is auspicious for future
climatic mitigation by soils, in particular if man-agement strategies are taken in top-level considera-tion in near-future decision-making processes. How-ever, it should be noted that in both experiments, the SOC accumulation rates gradually declined to 0.1–0.3 Pg C yr−1by the 2090s.
Second, the spatial results showed which regions are likely to respond more sensitively, specific-ally, to land-use change and land management (e.g. figures S5–S7). For example, MIROC-ES2L sim-ulated increased SOC stocks mainly in Central to East Siberia and East Asia, as well as in parts of Europe and North America. In several areas, somewhat decreased SOC stocks were simulated. In addition, croplands in central North America and West Europe were simulated by several ESMs to accumulate increasing amounts of carbon into the soil, probably as a res-ult of the extra input from crop harvest residues in some models. There geospatial outcomes are worth comparing with field survey results (e.g. Minasny et al
Figure 9. Relative change rates of global soil carbon (SOCtotal) storage simulated by the LUMIP experiments. Rates in (a) the
1950s and 2000s in the historical experiments and (b) the 2030s, 2060s, and 2090s in the future projection experiments. See figure S8 for results for the northern mid-latitudes and tropics.
2017), which show high carbon sequestration rates in soils with low initial stock and a dependency on man-agement history.
Third, the simulation results provide supple-mentary evidence that prevention of deforestation or reforestation can enhance SOC stocks. In the
hist-noLu experiment (conducted by all ESMs except
CMCC-CM2-SR5; sometimes with no wood har-vest), SOC stocks higher by 8–82 Pg C were sim-ulated in 2014 than were simsim-ulated in the
histor-ical experiment. The ssp126 and ssp370 experiments
provide corresponding insights. For example, the
ssp126 results imply that SOC total will increase by
as much as 11± 7 Pg C per million km2 if expan-sion of cropland and pasture is prevented. Like-wise, the land-use change experiments (figure 7) imply that SOC total would differ by 6 ± 8 Pg C
(ssp370Lu) and 6 ± 13 Pg C (ssp126Lu) as a
result of land-use conversion of 3.7 million km2
to cropland (or of 11.7 million km2 to cropland
and pasture).
4. Concluding remarks
This study investigated SOC stocks and their vari-ations simulated in CMIP6 and LUMIP experiments by ESMs. Overall, the results indicate that total SOC is likely to increase, although at a modest rate (about 0.4‰ yr−1). The present results do not do not pre-clude the possibility of soil carbon sequestration and suggest that SOC may function as a carbon reser-voir under future climate change. Additional efforts to improve soil carbon stocks should include not only enhancement of carbon sequestration through soil
management (e.g. reducing tillage, applying bio-char, or planting cover crops) but also prevention of soil carbon loss in croplands and vulnerable natural areas (Lal2004, Paustian et al 2016). These efforts would also provide environmental co-benefits, although the degree of their effectiveness in this regard is still being evaluated (e.g. Poeplau et al2011, Pugh et al2015). In addition, these modeling efforts emphasize the importance of monitoring and verification of SOC at global scale (Smith et al2020).
The impact of different land-use pathways on soil carbon stocks, as demonstrated by the land-use data exchange experiments, is a novel outcome showing the effectiveness of a LUMIP-based ana-lysis. It is still difficult, however, for land schemes to accurately reproduce contemporary physical condi-tions, chemical processes, and biological interactions (e.g. Luo et al2016), including land-use impacts. Further model refinement, especially in terms of land-use impact, of ESMs and integrated assessment models used for global change studies is required (e.g. Pugh et al2015, Nyawira et al2016, Arneth et al2017, Pongratz et al2018, Duarte-Guardia et al2019). Col-laborative work, data analysis, and modeling studies are necessary to obtain more reliable future projec-tions for effective climate mitigation planning and sustainable soil utilization.
Acknowledgments
We acknowledge the World Climate Research Pro-gramme, which coordinated and promoted CMIP6 through its Working Group on Coupled Modelling. We thank the various climate modeling groups for
producing and making available their model out-put, the Earth System Grid Federation (ESGF; URL,
https://esgf-node.llnl.gov/search/cmip6/) for archiv-ing the data and providarchiv-ing access, and the multiple funding agencies who support CMIP6 and ESGF A I and T H were supported by the Integrated Research Program for Advancing Climate Models, Ministry of Education, Culture, Sports, Science and Technology, Japan. J P was supported by the German Research Foundation’s EmmyNoether Program (PO1751/1-1). D M L was supported in part by the RUBISCO Sci-entific Focus Area (SFA), which is sponsored by the Regional and Global Climate Modeling (RGCxM) Program in 810 the Climate and Environmental Sci-ences Division (CESD) of the Office of Biological and Environmental Research in the U S Department of Energy Office of Science. B G received support from the French government under the ANR ‘Investisse-ments d’avenir’ program with the reference CLAND ANR-16-CONV-0003. C D J, A J W, and E R were sup-ported by the Joint UK BEIS/Defra Met Office Had-ley Centre Climate Programme (GA01101). D W acknowledges financial support from the Strategic Research Area MERGE (Modeling the Regional and Global Earth System—www.merge.lu.se) and the Swedish national strategic e-science research program eSSENCE (http://essenceofescience.se/). C D J, A J W, V B, S M, D P, and D W acknowledge funding from the European Union’s Horizon 2020 research and innovation programme CRESCENDO under Grant agreement No 641816.
Author contributions
A I drafted the paper and T H supervised the analyses. D M L coordinated the LUMIP. All authors contrib-uted significantly to conducting the LUMIP simula-tions, data preparation, interpretation, and writing of the manuscript.
Data availability statement
The data that support the findings of this study are openly available at https://esgf-node. llnl.gov/projects/cmip6/
ORCID iDs
Akihiko Ito https://orcid.org/0000-0001-5265-0791
Bertrand Guenet https://orcid.org/0000-0002-4311-8645
Chris D Jones https://orcid.org/0000-0002-7141-9285
Sergey Malyshev https://orcid.org/0000-0001-6259-1043
Stefano Materia https://orcid.org/0000-0001-5635-2847
References
Amundson R 2001 The carbon budget in soils Ann. Rev. Earth
Planet Sci.29 535–62
Amundson R and Biardeau L 2018 Soil carbon sequestration is an elusive climate mitigation tool Proc. Natl Acad. Sci. USA
115 11652–6
Arneth A et al 2017 Historical carbon dioxide emissions caused by land-use changes are possibly larger than assumed Nat.
Geosci.10 79–84
Arora V K and Montenegro A 2011 Small temperature benefits provided by realistic afforestation efforts Nat. Geosci.
4 514–8
Batjes N H 2016 Harmonized soil property values for broad-scale modeling (WISE30sec) with estimates of global soil carbon stock Geoderma269 61–68
Baveye P C, Berthelin J, Tessier D and Lemaire G 2017 The ‘4 per 1000’ initiative: a credibility issue for the soil science community? Geoderma309 118–23
Bentsen M et al 2013 The Norwegian Earth system model, NorESM1-M—part 1: description and basic evaluation of the physical climate Geosci. Model Dev.6 687–720
Bertolini T, Flechard C R, Fattore F, Nicolini G, Stefani P, Materia S, Valentini R, Vaglio Laurin G and Castaldi S 2016 DRY and BULK atmospheric nitrogen deposition to a West-African humid forest exposed to terrestrial and oceanic sources Agric. For. Meteorol.218/219 184–95
Bonan G B, Hartman M D, Parton W J and Wieder W R 2013 Evaluating litter decomposition in Earth system models with long-term litterbag experiments: an example using the Community Land Model version 4 (CLM4) Glob. Change
Biol.19 957–74
Bond-Lamberty B and Thomson A 2010 A global database of soil respiration data Biogeosciences7 1915–26
Bossio D A et al 2020 The role of soil carbon in natural climate solutions Nat. Sustainability3 391–8
Boysen L et al 2020 Global climate response to idealized deforestation in CMIP6 models Biogeosci.17 5615–38
Carvalhais N et al 2014 Global covariation of carbon turnover times with climate in terrestrial ecosystems Nature
514 213–7
Cherchi A et al 2019 Global mean climate and main patterns of variability in the CMCC-CM2 coupled model J. Adv. Model
Earth Sys.11 185–209
Cox P M, Betts R A, Jones C D, Spall S A and Totterdell I J 2000 Acceleration of global warming due to carbon-cycle feedbacks in a coupled climate model Nature408 184–7
Crowther T W et al 2016 Quantifying global soil carbon losses in response to warming Nature540 104–8
Delire C et al 2020 The Global Land Carbon Cycle Simulated With ISBA-CTRIP: Improvements Over the Last Decade J. Adv.
Model. Earth Syst.12
Duarte-Guardia S, Peri P L, Borchard N and Ladd B 2019 Soils need to be considered when assessing the impacts of land-use change on carbon sequestration Nat. Ecol. Evol.
3 1642
Dufresne J-L et al 2013 Climate change projections using the IPSL-CM5 Earth system model: from CMIP3 to CMIP5
Clim. Dyn. 40 2123–65
Dunne JP et al 2020 The GFDL Earth System Model Version 4.1 (GFDL-ESM 4.1): Overall Coupled Model Description and Simulation Characteristics J. Adv. Model. Earth Syst.12
Erb K-H, Fetzel T, Plutzar C, Kastner T, Lauk C, Mayer A, Niedertscheider M, Körner C and Haberl H 2016 Biomass turnover time in terrestrial ecosystems halved by land use
Nat. Geosci.9 674–8
Eyring V et al 2016 Overview of the Coupled Model Intercomparison Project Phase 6 (CMIP6) experimental design and organization Geosci. Model Dev.9 1937–58
Falloon P et al 2011 Direct soil moisture controls of future global soil carbon changes: an important source of uncertainty
FAO/IIASA/ISRIC/ISSCAS/JRC 2012 Harmonized World Soil
Database (version 1.2) FAO and IIASA
Friedlingstein P et al 2006 Climate–carbon cycle feedback analysis: results from the C4MIP model intercomparison J.
Clim.19 3337–53
Friedlingstein P et al 2019 Global carbon budget 2019 Earth Sys.
Sci. Data11 1783–838
Friend A D et al 2014 Carbon residence time dominates uncertainty in terrestrial vegetation responses to future climate and atmospheric CO2Proc. Natl Acad. Sci. USA
111 3280–5
Fuss S et al 2018 Negative emissions—part 2: costs, potentials and side effects Environ. Res. Lett.13 063002
Govers G, Merckx R, van Wesemael B and Van Oost K 2017 Soil conservation in the 21st century: why we need smart agricultural intensification Soil3 45–59
Hajima T et al 2020 Development of the MIROC-ES2L Earth system model and the evaluation of biogeochemical processes and feedbacks Geosci. Model Dev.13 2197–244
Hashimoto S et al 2017 Data-mining analysis of the global distribution of soil carbon in observational databases and Earth system models Geosci. Model Dev.
10 1321–37
Houghton R A 1995 Land-use change and the carbon cycle Glob.
Change Biol.1 275–87
Hugelius G et al 2014 Estimated stocks of circumpolar permafrost carbon with quantified uncertainty ranges and identified data gaps Biogeosciences11 6573–93
Hurtt G C et al 2020 Harmonization of global land-use change and management for the period 850–2100 (LUH2) for CMIP6 Geosci. Model Dev. in press
Intergovernmental Panel on Climate Change (IPCC) 2013
Climate Change 2013: The Physical Science Basis
(Cambridge: Cambridge University Press)
Ito A and Hajima T 2020 Biogeophysical and biogeochemical impacts of land-use change simulated by MIROC-ES2L
Prog. Earth Planet Sci.7 54
Jobb´agy E G and Jackson R B 2000 The vertical distribution of soil organic carbon and its relation to climate and vegetation
Ecol. Appl.10 423–36
Jones C, Mcconnell C, Coleman K, Cox P, Falloon P, Jenkinson D and Powlson D 2005 Global climate change and soil carbon stocks; predictions from two contrasting models for the turnover of organic carbon in soil Glob. Change Biol.
11 154–66
Keith A M, Schmidt O and Mcmahon B J 2016 Soil stewardship as a nexus between ecosystem services and one health Ecosyst.
Serv.17 40–42
Kelley M et al 2020 GISS-E2.1: Configurations and Climatology
J. Adv. Model. Earth Syst.12
Koven C D, Chambers J Q, Georgiou K, Knox R, Negron-Juarez R, Riley W J, Arora V K, Brovkin V, Friedlingstein P and Jones C D 2015 Controls on terrestrial carbon feedbacks by productivity versus turnover in the CMIP5 Earth system models Biogeoscieces12 5211–28
Lal R 2003 Soil erosion and the global carbon budget Environ. Int.
29 437–50
Lal R 2004 Soil carbon sequestration to mitigate climate change
Geoderma123 1–22
Lawrence D M et al 2016 The Land Use Model Intercomparison Project (LUMIP) contribution to CMIP6: rationale and experimental design Geosci. Model Dev.9 2973–98
Lawrence D M et al 2019 The Community Land Model version 5: description of new features, benchmarking, and impact of forcing uncertainty J. Adv. Model Earth Syst.11 4245–87
Lawrence P J, Lawrence D M and Hurtt G C 2018 Attributing the carbon cycle impacts of CMIP5 historical and future land use and land cover change in the community Earth system model (CESM1) J. Geophys. Res. Biogeosci.123 1732–55
Luo Y et al 2016 Toward more realistic projections of soil carbon dynamics by Earth system models Glob. Biogeochem. Cycles
30 40–56
Ma L et al 2020 Global rules for translating land-use change (LUH2) to land-cover change for CMIP6 using GLM2
Geosci. Model Dev.13 3203–20
Mauritsen T et al 2019 Development in the MPI-M Earth system model version 1.2 (MPI-ESM1.2) and its response to increasing CO2J. Adv. Model Earth Syst.11 998–1038
Minasny B et al 2017 Soil carbon 4 per mille Geoderma292 59–86
Nishina K et al 2015 Decomposing uncertainties in the future terrestrial carbon budget associated with emission scenario, climate projection, and ecosystem simulation using the ISI-MIP result Earth Syst. Dyn.6 435–45
Nyawira S S et al 2017 Input-driven versus turnover-driven controls of simulated changes in soil carbon due to land-use change Environ. Res. Lett.12 084015
Nyawira S S, Nabel J E M S, Don A, Brovkin V and Pongratz J 2016 Soil carbon response to land-use change: evaluation of a global vegetation model using observational meta-analyses
Biogeosciences13 5661–75
O’Neill B C et al 2016 The Scenario Model Intercomparison Project (ScenarioMIP) for CMIP6 Geosci. Model Dev.
9 3461–82
Paustian K et al 2016 Climate-smart soils Nature532 49–57
Poeplau C et al 2011 Temporal dynamics of soil organic carbon after land-use change in the temperate zone—carbon response functions as a model approach Glob. Change Biol.
17 2415–27
Pongratz J et al 2010 Biogeophysical versus biogeochemical climate response to historical anthropogenic land cover change Geophys. Res. Lett.37 L08702
Pongratz J et al 2018 Models meet data: challenges and opportunities in implementing land management in Earth system models Glob. Change Biol.24 1470–87
Post W M, Emanuel W R, Zinke P J and Stangenberger A G 1982 Soil carbon pools and world life zones Nature298 156–9
Pugh T A M et al 2015 Simulated carbon emissions from land-use change are substantially enhanced by accounting for agricultural management Environ. Res. Lett.10 124008
R Core Team 2020 R version 4.0.2
Raich J W and Schlesinger W H 1992 The global carbon dioxide flux in soil respiration and its relationship to vegetation and climate Tellus44B 81–99
Reick C H, Raddatz T, Brovkin V and Gayler V 2013 Representation of natural and anthropogenic land cover change in MPI-ESM J. Adv. Model Earth Syst.5 459–82
Riahi K et al 2017 The shared socioeconomic pathways and their energy, land use, and greenhouse gas emissions
implications: an overview Glob. Environ. Change
42 153–68
Sanderman J, Hengl T and Fiske G J 2017 Soil carbon debt of 12,000 years of human land use Proc. Natl Acad. Sci. USA
114 9575–80
S´ef´erian R et al 2020 Evaluation of CNRM Earth-system model, CNRM-ESM2-1: role of Earth system processes in present-day and future climate J. Adv. Model Earth Syst.
11 4182–227
Seland Ø et al 2020 The Norwegian Earth system model, NorESM2—evaluation of the CMIP6 DECK and historical simulations Geosci. Model Dev. Discuss.
Sellar A A et al 2019 UKESM1: description and evaluation of the U.K. Earth system model J. Adv. Model Earth Sys.11 4513–58
Sellers P J et al 1997 Modeling the exchanges of energy, water, and carbon between continents and the atmosphere Science
275 502–9
Smith P 2008 Land use change and soil organic carbon dynamics
Nutr. Cycling Agroecosyst.81 169–78
Smith P et al 2020 How to measure, report and verify soil carbon change to realize the potential of soil carbon sequestration for atmospheric greenhouse gas removal Glob. Change Biol.
26 219–41
Soussana J-F et al 2019 Matching policy and science: rationale for the ‘4 per 1000 – soils for food security and climate’ initiative Soil Till Res.188 3–15
Stocker B D et al 2014 Past and future carbon fluxes from land use change, shifting cultivation and wood harvest Tellus
66B 23188
Stockmann U et al 2013 The knowns, known unknowns and unknowns of sequestration of soil organic carbon Agric.
Ecosyst. Environ.164 80–99
Swart N C et al 2019 The Canadian Earth System Model version 5 (CanESM5.0.3) Geosci. Model Dev.12 4823–73
Tian H et al 2015 Global patterns and controls of soil organic carbon dynamics as simulated by multiple terrestrial biosphere models: current status and future directions Glob.
Biogeochem. Cycles29 775–92
Todd-Brown K E O et al 2013 Causes of variation in soil carbon simulations from CMIP5 Earth system models and comparison with observations Biogeosciences
10 1717–36
Todd-Brown K E O et al 2014 Changes in soil organic carbon storage predicted by Earth system models during the 21st century Biogeosciences11 2341–56
van den Hurk B et al 2016 LS3MIP (v1.0) contribution to CMIP6: the land surface, snow and soil moisture model
intercomparison project – aims, setup and expected outcome Geosci. Model Dev.9 2809–32
van Oost K et al 2007 The impact of agricultural soil erosion on the global carbon cycle Science318 626–9
Wu T et al 2019 The Beijing Climate Center climate system model (BCC-CSM): the main progress from CMIP5 to CMIP6
Geosci. Model Dev.12 1573–600
Yamagata Y, Hanasaki N, Ito A, Kinoshita T, Murakami D and Zhou Q 2018 Estimating water-food-ecosystem trade-offs for global negative emission scenario (IPCC-RCP2.6)
Sustainability Sci.13 301–13
Yukimoto S et al 2019 The Meteorological Research Institute Earth System Model version 2.0, MRI-ESM2.0: description and basic evaluation of the physical component J. Meteorol.
Soc. Japan97 931–65
Zaehle S, Ciais P, Friend A D and Prieur V 2011 Carbon benefits of anthropogenic reactive nitrogen offset by nitrous oxide emissions Nat. Geosci.4 601–5
Ziehn T et al 2020 The Australian Earth system model: ACCESS-ESM1.5 J. South. Hemisphere Earth Syst. Sci. Ziehn T, Lenton A, Law R M, Matear R J and Chamberlain M A
2017 The carbon cycle in the Australian Community Climate and Earth System Simulation (ACCESS-ESM1) – part 2: historical simulations Geosci. Model Dev.