Kinetics of Heterosite Iron Phosphate Lithiation by
1Chemical Reduction
2Christian Kuss,$ Murielle Carmant-Dérival,$ Ngoc Duc Trinh,$ Guoxian Liang,# and Steen Brian 3
Schougaard$* 4
$ Université du Québec à Montréal, Département de chimie, C.P. 8888 Succ. Centre-ville, 5
Montreal (QC) H3C 3P8, Canada 6
# Clariant Canada, Inc., 280 ave. Liberté, Candiac (QC) J5R 6X1, Canada 7
KEYWORDS. Lithium diffusion, intercalation kinetics, activation energy, cycling rate 8
ABSTRACT. Understanding the kinetics of the charging and discharging processes in battery 9
materials is important to improving high power performance. As such, we here investigate the 10
kinetics of LiFePO4 relithiation by reduction with lithium iodide. Unlike standard
11
electrochemical kinetic analysis, which yields a convoluted response of all the components of the 12
composite electrode, this approach probes only the kinetics of the electroactive material particles. 13
The kinetic data was compared to the Avrami solid state reaction model, and a statistical model 14
by Bai and Tian, Electrochimica Acta 89 (2013), 644. Different from chemical delithiation, the 15
lithiation reaction does not fit a solid solution one-dimensional diffusion model, rather it follows 16
the Avrami equation (Avrami exponent 0.6) with an activation energy of 50 kJ mol-1. The 17
obtained reaction rate information is central to the development of physically accurate 1
quantitative battery models. 2
Introduction 3
In 2006, the introduction of the Tesla Roadster brought prestige to electrified personal 4
transport,1 leaving other car manufacturers to pick up the pace in the development of mass 5
market electric cars. Since then most major car manufacturers have introduced an electric or 6
hybrid electric car in their portfolio. Unfortunately, mainstream consumers remain unsatisfied, 7
particularly with respect to driving range and charging time.2 Consequently, research towards 8
improving lithium battery rate performance continues. 9
To identify the rate limiting step in composite battery electrodes, complex physical models are 10
often employed.3-4 Due to the complexity of ion transport in batteries – through active materials, 11
auxiliary materials and tortuous paths in the liquid electrolyte – a large number of parameters are 12
needed. Of these, only few have been acquired experimentally, while most are derived from 13
fitting modeled data to experimental ones. Models that are based on processes that are physically 14
very different may therefore yield comparable reproducibility of experimental results, simply due 15
to the number of adjustable variables available during the nonlinear fitting process. The situation 16
is further complicated by the fact that some experimental parameters are reported with great 17
variability. This is the case for the lithium diffusion coefficient of LiFePO4.
18
LiFePO4 has been extensively researched over the past fifteen years as a positive lithium
19
battery material, as it exhibits very advantageous properties.5 Nevertheless, its reported lithium 20
diffusion coefficients span an unusually large range from 10-18 cm2 s-1 to 10-12 cm2 s-1.6 21
Importantly, recent research has shown that apparently slow lithium mobility in LiFePO4 may be
an artefact of the lithium movement in the complex composite electrodes. Thus the apparent 1
LiFePO4 kinetics are faster if the material is investigated separately from the conventional
2
electrode coating.7-9 E.g. in a recent electrochemical single particle study LiFePO4 was charged
3
to 70% of its slow rate capacity in two minutes.7 Thus, to get reliable diffusion coefficients while 4
avoiding the kinetic limitations imposed by the composite electrode, we recently used chemical 5
oxidation, to study LiFePO4 delithiation kinetics.8-9 In the present paper, we are expanding on
6
these results, by investigating the relithiation kinetics by an in situ method. To this end, we used 7
a chemical reducing agent to insert lithium into FePO4, thus avoiding the need to connect the
8
particles electronically to a current collector. As such, neither binder, nor conductive matrix are 9
needed. Instead, electrons and lithium ions are drawn from the surrounding solution. Due to 10
stirring, the diffusion path around each particle is kept short, ensuring quick concentration 11
equilibration. Consequently, the thermodynamic driving force for the relithiation reaction is well 12
distributed over the entire particle population, as well as, the surface of each individual particle. 13
Overall the methodology employed here is therefore similar to the familiar electrochemical 14
potential step, except, electrons are delivered via the molecular redox reaction at the surface of 15
the particle rather than from the current collector through the composite electrode structure. As 16
such, the effects of non-uniform electronic potential and lithium concentration, which complicate 17
analysis of the electrochemical potential step experiments11 are minimized or eliminated here. 18
Finally, the progress of the relithiation reaction10 19
FePO4 + LiI → LiFePO4 + ½ I2 (1)
20
can be conveniently followed photometrically in situ due to formation of the strongly colored 21
iodine molecules. 22
Experimental 1
Industrial hydrothermally synthesized carbon coated LiFePO4 was employed as starting
2
material. The LiFePO4 was exposed to a solution of 2.4 % hydrogen peroxide and 0.1 % acetic
3
acid in water to delithiate the material to FePO4.9 Complete relithiation was achieved by
4
suspending the produced FePO4 in a 14 mM solution of LiI in Acetonitrile, allowing for more
5
than 60 minutes reaction time. The product was subsequently filtered, washed with Acetonitrile 6
and dried. 7
Starting material, FePO4 and relithiated LiFePO4 were subjected to attenuated total reflectance
8
fourrier transform spectroscopy (ATR-FTIR), X-ray diffraction (XRD) and transmission electron 9
microscopy (TEM). ATR-FTIR was performed on a Thermo Scientific Nicolet 6700 FTIR 10
spectrometer using a Smart iTR diamond crystal accessory in the wavenumber range of 600 cm-1 11
to 2000 cm-1. X-ray diffraction (XRD) was performed with a Co-Kα source (λ = 1.789 Å), to
12
avoid interference from iron X-ray fluorescence. Transmission electron micrographs (TEM) 13
were recorded on a JOEL JEM-2100F with an acceleration voltage of 200 kV, after suspending 14
the samples in acetonitrile and depositing them on a lacey carbon / nickel grid. The lithium 15
insertion yield was determined by atomic emission/absorption spectroscopy. To this end, the 16
produced material was dissolved in concentrated nitric acid (Anachemia ACS), and diluted. 17
Spectroscopy standard solutions (Li: Alfa Aesar, Fe: Fisher Scientific) were diluted to the same 18
concentration range as the sample, using dilute nitric acid, to obtain a calibration curve. 19
Concentrations were determined by flame atomic emission spectroscopy at 670.8 nm for lithium 20
and by flame atomic absorption spectroscopy at 248.3 nm for iron. Elemental analysis was 21
performed in triplicates. The error is estimated based on a student’s t distribution for a 22
confidence level of 95%. 23
The electrochemical performance was determined with CR2032-type coin cells using metallic 1
lithium (Alfa Aesar 99.9 %) as the anode. The positive electrode was prepared by casting a slurry 2
of 84.2 wt.% LiFePO4, 8.8 wt.% acetylene black and 7 wt.% polyvinylidene fluoride (Kynar KF
3
Polymer W#1100) in N-methyl-2-pyrrolidone (Alfa Aesar 99.5%) on carbon-coated Al current 4
collector (Exopack). The coating was subsequently dried at 60 °C under atmospheric pressure for 5
2 hours, and under reduced pressure overnight. The dried electrode exhibited a thickness of 40 6
µm and a density of 0.36 g cm-3. A 1 M LiPF
6 in 1:1 ethylene carbonate / dimethyl carbonate
7
(Novalyte Technologies) electrolyte and Celgard 2500 separator were used. The coin cells were 8
assembled in an argon atmosphere glove box (H2O < 1 ppm, O2 < 1 ppm). Electrochemical
9
testing was performed by galvanostatic cycling at a C/5 rate with a cell voltage range of 2.2-4.2 10
V at room temperature using a BST8-MA 8 channels battery analyzer (MTI corp.). An open 11
circuit rest period of 60 minutes was imposed after every charge/discharge step. The plotted 12
capacity was calculated with respect to the amount of carbon coated LiFePO4 employed in the
13
positive electrode. 14
In situ photometry of the described relithiation reaction was performed at 361 nm in a standard 15
UV/Vis spectrometer (Ocean Optics) with a 1 cm light path standard quartz cuvette. Lithiation 16
experiments were performed in a 13.4 mM solution of LiI in acetonitrile. The initial light 17
absorption of 1.8 ml of the LiI solution was recorded for about 10 seconds. Then 0.2 ml of a 18
0.042 mM FePO4 suspension was added and the absorption vs. time was collected for an
19
additional 10 min. The cuvette was kept closed to avoid significant solvent evaporation. Stirring 20
was maintained during data collection. The experiment was performed in a cuvette holder that 21
allows temperature control. All solutions were thermalized in a waterbath before 22
experimentation. The temperature was confirmed using an infrared thermometer (Mastercraft). 23
To obtain calibration curves, the same concentration of LiI solution was treated with varied 1
known amounts of FePO4 and left to react for one hour, before filtering and measuring their
2
absorption. This ensures that absorption changes due to formation of oligo-/poly-iodide ions are 3
considered. To account for parasitic iodide oxidation by air, as well as, particle scattering, blanks 4
were recorded using the same procedure as for the in situ runs, but adding LiFePO4 instead of
5
FePO4.
6
Finally, to test the hypothesis that diffusion in the liquid and surface oxidation reaction kinetics 7
are not limiting the reaction rate, the same photometric experiment was carried out at room 8
temperature with a LiI solution diluted to ¼ of the previous concentration. No effect of the 9
dilution on the reaction rate could be observed. 10
Results and discussion 11
Validation of the relithiation products 12
Carbon coated FePO4, obtained by delithiating commercial LiFePO4, using a solution of H2O2
13
in water, was relithiated according to equation (1). The resulting materials were submitted to 14
different characterization techniques, in order to confirm the nature of the reaction products. 15
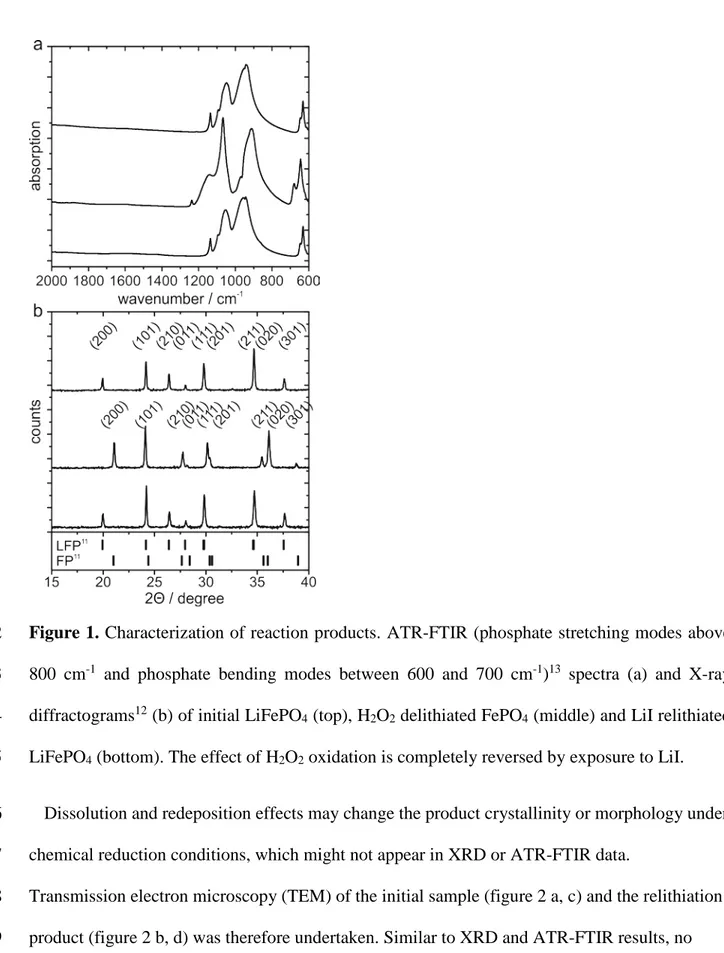
XRD12, as well as, ATR-FTIR13 spectroscopy show the formation of heterosite FePO4 after
16
oxidation with hydrogen peroxide. After relithiation, the produced LiFePO4 is indistinguishable
17
from the starting material by ATR-FTIR spectroscopy (figure 1 a) and XRD (figure 1 b). 18
Furthermore, atomic emission spectrometry confirms a lithium to iron ratio of 1.1 ± 0.1 in the 19
relithiated product. Consequently, all three techniques confirm that this reaction is chemically 20
analogue to the electrochemical discharge of lithium iron phosphate. 21
1
Figure 1. Characterization of reaction products. ATR-FTIR (phosphate stretching modes above 2
800 cm-1 and phosphate bending modes between 600 and 700 cm-1)13 spectra (a) and X-ray 3
diffractograms12 (b) of initial LiFePO4 (top), H2O2 delithiated FePO4 (middle) and LiI relithiated
4
LiFePO4 (bottom). The effect of H2O2 oxidation is completely reversed by exposure to LiI.
5
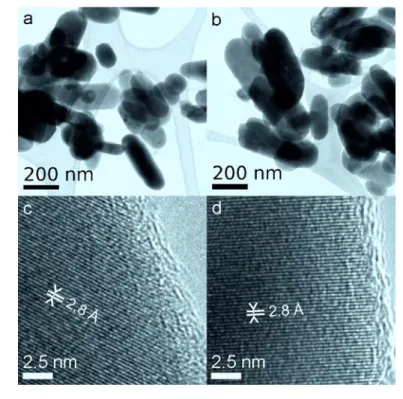
Dissolution and redeposition effects may change the product crystallinity or morphology under 6
chemical reduction conditions, which might not appear in XRD or ATR-FTIR data. 7
Transmission electron microscopy (TEM) of the initial sample (figure 2 a, c) and the relithiation 8
product (figure 2 b, d) was therefore undertaken. Similar to XRD and ATR-FTIR results, no 9
change in the material is observable, thus supporting the hypothesis, that the lithiation reaction 1
with LiI can be used as a model for lithium iron phosphate discharge. 2
3
Figure 2. Morphology and crystallinity. TEM micrographs of the initial LiFePO4 (a and c) and
4
the relithiated LiFePO4 (b and d) at standard and high resolution (2.8 Å lattice distance is
5
consistent with the LiFePO4 (3,0,1) lattice plane). Particle morphology and crystallinity remain
6
intact after the complete chemical lithiation cycle. 7
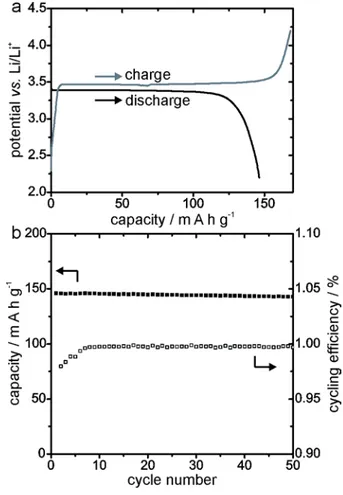
Finally, in order to confirm that the material remains electrochemically active, the product 8
LiFePO4 was electrochemically cycled in research coin cells. As can be seen in figure 3, the
9
electrochemical cell discharges and charges with stable potential plateaus around 3.4 V vs. 10
Li/Li+. The obtained capacity remains stable over the 50 recorded test cycles. 11
1
Figure 3. Electrochemical performance of the chemically cycled LiFePO4. a. First charge /
2
discharge cycle of a battery containing the relithiated LiFePO4. b. Cycling efficiency and cycling
3
stability of the same battery. 4
In situ UV/Vis photometry
5
UV/Vis photometry was used to follow the reaction in situ, subsequent to confirming the 6
reaction product as being crystalline and electrochemically active LiFePO4. The formation of
7
iodine leads to a strong increase in light absorption in the visible spectrum. Figure 4a therefore 8
shows well-resolved photometric data with a high signal to noise ratio. 9
1
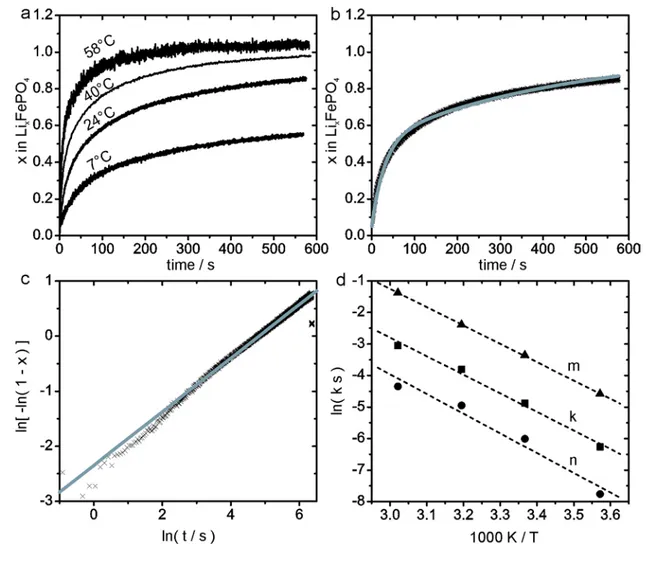
Figure 4. In situ photometry data. Lithiation curves of LixFePO4 (a), fit to the Bai model (black:
2
experimental data, grey: model) (b), fit to the Avrami model (black: experimental data, grey: 3
model) (c), and Arrhenius plot (d) of the obtained kinetic data. m corresponds to the rate of 4
active particle to transformed particle conversion and n to the particle activation rate of the Bai 5
model. k corresponds to the reaction rate of the Avrami model. Respective equations can be 6
found in the supporting information. The room temperature reaction has been shown to reach x = 7
1.1 ± 0.1 at prolonged reaction time by elemental analysis. 8
To quantify the reaction rate, classic solid state kinetic models14 may be chosen, e.g. the 9
Avrami model has been applied previously to study LiFePO4,9, 15-16. Alternatively, a statistical
model has been developed by Bai and Tian17-18 for the transformation of LiFePO4 particles in an
1
electrode. Based on a statistical understanding of the reaction progress, the Avrami and Bai 2
models lead to mathematically similar expressions for the reaction progress. In fact, all the 3
following models are of the same mathematical form −ln (1 − 𝛼𝛼) = 𝑘𝑘𝑘𝑘 (α conversion fraction, k 4
reaction rate constant, t time): 5
i. Bai model under the condition that the transformation rate of “activated” particles is 6
very fast, compared to the “activation” rate (e.g. nucleation rate), 7
ii. Bai model under the condition that all particles are already activated and reaction 8
progress is only determined by the transformation rate, 9
iii. Avrami model for a transformation that is solely controlled by 1D boundary 10
movement,14 and 11
iv. spherical Fick’s diffusion limited transformation. 12
Consequently, the Avrami and Bai models produce fits of similar qualities. The Avrami model 13
fit with exponent of 0.6 suggests a diffusion controlled crystallite growth, with reaction rate 14
contribution from a strongly decelerating nucleation rate. In comparison, the Bai model produces 15
activation (nucleation) rates that are 10 to 30 times slower than the respective conversion rates, at 16
an initial amount of activated particles of about 40%. Given the similar curve shape of nucleation 17
and transformation limited models, mechanistic information cannot be extracted from the 18
reaction rate information alone, but different in situ observations are necessary to determine the 19
limiting mechanism with certainty. The choice of model and the observed fits are thus only 20
relevant for comparison with other reaction rates observed in the LiFePO4 system. However, one
value, the activation energy, exhibits remarkable robustness with regards to the applied model. 1
Moreover, the fact that this activation energy is the same for the two rate constants of the Bai 2
model, suggests that not two, but only one rate contributing step exists, which does not seem to 3
follow the simple statistical assumptions underlying these models. For the Avrami rate constant, 4
as well as the two Bai model rate constants, the activation energy for this limiting step amounts 5
to a comparably large15-16, 19-20 50 kJ mol-1. 6
The obtained Bai model parameters are surprisingly different from electrochemically obtained 7
data,18 even though the material was obtained from the same source. The activation rates are in 8
the same order of magnitude, however, the transformation rate is near 10 times larger during the 9
chemical lithiation. This may very likely be an effect of the increased thermodynamic driving 10
force of the chemical lithiation. 11
The present chemical lithiation study, as well as, the corresponding electrochemical results by 12
Levi et al.18 produce results that are in stark contrast to the chemical delithiation. The delithiation 13
exhibits larger rates and fits an Avrami exponent of one, thus fitting all the four listed situations 14
above. In fact, the Bai model with two independent steps cannot produce reproducible 15
parameters for the delithiation data. Most notably, however, the delithiation rate is much less 16
temperature dependent: the lithiation activation energy is nearly three times larger than the 17
delithiation activation energy. Thus the delithiation reaction is clearly limited by a different 18
mechanism than the lithiation reaction. 19
Conclusions 20
Chemical lithiation of lithium iron phosphate with LiI is a chemical model equivalent to an 21
electrochemical potential step to about 3.0 V vs. Li/Li+ (underpotential of 350 mV),21 with the
22
distinct advantage that the entire sample and surface experience the same potential. The 23
formation of iodine can be conveniently followed by in situ photometry, providing kinetic data 1
on the progress of the lithiation reaction with sub second time resolution. The kinetic data fits the 2
Avrami model at an Avrami exponent of 0.6, and follows the Bai statistical model with relatively 3
slow nucleation. It is, as such, different from the known chemical delithiation kinetics, since it 4
cannot be made to fit a simple one-dimensional solid solution diffusion model and exhibits a 5
significantly higher activation energy. Thus, the underlying rate limiting mechanism must be 6
different for the chemical lithiation and delithiation processes. Because a purely diffusion limited 7
lithium (de-)intercalation would have to be largely symmetric with respect to the direction of 8
lithium movement, the lithiation reaction cannot be solely limited by diffusion. The strong 9
temperature dependence of the lithiation reaction rate also entails that, different from the 10
charging reaction, it may be of interest to heat a discharging battery when withdrawing high peak 11 currents. 12 AUTHOR INFORMATION 13 Corresponding Author 14
* Département de chimie, Université du Québec à Montréal, C.P. 8888, Succ. Centre-Ville, 15
Montréal (QC) H3C 3P8, Canada, email: [email protected], telephone: (+1) 514-987-16
3000 ext. 3911 17
Author Contributions 18
The manuscript was written through contributions of all authors. All authors have given approval 19
to the final version of the manuscript. 20
ACKNOWLEDGMENT 21
Jean-Philippe Masse (CM2) is acknowledged for his technical support. This work received 1
financial support through the National Science and Engineering Research Council (NSERC), 2
Grant CRD 385812-09. 3
ASSOCIATED CONTENT 4
Supporting Information. Applied models, rate constants and Avrami exponents for different 5
temperatures. This material is available free of charge via the Internet at http://pubs.acs.org. 6
REFERENCES 7
1. Voelcker, J., Electric Cars for Enlightened Stars. Spectrum, IEEE 2006, 43, 14-16. 8
2. Graham-Rowe, E.; Gardner, B.; Abraham, C.; Skippon, S.; Dittmar, H.; Hutchins, R.; 9
Stannard, J., Mainstream Consumers Driving Plug-in Battery-Electric and Plug-in Hybrid 10
Electric Cars: A Qualitative Analysis of Responses and Evaluations. Transportation 11
Research Part A: Policy and Practice 2012, 46, 140-153. 12
3. Thorat, I. V.; Joshi, T.; Zaghib, K.; Harb, J. N.; Wheeler, D. R., Understanding Rate-13
Limiting Mechanisms in LiFePO4 Cathodes for Li-Ion Batteries. J. Electrochem. Soc.
14
2011, 158, A1185-A1193. 15
4. Cornut, R.; Lepage, D.; Schougaard, S. B., Ohmic Drop in LiFePO4 Based Lithium
16
Battery Cathodes Containing Agglomerates. J. Electrochem. Soc. 2012, 159, A822-A827. 17
5. Padhi, A. K.; Nanjundaswamy, K. S.; Goodenough, J. B., Phospho-Olivines as Positive-18
Electrode Materials for Rechargeable Lithium Batteries. J. Electrochem. Soc. 1997, 144, 19
1188-1194. 20
6. Park, M.; Zhang, X.; Chung, M.; Less, G. B.; Sastry, A. M., A Review of Conduction 21
Phenomena in Li-Ion Batteries. J. Power Sources 2010, 195, 7904-7929. 22
7. Huang, Y.-H.; Wang, F.-M.; Huang, T.-T.; Chen, J.-M.; Hwang, B.-J.; Rick, J., Micro-23
Electrode Linked Cyclic Voltammetry Study Reveals Ultra-Fast Discharge and High 24
Ionic Transfer Behavior of LiFePO4. Int. J. Electrochem. Sci 2012, 7, 1205-1213.
25
8. Kuss, C.; Lepage, D.; Liang, G.; Schougaard, S. B., Ultrafast Charging of LiFePO4 with
26
Gaseous Oxidants under Ambient Conditions. Chemical Science 2013, 4, 4223-4227. 27
9. Lepage, D.; Sobh, F.; Kuss, C.; Liang, G.; Schougaard, S. B., Delithiation Kinetics Study 28
of Carbon Coated and Carbon Free LiFePO4. J. Power Sources 2013, in press.
29
10. Prosini, P. P.; Carewska, M.; Scaccia, S.; Wisniewski, P.; Passerini, S.; Pasquali, M., A 30
New Synthetic Route for Preparing LiFePO4 with Enhanced Electrochemical
31
Performance. J. Electrochem. Soc. 2002, 149, A886-A890. 32
11. Malik, R.; Abdellahi, A.; Ceder, G., A Critical Review of the Li Insertion Mechanisms in 33
LiFePO4 Electrodes. J. Electrochem. Soc. 2013, 160, A3179-A3197.
34
12. Rousse, G.; Rodriguez-Carvajal, J.; Patoux, S.; Masquelier, C., Magnetic Structures of 35
the Triphylite LiFePO4 and of Its Delithiated Form FePO4. Chem. Mater. 2003, 15,
4082-36
4090. 37
13. Burba, C. M.; Frech, R., Raman and Ftir Spectroscopic Study of LixFePO4 (0 ≤ x ≤ 1). J.
1
Electrochem. Soc. 2004, 151, A1032-A1038. 2
14. Khawam, A.; Flanagan, D. R., Solid-State Kinetic Models: Basics and Mathematical 3
Fundamentals. J. Phys. Chem. B 2006, 110, 17315-17328. 4
15. Allen, J. L.; Jow, T. R.; Wolfenstine, J., Kinetic Study of the Electrochemical FePO4 to
5
LiFePO4 Phase Transition. Chem. Mater. 2007, 19, 2108-2111.
6
16. Allen, J. L.; Jow, T. R.; Wolfenstine, J., Correction to Kinetic Study of the 7
Electrochemical FePO4 to LiFePO4 Phase Transition. Chem. Mater. 2012, 24, 1400-1400.
8
17. Bai, P.; Tian, G., Statistical Kinetics of Phase-Transforming Nanoparticles in LiFePO4
9
Porous Electrodes. Electrochim. Acta 2013, 89, 644-651. 10
18. Levi, M. D.; Sigalov, S.; Salitra, G.; Nayak, P.; Aurbach, D.; Daikhin, L.; Perre, E.; 11
Presser, V., Collective Phase Transition Dynamics in Microarray Composite LixFePO4
12
Electrodes Tracked by in Situ Electrochemical Quartz Crystal Admittance. The Journal 13
of Physical Chemistry C 2013, 117, 15505-15514. 14
19. Morgan, D.; Van der Ven, A.; Ceder, G., Li Conductivity in LixMPO4 (M = Mn, Fe, Co,
15
Ni) Olivine Materials. Electrochem. Solid-State Lett. 2004, 7, A30-A32. 16
20. Kuss, C.; Liang, G.; Schougaard, S. B., Atomistic Modeling of Site Exchange Defects in 17
Lithium Iron Phosphate and Iron Phosphate. J. Mater. Chem. 2012, 22, 24889-24893. 18
21. Yamada, A.; Kudo, Y.; Liu, K.-Y., Phase Diagram of Lix( MnyFe1−y)PO4 ( 0 ⩽ x ,
19
y ⩽ 1 ) J. Electrochem. Soc. 2001, 148, A1153-A1158. 20
21
TOC graphic 22