HAL Id: hal-01068486
https://hal.archives-ouvertes.fr/hal-01068486
Submitted on 25 Sep 2014
HAL is a multi-disciplinary open access
archive for the deposit and dissemination of sci-entific research documents, whether they are pub-lished or not. The documents may come from teaching and research institutions in France or abroad, or from public or private research centers.
L’archive ouverte pluridisciplinaire HAL, est destinée au dépôt et à la diffusion de documents scientifiques de niveau recherche, publiés ou non, émanant des établissements d’enseignement et de recherche français ou étrangers, des laboratoires publics ou privés.
Jérôme Douzet, Aurélie Galfré, Pedro Brantuas, Jean-Michel Herri
To cite this version:
Jérôme Douzet, Aurélie Galfré, Pedro Brantuas, Jean-Michel Herri. CO2 capture by using hydrates: 3) Sizing the gas/liquid transfer in bubble column. The 8th International Conference on Gas Hydrates, Jul 2014, Pékin, China. pp.t4-14. �hal-01068486�
CO2 CAPTURE BY USING HYDRATES:
3) SIZING THE GAS/LIQUID TRANSFER IN BUBBLE COLUMN DOUZET Jerome, GALFRE Aurélie, BRANTUAS Pedro, HERRI Jean-Michel(*)
Gas Hydrate Dynamics Centre, Ecole Nationale Supérieure des Mines de Saint-Etienne, 158 Cours Fauriel, 42023 Saint-Etienne, France,
(*) corresponding author [email protected]
ABSTRACT
The CO2 capture by using clathrates is a method which takes profit of the CO2 selectivity in gas hydrate to separate it from nitrogen, or other exhausting gases from gas combustion or coal combustion. The bottleneck is the operative pressure which still remains high and needs to be drop down to 0.5 MPa in order to compete with the reference case using Amines. After two national projects (SECOHYA, ACACIA) and a european program (iCAP), we tested different classes of thermodynamic additives, organic ones (water un soluble cyclopentane, water soluble THF) which form classical gas hydrates with structure SII, and ionic ones (Tetra-N-Butyl Ammonium Bromide, TBAB) which forms new types of structures.
In this presentation, we comment results from batch experiments showing that the crystallization is limited by the gas/liquid transfer. Then, we present a method to evaluate the size of a bubbling column operating a separation from a TBAB-CO2 semi clathrate hydrate crystallization. We explain how to design the flow rates, and the volume of the column as a function of the pressure.
Keywords: semi clathrates hydrates, gas separation, bubble column, sizing
INTRODUCTION
Modelling the kinetic of crystallization implies to model different levels.
The understanding of the overall process of crystallization implies to propose of population balance model coupled with a heat and mass balance.
The population model describes the crystallization at the scale of the particles , at the nano scale to describe the nucleation, at the micro scale to describe the local kinetic at the surface of the crystals under growing, at the milli scale to describe the interaction between particles by agglomeration and attrition.
The specificity of the crystallization of gas hydrate is that one the reactant, gas molecules, is fed to the reaction at the hydrate surface after crossing different interfaces. The nature and the surface of interfaces depend on type of technology that is retained to operate the crystallization.
The simplest situation corresponds to the crystallization of gas hydrate in a single liquid phase, composed of pure water. In this case, gas molecules have to cross only the gas/liquid interface, and the bulk phase.
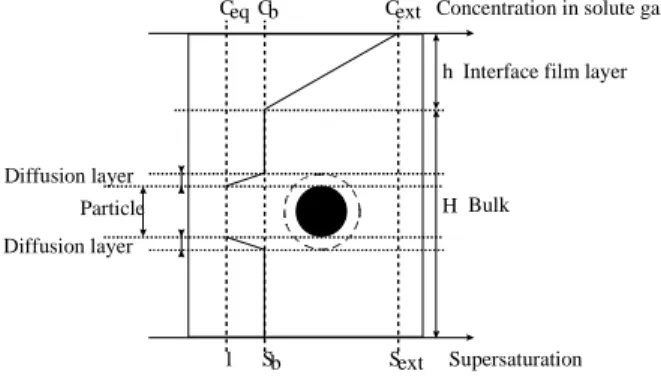
If the reaction is operated in a stirred reactor, or a bubble reactor, the bulk solution can be considered as homogeneous. In the stirred reactor, three zones can be distinguished as pointed by Vysniauskas and Bishnoi (1983). Supersaturation is defined as S=C/Ceq in which C is the concentration in dissolved gas and Ceq is the equilibrium concentration. We define supersaturation for each gas component.
Concentration in solute gas Ceq Cb Cext
Supersaturation Sext
Sb 1
Interface film layer h Bulk Particle Diffusion layer Diffusion layer H
Figure 1 : Schematic of the concentration profiles in the environment of a hydrate particle in a liquid
bulk
- the first zone is the interface layer. In the investigated system, its thickness is about a few tens of micrometer. Because of the high
supersaturation level of this zone compared to the rest of the reactor, primary nucleation is particularly active in the interfacial film which acts most of the time as a source of nuclei for the bulk of the reactor.
- the second zone is the bulk zone in which the concentration is supposed to be uniform. This zone is supposed to be the main place of the crystallisation process in which we can find all the classical steps of growth, agglomeration, and secondary nucleation.
- The third zone is the solid/liquid interface. The crystal is assumed to be surrounded by two successive layers: an integration layer and a diffusion layer. The integration layer is the region of volume in which a transition between the solid state and the liquid state occurs. The integration layer can be considered as a solidification layer.
First works were developed in Canada with Vysniauskas and Bishnoi (1983) and then completed by Englezos et al (1987a and b). The authors identified a mass transfer limiting step at the gas liquid interface, or a growth rate limiting step at the vicinity of the elementary particles, depending on the stirring rate. In 1994, Skovborg and Rasmussen analyzed again those results and demonstrated that the limiting step remains the gas/liquid mass transfer whatever the stirring rate. This conclusion has been supported by Herri et al (1999a) and Pic et al (2000) from experimental results obtained by using a new particle size analysis tool (Herri et al, 1999b).
So, even in the simplest situation, the principal teams working on the subject propose different approach. The degree of precision of the model is widely dependent on the possibility to monitor the population of particles. So, this modeling has been driven for decades by the development of new sensors adapted to the high pressure conditions during crystallization. First experiments have consisted in studying the gas consumption rate and coupling with a population balance in order to propose a model between the size and the number of crystals, and the quantity of gas consumed. So, it can be said that, even in the simplest case consisting in crystallizing gas hydrates in pure water, the authors doesn’t agree on the limiting step. A fruitful reading is the reviewing from Ribeiro and Lage (2008).
In presence of promoters, the modelling becomes more complex for four reasons:
-The promoter is a new reactant. The model needs
to takes into consideration the steps of diffusion from the source to the reaction.
-The source of the promoter depends on its miscibility. Peralkylonium salts such as
Tetra-N-Butyl Ammonium Bromides, or organic
compounds such Tetra Hydro Furan are perfectly or well miscible with water. The liquid solution is a single phase. Organic compound such as cyclo-Pentane is not miscible and the source of the reactant remains in a separate phase. The liquid solution is a double phase which geometry can be an emulsion, or two separate phases. -The crystal to be formed is sI, sII, or sH structure
in presence of organic promotors. If promoters are peralkylonium salts, the structure belongs to the semi clathrate hydrates.
-The localisation of the reaction need to be precise. Do the construction of the solid structure is operated in the bulk or at an interface? For example, a complex situation could be to operate the crystallization in a water in cyclo pentane emulsion (Galfré et al, 2014), with water from the emulsion, cyclopentane from the bulk, and gas form the gas phase. The solid could form a crust around the particle, block the transfer of molecules and stop the crystallisation.
Due to all the possible mass transfer limitations, a consequence is to consider that crystallization can be operated outside thermodynamic equilibrium conditions. Theoretical consequences of this non equilibrium state during crystallization have been evaluated by Herri and Kwaterki (2012). It results in a hydrate composition which is different from equilibrium and enriched in the gas with the better liquid diffusivity, and/or the better liquid solubility and/or the higher gas concentration.
From a practical point of view, there is a competition in between the gas molecules to be “enclathrated” in the solid structure under growing. In the specific case of CO2/N2 TBAB semi-clathrate formation, it results in an considerable CO2 enrichment of the solid phase, as discussed in the paper 1/4 of this series of four papers, and reported on Figure 2. We report here that, if the CO2 separation is operated in a “Bulk”
reactor at a gas molar fraction
2
0.2
Bulk CO
y
>
, thanthe hydrate composition is practically 100% CO2.
0 0.2 0.4 0.6 0.8 1 1.2 0 0.2 0.4 0.6 0.8 1 1.2 CO2 mole fraction in gas
C O 2 m o le f ra c ti o n i n h y d ra te this work
40% TBAB Duc et al, 2007 SI - 283.15K
SI - 288.15K
Figure 2: Selectivity of the separation of CO2 from
N2 during crystallization of semi-clathrate hydrates
from TBAB solution, and comparison to the selectivity of clathrate hydrate of structure SI. From this experimental observation, it is so possible to conceptualize a Bulk reactor which can crystallize a 100% pure CO2 semi-clathrate hydrate.
The design implies to evaluate the volume
3
L
V m of this type of reactor, here assuming a bubble reactor, to capture a given rate of CO2
2
1
.
CO
r mol s− . We size the volume flow rates
of TBAB solution to handle, as a function of the operative conditions, i.e. the temperature and the pressure. The TBAB solution is assumed to be a 32 %mass TBAB solution which forms a solid S38 structure (see paper 2/4 of this series of four papers) at the congruent conditions. The TBAB/H2O compositions are so identical in the liquid and in the solid phases. The temperature of the congruent point is 10.38°C.
MODELLING GAS/LIQUID TRANSFER The Gas/Liquid transfer through the interface liquid film layer of thickness h (Figure 1) is a first order law consistent with the well-known relation: (Mehta and Sharma, 1971; Sridharan and Sharma, 1976) :
(
, ,)
i i L i ext i bulk L G r =k a C −C V + (1) 1 . ir mol s − is the dissolution rate of component
i, a m −1a is the mass transfer surface area per unit of volume of liquid and kLm s. −1the mass transfer coefficient, Ci bulk, mol.m-3 is the gaz component i concentration in the liquid bulk,
-3 , mol.m
i ext
C is the interfacial concentration,
and
V
L G+ is the liquid volume plus the volume of gas that is eventually dispersed.GAS/LIQUID TRANSFER IN BATCH
REACTOR
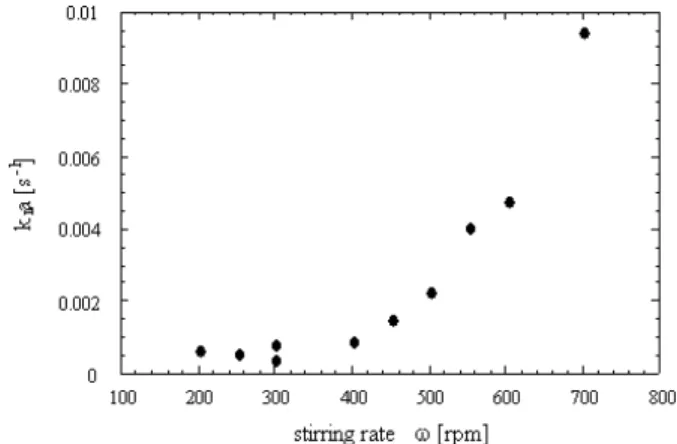
The Figure 3 plots the experimental determination of the k aLi value in the case of i=methane.
Figure 3 : Influence of the stirring rate on the rate of methane absorption in a stirred batch
reactor(Herri, 1999a)
There is a clear change of behaviour at a stirring rate of 400 rpm. It corresponds to the change in the vortex shape around the stirrer, when gas begin to be sucked to generate bubbles which contribute to increase the total surface of the Gas/Liquid interface. At low stirring rate, the Gas/liquid surface is flat and the regime is laminar over the bulk volume. At high stirring rate, the vortex reaches the stirrer blades, the bubble dispersion is maximum, and the regime is turbulent. The maximum k a sL −1value for such a system is 0.01.
GAS/LIQUID TRANSFER IN BUBBLE
In a bubble reactor, the dispersion of the gas bubbles enhances the gas/liquid interface and enhances the gas transfer rate. If the gas bubbles are assumed to be homogeneous in their (diameter
[ ]
b
d m ), and if the dispersion of nbubbles gas
bubbles is considered to be homogeneous in the volume of the reactor, the mass transfer surface area per unit of volume can be written under the form: 2 bubbles b L G n d a V
π
+=
(2) L GV + is the total volume of liquid plus the volume of gas that is dispersed :
1 L L G G V V
ε
+ = − (3)But also, the gas holdup can be expressed under the form: 3 6 bubbles b G L G n d V
π
ε
+ = (4)From Eq.(2) and Eq.(4), we get:
6
g b
a
d
ε
=
(5)And the Eq.(1) becomes:
(
, ,)
2 6 1 i G L i i ext i bulk H O L b G k r x x C V dε
ε
= − − (6)(
, ,)
2 i i L L i ext i bulk H O L r =k a x −x C V (7) 1 6 i i G L L L b G k k a dε
ε
− = (8)Where the driving force
(
Ci ext, −Ci bulk,)
in Eq.(1) is now expressed differently in function of themolar fraction xi of component i, and
concentration of solvent 2 -3 mole.m H O C The liquid mass transfer coefficient is determined from Christi (1989) and was used by Hashemi et
al. (2009) to model CO2 gas/liquid transfer in a
bubble column:
( )
( )
(
)
1 2 2 5 3 2 5.63 10 exp 131 L L i i L L b g D k dρ
σ
µ
φ
− = × × − (9)where D im .s2 -1 is the gas diffusivity in the
liquid phase,
µ
LPa.s-1 is the viscosity of the liquid,),σ
LN.m-1is the surface tension of the liquid,),ρ
Lkg.m-3 is the density of the solution, g =9.81m.s-2is the gravity,φ
is the solid volume fraction in the liquid phase (see Annexes)The gas holdup (
ε
G) can be calculated by Eq.(10) from Akita and Yoshida (1974). Luo et al. (2007) used this equation to describe their results during the cristallisation of methane hydrate in a bubble column with TetraHydroFuran as an additive:(
)
4 1 1 2 12 2 8 31
G G L L G R R L L Rε
ε
u
d
g
gd
gd
ρ
ρ
α
σ
µ
−
=
(10)where dR is the column diameter, uG is the superficial gas velocity defined by Eq.(11), as the velocity of the gas injected in the column at a volumic rate
Q
G
m s
2.
−1
.α
is equal to 0.2 for pure liquids or non electrolyte solutions or α is 0.25 for salt solutions.2
4
G R G
Q
=
π
d
⋅
u
(11)Gas–liquid interphase mass transfer was
investigated by Hashemi et al (2009) in a slurry
bubble column under CO2 hydrate, without
hydrate crystallization, but in the presence of foreign particles (up to 10% vol.) to simulate the
hydrate physical properties affecting the
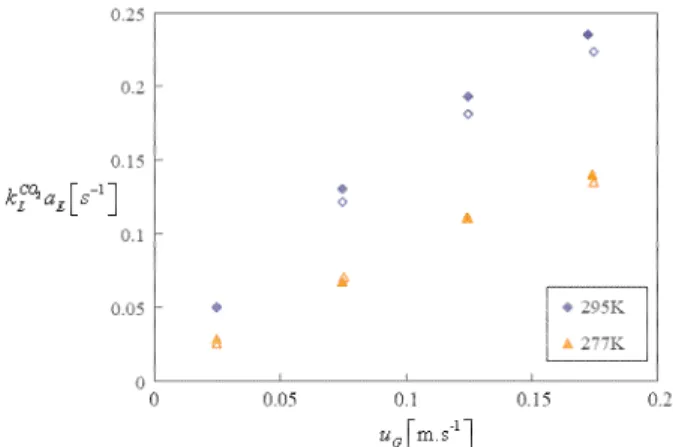
hydrodynamics. The volumetric mass transfer coefficient ( CO2
L L
k a in Eq.7) and gas holdup (
ε
G) increases (Figure 4 and Figure 5) with thesuperficial gas velocity (uG ) but in a manner (Eq.8) that doesn’t affect the kLi db value which
remains constant over uG, but dependent on the
pressure (Figure 6).
Figure 4 : Mass transfer coefficient CO2
L L
k a values
versus the superficial gas velocity uG at pressure of 2.5MPa, 277K and 295K, and solid fraction of
0%Vol. (open symbol) and 10% Vol.(solid symbol) (from Hashemi et al, 2009)
Figure 5 : gas holdup
ε
Gvalues versus the superficial gas velocity uG at pressure of 2.5MPa,277K and 295K, and solid fraction of 0%Vol. (open symbol) and 10% Vol.(solid symbol) (from
Hashemi et al, 2009)
Hashemi et al (2009) underline that Eq.9 is partially valid. At atmospheric pressure and zero solid concentration, the value of kLi db is given to 0.073 s-1 using the correlation proposed by Christi (1989) and their average experimental value (Figure 6) is 0.075 s-1. At 2.5 MPa, the average
experimental kLi db is 0.067 at ambiant
temperature and 0.046 at 277K whereas the respectives values predicted by Eq.9 are 0.072 and 0.025. It can be said that Eq.9 is valid at ambiant temperature, and underestimates kLi db at lower temperature.
Also, they didn’t observe any significant influence of the solid concentration up to 10%vol. (Figure 5) whereas kLi db in Eq.9 is decreased by 73% as the solid concentration is 10%.
Figure 6 : kLi dbvalue versus the superficial gas velocity uG and pressure (from Hashemi et al,
2009)
OPERATIVECONDITIONS
We recall here the numeric data and correlations given in the paper number 2/4 of this series of four papers.
The maximum gas storage capacity of the TBAB, 38H2O structure is given by : 3 38,
3191
.
STORAGE S Maxn
=
mole m
− (12) It corresponds to a maximum storage volume of3 3
38,
76.6
.
STORAGE S MAX
V
=
m STP m
− (13) The effective storage capacity takes into account the occupancy of cavitiesθ
j by component j. It depends on thermodynamics.38, 38,
STORAGE STORAGE S j j S Max
The Liquid solution is TBAB solution at a weight fraction of wTBABL =0.32 . We can evaluate the
mole number of water per volume of liquid solution: 3 ,
38954
.
STORAGE water Ln
=
mole m
− (15) So, the Liquid storage capacity of gas components j is given by: , , , STORAGE STORAGE j L water L j Ln
=
n
x
(16)[
]
, / j Lx mole of component j mole of water is the solubility of the component j.
The equilibrium pressure is fixed by the difference of temperature between the operative temperature
[ ]
Bulk
C
Θ
°
and the value of 10.38°C at which thepure TBAB semi-clathrate of structure S38 can form from a liquid solution at a TBAB mass
fraction of 0.32.. From the complete
thermodynamic modelling, we have determined the operative pressure of a capture process
[
]
,
P
Bulk eqMPa
from the following correlation:(
)
(
)
(
)
3 -3 , 2 -3 -1 P = 3.687 10 10.38 - 7.839 10 10.38 + 2.035 10 10.38 Bulk eq Bulk Bulk Bulk ⋅ Θ − ⋅ Θ − ⋅ Θ − (17)The operative pressure cannot be lower to 2 ,
P
Bu k eqly
CBulkO . 2 Bulk COy
is the average mole fraction of CO2 in the gas phase of the bubble column. We assume the operative pressure to be higher and fixed by a coefficient q:2
,
P
Bulk=
q
.P
Bulkeqy
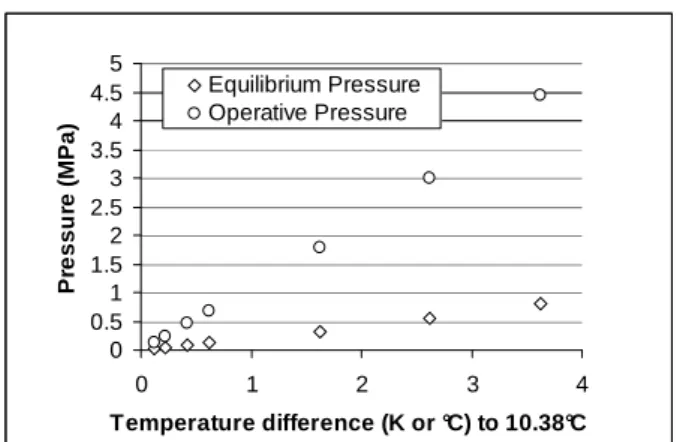
COBulk (18)The value of q is fixed to 1.1. In , Figure 7 we can see that Equilibrium Pressure and Operative Pressure increase rapidly by MPa orders of magnitude once the temperature is increased.
Also, the thermodynamic modeling has allowed determining the occupancy factor of the cavities, independently of the gas hydrate former.
(
)
(
)
2 -3 -1 = -3.719 10 10.38 + 9.926 10 10.38 Bulk Bulkθ
⋅ Θ − ⋅ Θ − (19) 0 0.5 1 1.5 2 2.5 3 3.5 4 4.5 5 0 1 2 3 4 Temperature difference (K or °C) to 10.38°C P re s s u re ( M P a ) Equilibrium Pressure Operative PressureFigure 7: Equilibrium and Operative Pressure in the bulk reactor as a function of the Operative Temperature. The composition in the bulk gas phase is assumed to be 2,min
0.2
Bulk COy
=
. The over pressure coefficient q is q=1.1. RHEOLOGYThe acceptable solid fraction of the slurry (Φ) is a key parameter, because it fixes the liquid fraction of TBAB solution to inject in the reactor. The higher the solid fraction, the lower the slurry flow rate, but the higher the viscosity of the slurry. The volume fraction of solid (Φ), at the exit of a Bulk reactor, or a Finisher Reactor (see paper 4/4 of this series of 4 papers), is given by:
,
, ,
OUT Bulk hyd
OUT Bulk OUT Bulk hyd L
Q
Q
Q
Φ =
+
(20)Where QLOUT Bulk or Finisher, [ m s3. −1 ] is the liquid volume flow rate, and
Q
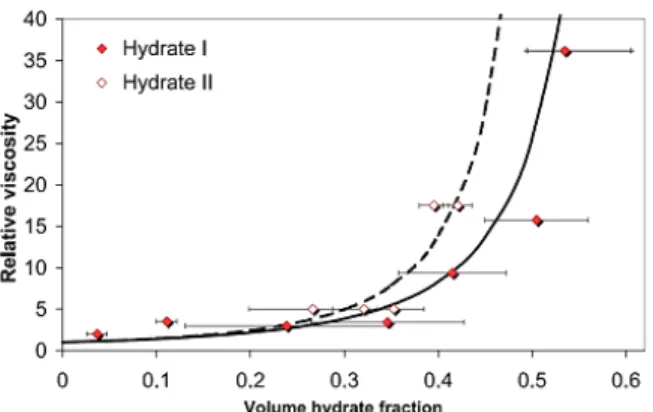
hydOUT Bulk or Finisher, is the hydrate volume flow rate. The value of Φ is around 1/3 so that the slurry is not too viscous.Figure 8 : Relative viscosity of a TBAB hydrate slurry as a function of the volume hydrate fraction (Φ). The relative viscosity is the ratio between the viscosity of the slurry and the viscosity of the pure liquid phase. Hydrate I is Structure S26 and Hydrate II is structure S38 (Darbouret et al, 2005) KINETICS
It is assumed that the bulk reactor operates in a
Gas/liquid transfer limited regime. The
temperature in the bulk reactor is ΘBulk
[ ]
°C and the corresponding equilibrium pressure of the pureCO2 semi clathrate hydrate of TBAB is
[
]
,
Bulk eq
P MPa , given in Eq. 17:
2 2 w 2 , , , L , H, , w w o ( , ) Bulk G CO OUT Bulk CO e L C q O Bulk x k T p P σ
φ
=(21)
The values of the Henry constants
w L , H, , w w o ( , ) j
k T p σ are retrieved from experimental
values, or from correlations (Galfré et al, 2014). It is assumed that the solubility of gaseous component into TBAB solution is similar to the solubility of gaseous components in pure water.
2
G CO
φ
is the fugacity coefficient.The bulk reactor is assuming to work at a CO2 mole fraction
2,min
0.2
Bulk CO
y
=
. At such acomposition, the semi-clathrate hydrate is a practically pure CO2 hydrate (see paper 1/4 of this
series of 4 papers). The other gas components are not consumed during the crystallization, and they
are in physical equilibrium with the liquid phase at pressure Pbulk
[
MPa]
given in Eq.18:w , , L , H, , w w o ( , ) Bu Bulk G j j OUT Bulk j L j Bulk lk y x k T p P σ
φ
=(22)
The bulk and finisher reactors are considered as homogeneous reactors in which the crystallization rate is limited by the gas/ liquid mass transfer:
(
, ,)
2 6 1 i G L i i ext i bulk H O L b G k r x x C V dε
ε
= − −(23)
2, CO extx is calculated from Eq.22 and
2,
CO bulk x is calculated from Eq.21. The mass transfer coefficient kLi db can be determined from the work Hashemi et al (2009) which use a modified correlation from Eq.9 under the following form:
( )
( )
1 2 2 5 3 5.63 10 L L i i L L b g D k dρ
σ
µ
− = × (24)
In water system, Eq.24 gives values of kLi db in the range 0.055 0.080s− −1 depending on the temperature and operative pressure. In TBAB solution ( wTBABL =0.32 ) the calculated kLi db
value is lower because of the higher viscosity of the TBAB-water liquid solution. For example, in
the temperature range of :
-1 9.2-7.0 mPa.s L
µ
= and 1 0.013 0.028 i L b s k d = − − DESIGNWe propose a flow sheet in two stages, a bulk reactor and a finisher. The bulk reactor operates with a gas phase at a mole fraction higher than 0.2 in order to form a pure CO2 hydrate. The finisher captures the remaining CO2 in order to feet the specifications, especially to recover CO2 up to design fraction RECOV.
The flowsheet is given in detail in the paper 4/4 of this series of papers, and we focus here in the sizing of the bulk reactor.
SIZING
In the bulk reactor, a bubble column, we assume a realistic gas holdup (for example
ε
G =0.3), so the volume of reactor can be determined from Eq.25:(
)
2 2 2, 2, 26
1
CO L CO G L CO ext CO bulk H O b Gr
V
k
x
x
C
d
ε
ε
=
−
−
(25)
Where 2 1 . COr mol s− is the rate of CO2 to capture
in the hydrate phase.
Once the operative temperature is fixed, the equilibrium pressure is fixed (Eq. 17), and also is fixed the occupancy of gas in the hydrate structure (Eq.19). So, we can evaluate the flow rate of hydrate to handle which has captured the equivalent of 2 1 . CO r mol s− : 2 38 , , STORAGE j S CO OUT B Max ulk hyd r n Q
θ
⋅ =(26)
It is also possible to evaluate the liquid flow rate from the consideration that the slurry viscosity can not be too much high. So the solid content can not excess a value ΦMAX (to be designed precisely) which can be around the value of ΦMAX =0.3
(see Figure 8)
, 1 ,
OUT Bulk MAX OUT Bulk
L hyd
MAX
Q = − Φ Q
Φ (27)
Figure 9 and Figure 10 shows a parametric study on q (given in Eq.18) at constant operative pressure of 10 MPa. This pressure is a high level of pressure, and we will discuss the appropriate level to retain, in paper 4/4 of this series of 4 papers.
If q is increased, the mass transfer driving force
(
xCO ext2, −xCO bulk2,)
is increased, and the volumeof reactor (Figure 10) is decreased, following
Eq.25. But on another hand, increasing q at constant operative pressure results in decreasing the equilibrium pressure, by decreasing the operative temperature (Figure 9), and finally, it decreases the gas content in the hydrate phase (Eq.19) and the bottom hydrate volume flow rate is increased in proportion. P=10 MPa 0 1 2 3 4 5 6 7 1 1.2 1.4 1.6 1.8 2 Over Pressure Coefficient q
O v e r te m p e ra tu re [ K o r °C ] 0.8 1 1.2 1.4 1.6 1.8 2 P u re C O 2 e q u il ib ri u m p re s s u re [ M P a ]
Figure 9 Bulk reactor operative conditions to operate at a total pressure of 10MPa. The over pressure coefficient q is given in Eq.18. The over
temperature is the difference between the operative temperature and the temperature at the
congruent point (10.38°C). P=10 MPa 0 200 400 600 800 1000 1200 1400 1600 1800 2000 1 1.2 1.4 1.6 1.8 2 Over Pressure Coefficient q
B u lk r e a c to r L iq u id v o lu m e [m 3 ] 0 2 4 6 8 10 12 V o lu m e r a te [ m 3 /s ]
Figure 10. Bulk reactor liquid volume and hydrate bottom volume flow rate. The over temperature is
the diffence between the operative temperature and the temperature at the congruent point
ANNEXA:VISCOSITY
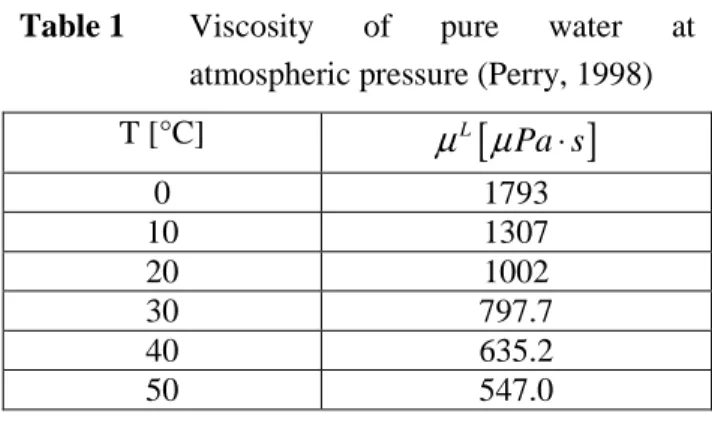
PURE WATER VISCOSITY
Table 1 Viscosity of pure water at
atmospheric pressure (Perry, 1998)
T [°C] L
[
]
Pa sµ µ
⋅ 0 1793 10 1307 20 1002 30 797.7 40 635.2 50 547.0TBAB SOLUTION VISCOSITY
The viscosity
µ
L of the TBAB solution has been measured by Douzet (Ph.D. work, 2011) asfunction of temperature in the range
[ ]
4≤ Θ ° ≤C 21 and TBAB mass fraction in the
range 0.08≤wTBABL ≤0.4 . He proposed the
following correlation:
(
)
(
)
2 2 224 22.39 5.6007 58 6.18 1.2116 ln L L L TBAB TBAB L L TBAB TBAB w w w wµ
= − + + − + − Θ (28)[
]
LmPa s
µ
⋅
is given with an average precision of4.25%
ANNEXB:DENSITY
PURE WATER DENSITY
Table 2 Density of pure water at atmospheric
pressure (Perry, 1998) T [°C] L 1 g cm
ρ
⋅ − 0 0.99984 10 0.99970 20 0.99821 30 0.99565 40 0.99222 50 0.98803TBAB SOLUTION DENSITY
At temperature in the range [24°C - 10°C] and TBAB mass fraction ( wTBABL ) in the range [0.2 - 0.4], the density of TBAB aqueous solution varies from 1021 to 1039kg/m3 (Darbouret et al, 2005, Obata et al, 2003, Belandria et , 2009).
From these data, Douzet (2011) has proposed a correlation with a precision of 0.1%
1000 99.7
L L
TBAB w
ρ
= + (29)ANNEXC:SURFACE TENSION
PURE WATER SURFACE TENSION
Table 3 Surface Tension of pure water at
atmospheric pressure (Perry, 1998) (est-ce bien la meme source que la table 2 du coup?) T [°C] L 1 mN m
σ
⋅ − 0 75.63 10 74.23 20 72.75 30 71.20 40 69.60 50 67.94TBAB SOLUTION SURFACE TENSION
The surface tension (
σ
L ) is determined using equation 4 based on the work of Tamaki (1974).1 . L st TBAB st TBAB mN m A C B C
σ
− = + (30)where Ast and Bst are constants depending on the ion and alkyl chain in the tetra-alkyl ammonium molecule; for TBAB, Ast is 17 and Bst is 160;
3
.
TBAB
C mol dm− is the molar concentration of TBAB (Eq.31). The surface tension is obtained in dyne.cm-1 which is the same as mN.m-1 (the S.I. unit is N.m-1).
L L TBAB TBAB TBAB
w
C
M
ρ
=
(31)ANNEXD:DIFFUSIVITY IN WATER SOLUTIONS
An empirical correlation given Eq.32 has been proposedby Funazukuri et al. (1995) for predicting binary/pseudo binary diffusion coefficients of carbon dioxide in water and in aqueous electrolytic solutions,
( )
14 12 0.92221.013 10
LD
T
µ
−×
=
(32)Where,
D
12 is diffusion coefficient [m2/s], T is temperature [K], andµ
is viscosity [Pa s]. The average absolute deviation AAD for this correlation is 5.6% for the literature data onD
12of CO2 in water with number of data points N of
79 and 3.9% (N = 103) for those in aqueous electrolytic solutions.
Akita, K., Yoshida, F., 1974, Bubble size, interfacial area, and liquid-phase mass-transfer coefficient in bubble columns, Industrial & Engineering Chemistry Process Design and Development
Belandria, V., Mohammadi, A., Richon, D., 2009, Volumetric properties of the (tetrahydrofuran + water) and (tetra-n-butyl ammonium bromide + water) systems: Experirental measurements and correlations., J. Chem. Thermodynamics 41 (2009) 1382-1386
Christi, M.-Y., 1989, Airlift Bioreactors, New York, Elsevier Science Publishers
Darbouret, M., Cournil, M. and Herri, JM., 2005, Rheological study of TBAB hydrate slurries as
secondary two-phase refrigerants ,
International Journal of Refrigeration, Vol. 28, Issue 5, pp. 663-671
Douzet, J., 2011, Conception, construction, experimentation et modélisation d’un banc d’essai grandeur nature de climatisation utilisant un fluide frigoporteur diphasique à base d’hydrates de TBAB, Ph.D., Ecole
Nationale Supérieure des Mines de Saint-Etienne, France.
Englezos, P., Kalogerakis, N., Dholabhai, P.D. and Bishnoi, P.R.,1987a, Kinetics of Gas Hydrate Formation of Methane and Ethane Gas Hydrates, Chemical Engineering Science, 42, No.11, pp. 2647-2658.
Englezos, P.; Dholabhai, P.; Kalogerakis, N.; Bishnoi, P.R.; 1987b, “Kinetics of gas hydrate formation from mixtures of methane and ethane”; Chem. Eng. Sci., 42, (1987b) 2659-2666
Galfré, A., Kwaterski, M., Brantuas, P., Cameirao, A., Herri, J.M. 2014, Clathrate hydrate equilibrium data for the gas mixture of carbon dioxide and nitrogen in the presence of an emulsion of cyclopentane in water, Journal of Chemical & Engineering Data, 59 (2014) 592– 602
Hashemi , S., Macchi, A., Servio, P., 2009, Gas-Liquid mass transfer in a slurry bubble column operated at gas hydrate forming conditions, Chemical Engng. Sci. 64, 3709-3716
Herri, J.M., Pic, J.S., Gruy, F. and Cournil, M.,
1999a, Methane Hydrate Crystallization
Mechanism from In-Situ Particle Sizing, AIChE Journal, Vol. 45, No. 3., pp. 590-602 Herri, J.-M., Gruy, F., Pic, J.S., Cournil, M.,
Cingotti, B.,Sinquin, A., 1999b, Interest of in situ particle size determination for the characterization of methane hydrate formation. Application to the study of kinetic inhibitors., Chemical Engineering Science, Vol. 54, No. 12, pp. 1849-1858
Herri, J.M., Kwaterski, M., 2012, Derivation of a Langmuir type of model to describe the intrinsic growth rate of gas hydrates during crystallization from gas mixtures, Chemical Engineering Science (81)28-37
Luo, Y.-T., Zhu, J.-H., Fan, S.-S., Chen, G.-J., 2007, Study on the kinetics of hydrate formation in a bubble column, Chem. Engng. Sci. 62, 1000-1009
Mehta, A.P., Sloan, E.D., 1996. Improved thermodynamic parameters for prediction of structure H hydrate equilibria, 42(7), 2036-2046
Obata, Y., Masuda, N., Joo, K., Katoh, A., 2003. Advanced Technologies Towards the New Era of Energy Industries. NKK Technical Review No.88, 103-115.
Perry’s Chemical Engineers’s Handbook, McGRAW-HILL International Editions, Sixth Edition,1984
Pic, J.S., Herri, J.M, and Cournil, M. , 2000,
Mechanisms of Methane Hydrate
Crystallization in a Semibatch Reactor,
Influence of a Kinetic Inhibitor:
Polyvinylpyrrolidone, Annals of the New York Academy of Sciences, 912, pp. 564-575. Ribeiro, C. P.; Lage, P.L.C.; 2008, Modelling of
hydrate formation kinetics: State-of-the-art and future directions; Chem. Eng. Sci. 63, 2007-2034.
Skovborg, P. and Rasmussen, P., 1994, A Mass Transport Limited Model for the Growth of
Methane and Ethane Gas Hydrates, Chemical Engineering Science, 49, No.8:1131-1143 Sridharan, K., and M.M. Sharma, 1976, New
systems and methods for the measurement of effective interfacial area and mass transfert
coefficients in gas-liquid contactors »,
Chemical Engineering Science 31, 767-774 Tamaki, K., 1974, The surface activity of
Tetra-n-alkylonium halides in aqueous solurions. The effect of hydrophobic hydratation, Bulletin of the Chemical Society Japan 54, 2260-2267 Vysniauskas, A. and Bishnoi, P.R., 1983, A
Kinetic Study of Methane Hydrate Formation, Chemical Engineering Science, 38, No.7, pp. 1061-1072.