OATAO
O
pen
A
rchive
T
oulouse
A
rchive
O
uverte
(OATAO)
OATAO is an open access repository that collects the work of some Toulouse
researchers and makes it freely available over the web where possible.
This is
version published in:
Official URL:
To cite this version:
Any correspondence concerning this service should be sent to the repository administrator: tech-oa [email protected] p-toulouse .fr
https://doi.org/10.1186/s12864 018 5415 1
RNA-seq analysis of hepatic gene
expression of common Pekin, Muscovy,
mule and hinny ducks fed ad libitum or
overfed
Frédéric Hérault1, Magalie Houée Bigot2, Elisabeth Baéza3, Olivier Bouchez4
.s,
Diane Esquerré4•5,Christophe Klopp6•7 and Christian Diot1"
Abstract
Background: Duck species are known to have different susceptibility to fatty liver production in response to overfeeding. ln order to better describe mechanisms involved in the development of hepatic steatosis and differences between species, transcriptome analyses were conducted on RNAs extracted from the livers of Pekin and Muscovy duck species and of their reciprocal hybrids, Mule and Hinny ducks fed ad libitum or overfed to identify differentially expressed genes and associated functions.
Results: After extraction from the liver of ducks from the four genetic types, RNAs were sequenced and
sequencing data were analyzed. Hierarchic clustering and principal component analyses of genes expression levels indicated that differences between individuals lie primarily in feeding effect, differences between genetic types being less important. However, Muscovy ducks fed ad libitum and overfed were clustered together. lnterestingly, Hinny and Mule hybrid ducks could not be differentiated from each other, according to feeding. Many genes with expression differences between overfed and ad libitum fed ducks were identified in each genetic type. Functional annotation analyses of these differentially expressed genes highlighted some expected functions (carbohydrate and lipid metabolisms) but also some unexpected ones (cell proliferation and immunity).
Conclusions: These analyses evidence differences in response to overfeeding between different genetic types and help to better characterize functions involved in hepatic steatosis in ducks.
Keywords: RNA sequencing, Differentially expressed genes, Overfeeding, Hepatic steatosis, Ducks
Background
In western human populations non-alcoholic fatty liver disease (NAFLD), i.e. fat accumulation in the liver, rep-resents the most common cause of abnormal liver func-tion [l]. This hepatic steatosis is associated with overeating of energy-rich food (e.g. high sugar or high fat diet). In terms of human health, NAFLD is frequently associated with various forms of metabolic disorders in-cluding obesity, insulin resistanœ and type 2 diabetes. • Correspondence: [email protected]
'PEGASE, INRA Agrocampus Ouest 16 Le Clos, 35590 Saint Gilles,
France Full list of author information is available at the end of the
article
Increased futty acids (FA) hepatic synthesis or de novo lipogenesis is known as one major cause of hepatic stea-tosis and is linked to overexpression of lipogenic genes (2-5]. In addition, hepatic steatosis is also linked to in-creased FA uptake, dein-creased FA -oxidation and/or de-creased synthesis or secretion of very low density
lipoproteins (VLDLs) (6, 7]. Expression of adipokines
was also demonstrated to play a role in the development
of hepatic steatosis (8-10]. From a clinical point of view,
NAFLD is the early step of a sequence of syndromes in-cluding steatohepatitis (NASH), fibrosis and cirrhosis and is now considered an inducer of many distinct
injurious factors [11]. It is also known that patients with hepatic steatosis do not always develop necroinflamma-tion or liver fibrosis [12] indicating individual variability in liver disease susceptibility due to genetic and/or envir-onmental factors [13,14]. Altogether, these results indi-cate that hepatic steatosis is the result of a large number of metabolic processes, gene expressions and factors that still need to be characterized.
Recently, it was suggested that NAFLD and hepatic steatosis in overfed birds are very similar [15]. Indeed, liver steatosis can occur spontaneously in wild water-fowls as a result of energy storage before migration. This ability is exploited since thousand years in domesticated birds to produce “foie gras” by overfeeding. In these birds, hepatic steatosis exists in isolation, a degenerative event rarely occurs, and it is reversible when overfeeding is stopped [16]. Genetic effects are also known to play a role in waterfowl ability to produce fatty liver [16–20]. Some evidence suggests that the genetic differences ob-served in liver steatosis ability between different duck breeds or species are in some part the result of differ-ences in de novo lipogenesis [20], lipoprotein assembly and secretion [16,20] and extrahepatic uptake of plasma lipids [19]. Until recently, most of these studies focused on the expression of some genes involved in lipid metab-olism as tools for duck genome-wide gene expression were unavailable. It was thus demonstrated that genes involved in carbohydrates and lipid metabolisms were regulated by overfeeding in ducks [21,22].
The recent emergence of next generation sequencing (NGS) techniques allows the analysis of genes expressed from a whole genome by RNA sequencing. The present study was thus conducted to analyze genome-wide gene expression in Muscovy ducks (Cairina moschata) and common Pekin (Anas platyrhynchos) duck species and in their reciprocal inter-specific hybrids, i.e. Mule ducks (the sterile hybrid from a male Muscovy duck and a fe-male common duck) and Hinny ducks (the sterile hybrid from a male common duck and a female Muscovy duck). Analysis of differentially expressed genes in these 4 gen-etic types and comparison between species were also conducted in order to evidence similarities and differ-ences of responses to overfeeding in these genetic types that are (Muscovy and Mule ducks) or not (Pekin and Hinny ducks) used for“foie gras” production.
Methods
Animals and experimental design
Animals and experimental design have been described previously [20]. Briefly and as described in this publica-tion, male ducks corresponding to common Pekin (Anas platyrhynchos) and Muscovy (Cairina moschata) duck species and to their two reciprocal interspecific Mule and Hinny hybrids (24 per genotype) were provided by
Grimaud (Roussay, France). They were reared under usual conditions of light and temperature at the Experi-mental Station for Waterfowl Breeding (INRA Arti-guères, France). From hatching to 6 weeks of age, they were fed ad libitum. From 6 to 12 weeks of age, they were fed on a restricted diet at levels appropriate for each genotype (200–250 g per duck at the beginning, in-creasing to 360–380 g at the end of the period). At 12 weeks of age, ducks were either fed ad libitum with the growing diet (controls) or overfed 14 days with high carbohydrate corn and corn meal. This overfeeding with high carbohydrate diet is referred thereafter as overfeed-ing. Ducks were slaughtered 14 h after the last meal by electronarcosis, neck sectioning and bleeding. Immedi-ately after bleeding, liver were weighted and sampled, rapidly frozen in liquid nitrogen and stored at − 80 °C. These liver samples were kindly provided by Baéza and Chartrin [20] and reused in the present study for RNA sequencing and expression analyses.
RNA preparation and sequencing
Total RNA was extracted from 96 liver samples (12 ducks per genetic type and per diet) using NucleoS-pin® RNA L (Macherey-Nagel SARL, Hoerdt, France) according to the manufacturer’s instructions. This kit involves guanidinium thiocyanate, silica membrane and on-column RNase-free DNase digestion. RNA concentration was determined using a ND-1000 Spectrophotometer (Thermo Scientific, Illkirch, France). Integrity of RNA was checked with Lab-on-a-Chip Eukaryote Total RNA Nano and Bio-nalyzer 2100 (Agilent Technologies France, Massy, France). 79 RNA with absorbance ratio λ260nm/ λ280nm and λ260nm/λ230nm > 1.8 and RNA integ-rity number [23] or RIN > 7.4 were selected (9–10
ducks per genetic type and per diet).
Libraries preparation and sequencing were per-formed at GeT Plage, the genomics facility of Geno-toul (http://get.genotoul.fr/en/). RNA-seq paired-end libraries have been prepared according to Illumina’s protocols using the Illumina TruSeq RNA Sample Prep Kit v2 to analyze mRNA (Illumina, San Diego, CA). Briefly, mRNA were selected using poly-T beads. Then, RNA were fragmented to generate double stranded cDNA and adaptators were ligated to be sequenced. 10 cycles of PCR were applied to amplify libraries. Library quality was assessed using an Agilent Bioanalyser (Agilent Technologies France, Massy, France) and libraries were quantified by qPCR using the Kapa Library Quantification Kit. RNA-seq experiments were performed on an Illumina HiSeq2000 using a paired-end read length of 2 × 100 pb with the Illumina HiSeq2000 SBS v3 sequencing kits. Samples were tagged using hexamer Tag
sequences for subsequent identification (Additional file1). The libraries were sequenced in paired-ends on 14 differ-ent lanes, 6 samples per lane (Additional file1).
Sequence data were submitted to the NCBI sequence read archive (SRA) under the accession number SRP144764.
Sequence analyses
Raw sequences pre-treatments and analyses were per-formed on Bioinformatics facility of Genotoul (http://
bioinfo.genotoul.fr/). After FastQC quality check (http://
www.bioinformatics.babraham .ac.uk/projects/fastqc/),
adapter trimming, and merging sample sequences, RNA sequences were aligned with STAR aligner (version 2.3.0e [24] on the common duck (Anas platyrhynchos)
reference genome (BGI duck 1.0, INSDC Assembly GCA 000355885.1). A similar approach was applied in a study where horse, donkey and reciprocal hybrids RNA reads were mapped against the horse reference genome [25]. Cufflinks and Cuffmerge tools [26] were then ap-plied on the merged file to construct a new gene model file. Gene raw counts (Additional files2and3) were ob-tained using featureCounts (version 1.4.5-p1 using -s 2 -O -p -t exon -g gene id parameters).
Gene expression analyses
Gene expression analyses were performed using R software version 3.2.2 (https://www.R-project.org). Gene expres-sions were determined using high-quality reads. Expression data (Additional files2 and 3) were first normalized with the Trimmed Mean of M-values (TMM) method [27] using the Bioconductor package edgeR [28]. Normalized data were analyzed by Principal component analyses and hierarchical clustering. Genes were filtered using the data driven HTSfilter procedure using the Bioconductor pack-age HTSFilter [29]. Differentially expressed genes (DEG) between overfed and ad libitum fed ducks were determined in each genetic type using filtered genes set.
Functional annotation
Functional annotation of differentially expressed genes with assigned GO terms for biological processes (GOBP) was conducted with the Database for Annotation, Visualization and Integrated Discovery (DAVID, http://
david.abcc.ncifcrf.gov/) bioinformatics resource, version
6.82016 [30–32]. Enrichment of functional annotations in DEG was determined using the default medium clas-sification stringency with an EASE enrichment threshold (a modified Fisher ExactP-Value) set to 0.001. Enriched annotations were then clustered with the Wang method [33] using GO terms semantic similarity as metric. Ex-pression profiles of down- and up-regulated DEG in the different clusters were also analyzed and visualized using clusterProfiler [34]. Dot size in profiles corresponds to
FC. P-values are shown in color bar, values decrease from more (red) to less significant (blue).
Gene interaction networks
Gene interaction networks were determined using the STRING database of known and predicted protein-pro-tein interactions (https://string-db.org/) version 10.5 [35,
36]. Minimum required interaction score was set to medium confidence (0.400).
Results Phenotypic data
As previously described [20], overfeeding induced a significant increase in liver weight, especially in Mule, Hinny and Muscovy ducks and less in Pekin ducks when compared to fed ad libitum control ducks (Additional file 4). This liver weight increase was corre-lated to increased lipid and triglyceride levels and de-creased water and protein levels in the liver. These data indicated that hepatic steatosis occurred more or less in overfed ducks from the 4 genetic types.
RNA sequencing and expression data
To go further in the understanding of mechanisms involved in hepatic steatosis, gene expression analyses were conducted by high-throughput RNA sequencing. For this purpose, RNA were first extracted from the liver of Pekin, Muscovy, Mule and Hinny ducks fed ad libitum or overfed and were sequenced on a HiSeq2000 after cDNA library constructions (n = 79). Approximately 2215 million paired-ends sequences were produced, corresponding to 28 ± 8 million in each sample and to 27.6 ± 7.7 million (97.4 to 99.1%) high-quality paired-reads (Additional file 1). High-qu-ality reads were assembled in 22,561 expressed genes and for each of these genes the number of mapped reads in each sample was counted (Additional files2and3). These counts were considered raw expression data. To exclude biases linked to different sample preparations, raw data were normalized using the TMM method (Fig.1).
Comparison of duck liver transcriptomes
Normalized expression data were analyzed by principal component analysis (PCA) and hierarchical clustering (HC) in order to compare the liver tran-scriptomes. Six clusters were clearly defined by PCA (Fig. 2a). The first principal component (Dim 1) summarized 17% of the whole variability and dis-criminated samples according to feeding (overfed ver-sus ad libitum). The second principal component (Dim 2) summarized 13% of the whole variability and discriminated samples according to genetic type, pure species being extreme and hybrids intermediate. It could be observed that the cluster corresponding to
overfed Pekin ducks appeared more dispersed than other clusters and that Mule and Hinny samples were clustered together according to feeding (ad libi-tum and overfed). Hierarchical clustering of normal-ized data (Fig. 2b) produced very similar results, samples were first clustered according to feeding and hybrid ducks with the same feeding were clustered together. However, it appeared that Muscovy ducks fed ad libitum or overfed were clustered together.
Differential gene expression analyses
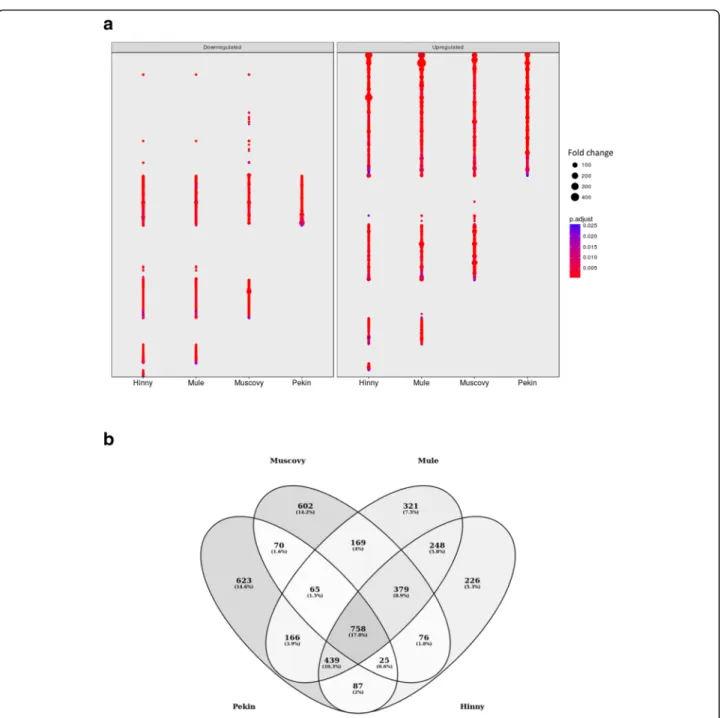
In order to better describe the different samples, dif-ferences in gene expressions between fed ad libitum and overfed ducks were analyzed. For each genetic type, genes showing a significant difference (p < 0.05) and a fold change ≥2 were selected (Fig. 3a). As indi-cated in Table 1, 2233, 2144, 2545 and 2238 genes were found up-and down-regulated by overfeeding, i.e. differentially expressed genes (DEG), in Pekin, Muscovy, Mule and Hinny ducks, respectively. Some of these genes were previously identified by RT-PCR in the same Pekin and Muscovy duck liver samples
[21, 37]. Although only 758 DEG (17.8%) were com-mon to the 4 genetic types, 1824 were found be-tween Mule and Hinny hybrids, 918 bebe-tween the Pekin and Muscovy ducks, and approximately the mean of these 2 DEG numbers between one hybrid and one duck species, 1238, 1309, 1374 and 1428 between Hinny and Muscovy, Hinny and Pekin, Mule and Pekin and Mule and Muscovy, respectively (Fig.3b). Hierarchical clustering (HC) was then conducted using all DEG expres-sion data (Fig. 4). Again, samples were first clustered ac-cording to feeding, and then acac-cording to genetic type.
Functional annotation of differentially expressed genes
Enriched functional annotations in DEG were deter-mined with DAVID and clusterProfiler annotation tools. A large number of biological processes (611 GO terms) associated to DEG were found enriched, either up-or down-regulated by overfeeding, drawing enriched annotation profiles (EAP) (Fig. 5). These EAP allow showing down- and up-regulated re-sponses to overfeeding in the 4 genetic types in an easy way for comparison. Some similarities and Fig. 1 Normalization of raw data. Boxplot distribution of read counts (log2 (counts+ 1)) in each sample before (left panel) and after normalization by TMM method (right panel). Light blue: Pekin ducks fed ad libitum; dark blue: overfed Pekin ducks; light green: Muscovy ducks fed ad libitum; dark green: overfed Muscovy ducks; pink: Mule ducks fed ad libitum; red: overfed Mule ducks; light grey: Hinny ducks fed ad libitum; dark grey: overfed Hinny ducks
Raw data Trimmed Mean of M-values
o o o o o o oOOo o o o oo oo o oo o o ooooo ooo ooo o oo ::::::::i,:,,::,,:::::::1::::::::::i::l:::::::::1
::
:
:
::
:
:
::
:
::
:
:
:
::
:
::
:
::
:
i
:i:l
::::::::::::::::::::::::::::::::::::::::::::::::::::::::::::::::::::::::::::::::
:
::
:
:
:::::
:
:
:
::
:
::
:
:
:
:
:
::
:
::
:
:
:
::
:
::
:
::
:
:
::
:
:
:
::
::
:
:
:1
:
:
::
:
::
:
:
::
:
:
::
:
::
:
:
::
:
:
:
:
::
:
:
:1:,:
:
:
::
:
:
:::
:
:
:
:
1:
:
::::
:
::
:
::
:
::
:
:
::
:
:
::
1
::::
,1:::1:
::
:
:
:
::
:
::
:
::·:
::
:
:
:
:
::
:
:
:::::
:
:
::
:
:
:::::
:
:
::
:
::
:
:
:
::
:
::
:
::
:
:
::
:
:
::
:
::
:
:
::
:
:
::
:
::
:
:
:
::
:
::
:
::
:
:
::
:
:
::::::::::::::::::::::::::::::::::::::::::::::::::::::::::::::::::::::::::::::: ::::::::::::::::::::::::::::::::::::::::::::::::::::::::::::::::::::::::::::::: ,111:,::::,:::11:•11:::1:1:1:111::•:1:::,::::•:1:::::::1:1::1111:::::::11:111::Hil
:
;
:::::
:
:
:
H
:
H
:
::
:
:
::
:
::
:
:
::
:
l
:i
:
::::
::
:
1
:i
:
::
:
:
::
:
:
::
:
iHi
::
:
:
::
:
::
:
:
::
:
:
:
:
1::
11':
:
1111:::::
:
1:
11::
:
:
.:::::
,, Ill I:
:
::
1:
::
1:
1:
::
11:
:
,11:
::
111::
:
:
111::
:
•,:
11::
1:
1::
111 11 1:
:
::
:
1:
11::
•1:
::
:
:
::
11:
1:
1111::
:
::
:
I:
::
1:
:
• 111111111111111111111111111111111111111 111111111111111111111111111111111111111particularities between species are visualized, for ex-ample similarities in Mule and Pekin up-regulated functions or Muscovy, Mule and Hinny down-regulated functions. To describe these
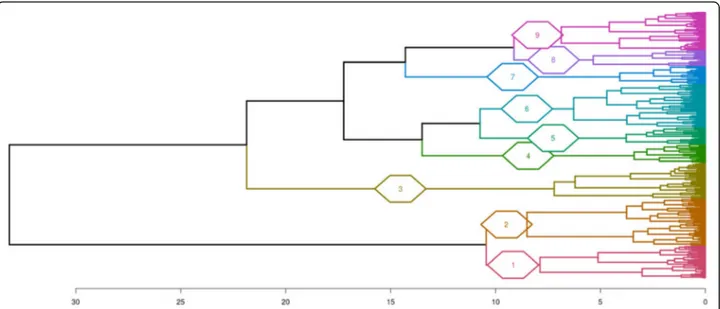
annotations in a more synthetic way, the 611 enriched terms were clustered according to semantic similarity (Fig. 6). Nine clusters were defined, group-ing 183 terms in 2 metabolic process clusters Fig. 2 Clustering of duck samples according to gene expression. Comparison of gene expression in duck samples by principal component analysis (a) and hierarchical clustering (b). Legend of the samples is indicated in Fig.1
PekAL101 PekAL1
.
J
PekAL81 PekAL85 PekAL117 Pek.AU
J
~
PekAL93 PekAL97
PekAL105 PekAL109 MuIAL82 MuIAL66 MulAL90 MUIAL94 MulAL\02 Ml•IAL\06 MulAL\18 MulAL\14 MulAL98 Ml'IAL\10 MutOl22 Mulôl10 Hln012J Hln0111
~ MulO126 C Mul0/14 fi> 0 Hln0139 ;: ![ Hln0127 -" I MulOl18 i g> MulOIJO à .g ~:~~~ 2 CD M ~:o?'J ~
MulOl2 MulOl6 HlnOIJS
MulOl34 HlnOl7 HlnOl15 Pek0!9 PekOIJJ PekOl37 Pek.0125 PekOl1 Pek.Ol13 Pek.0
1 21 P ek0 1 29 PekOIS Pek.0117
MUS0140 MusOl16 Mus0120 MusOl4 Mus0126 MusOl36 Mus0124 MusOl32 MusOl8 MusOl12
MusALI MusALI MusAL MusAL.54 MusA
l.68 100 200
~l
-
,~ ~ '"1 p ,:'1h>-
J
~
'
~-
-
~ 1 ·uI
LI Height 300 400 500 600 C" 0 3 "' 00 (X) $ 0 0 0, 0 u, 0 0 0 u, 0 Dim 2 ( 13 . 24 % ) -150 -100 ~~, ,:: -~J~ ~ ~::«>;a -50 ~ -~..-;_ -~~
a>st
i
----
---;:: ;::~~
·
t
--~i
~'1;1
.
:::,
·
Q iit"' "'"'"'
.
§
co . ~ A 0 50 ~ -,,~·
§
·
~ ~ (X) -0 (D >< " Qi\
l
>< Q·
g
-100.il
R,Q -0 --(D '0, >< (D Q >< "' • Q-., "' wo-
~
D)(clusters 1 and 2) and 428 terms in 7 cellular process clusters (clusters 3–9). For each of these clusters an EAP was drawn (Additional file 5).
As expected, lipid metabolic process was enriched (Additional file5, cluster 2). Interestingly, lipid oxidation, fatty acid oxidation and fatty acid beta−oxidation were also enriched, down-regulated in the liver of Hinny, Mule and Muscovy overfed ducks (Fig. 7). Fatty acid beta −oxidation enrichment resulted from down-regulation of 45 genes (Fig. 8a). Interaction network of these Fig. 3 Differentially expressed genes. Fold changes (FC > 2) of down (left panel) and up regulated (right panel) significant (adjustedp value < 0.05) differentially expressed genes (DEG) in the four genetic types (a). Venn diagram of DEG in the four genetic types (b)
Table 1 Differentially expressed genes
DEG Pekin Muscovy Mule Hinny common
up regulated 1553 1371 1592 1314 520 down regulated 680 773 953 924 235 all 2233 2144 2545 2238 758
a
Downregulated.
1 '.
1
1
1
1
1 11
1
1
1
1
1Hinny Mule Muscovy Pekin
b
Muscovy Upregulated'
1
1
1
1
1
1Hinny Mule Muscovy
Mule Pekin Fold change • 100 • 200 • 300 . 400
l
padji~\, 0.020 0.01~ 0.010 0.00~genes was analyzed (Fig. 8b). The network had signifi-cantly more interactions than expected (298 edges in the network versus 55 expected) again suggesting that these genes jointly contribute to a shared function.
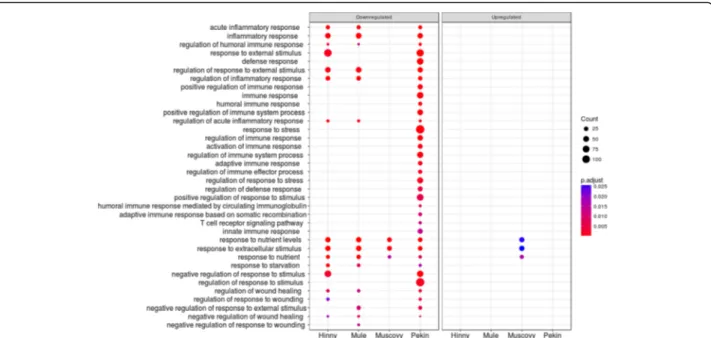
Some unexpected or yet not described processes were also enriched in DEG, for example those associated to cell cycle, extra-cellular matrix organization, blood co-agulation and immune response (Additional file 5). Enriched regulation of biological process (Additional file
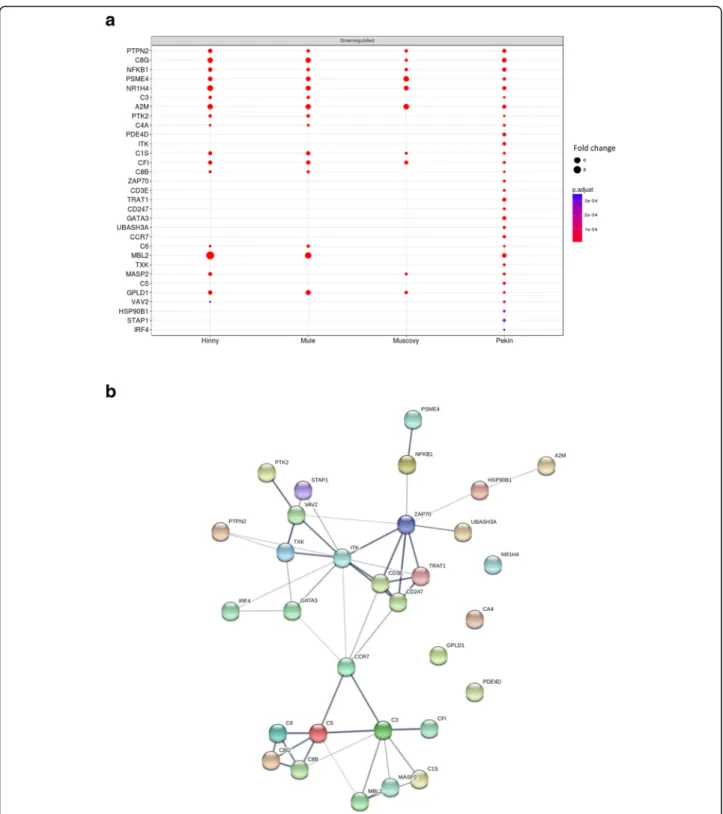
5, cluster 6.1) included many down-regulated terms as-sociated to immune response (Fig.9). Among them, en-richment of activation of immune response term resulted from down-regulation of 31 genes especially in Pekin ducks (Fig.10a) with more interactions (49) than expected (8) (Fig.10b).
Discussion
Some studies have been conducted in duck species and more generally in waterfowls in order to describe hepatic steatosis development after overfeeding. Due to the lack of specific microarrays, most of them were conducted by analyzing the expression of few candidate genes, especially those known to play a role in lipid and carbohydrate metabolisms [21, 22,
38]. The recent development of next generation se-quencing (NGS) techniques allows analysis of all the genes expressed from a genome. In this context, we have conducted RNA sequencing and analysis of liver transcriptomes from different genetic types of ducks fed ad libitum or overfed, i.e. Muscovy (Cairina moschata) and Pekin (Anas platyrhynchos) duck spe-cies and Mule and Hinny reciprocal duck hybrids.
It appears that gene expression data in these ducks allow to cluster them in 6 distinct groups, according first to overfeeding and then to genetic type, suggest-ing that differences in gene expression are more due to feeding effect than genetic type effect. Surpris-ingly, Mule and Hinny hybrids were clustered to-gether in two different clusters according to feeding (Fig. 2). One could expect great differences in gene expression between these two hybrids as fatty liver production is conducted in Mule ducks and not in Hinny ducks. Our results suggest that not using Hinny ducks is not due to their lower ability to pro-duce fatty liver. In fact the reason is more related to the difficulty to produce Hinny ducks according to a less efficient reproduction in terms of fertility and hatchability when female Muscovy ducks are matted to male common ducks [39]. Our results also show that the overfed Pekin group is widely dispersed on dimension 1 with negative and positive values indi-cating that Pekin ducks have a lower ability and a greater variability to produce fatty liver. The explan-ation of this greater variability is not clear but could be the result of selection schemes for fatty liver pro-duction, mostly conducted in Muscovy parental lines than in Pekin lines.
Differences in gene expressions between fed ad libi-tum and overfed ducks were then analyzed. To avoid eventual biases due to heterologous mapping and counting of Muscovy, mule and hinny ducks reads on common duck reference genome, DEG were not determined between all genetic types. They were first analyzed in each genetic type. In such a situation Fig. 4 Hierarchical clustering of duck samples according to differential gene expression. Legend of the samples is indicated in Fig.1
MusAI!,,._ MusAl.84 MusAL88 MusAL108 MusAL104 MusAL112 MusAL96 Mu&AL116 Mu&AL120 PekAL113 PekALll5 PekA
L 117 PekAL109 PekAU0 I PekAUI I
PekAL105 PekAL89 PekA
l
.93
PekA
I
97
MulAL98 MulAL110 MuIAL114 MulAL118 Hr·Al.87 MulAL62 MUIAL66 H
Ali:
1
A~
5
Mi1AL102 MuIAL106 H H MulAL90 MulAL94 Mus0l40 MUS0l16 Mus0120 Mus0l4 Mus0124 Mus0l32 Mus0l6 Mus0l12
Mus0128 Mus0l36 Mu10l22 Hln0l27 Hln0l19 Mul0l26 MulOl16 Mu10l30 HlnQIJ9 MulOl14 HlnQl11 MulOl10 Hln0l23 Hln0l31 Hln0l3 Mu1Ol38 Mu1Ol2 MulO16 MulOl34 Hln0115 Hln017 Hln0l35 Pek0l9 Pek0l33 Pek0l37 Pek0l25 PekO11 PekO113 PekOIS Pel<.0117
Pek0l21 Pek0l2' 0 . 0 0 . 2 He i ght 0 . 4 0 . 6 0 . 8
biases if any would be identical between ad libitum and overfed ducks from the same genetic type. Then, these DEG were compared between different genetic types (Fig. 3). It appears that many genes were simi-larly down- and up-regulated by overfeeding in the four genetic types, indicating that response to over-feeding and hepatic steatosis development involve in some part the same genes in the four genetic types. However, some DEG were also found that distinguish ducks according to their genetic types and responses. When enriched functions associated to DEG were analyzed and drawn as enriched annotation profiles the similarities and differences between the 8 condi-tions were made more obvious showing common and specific enriched functions according to genetic types (Fig. 5). The clustering of these annotations by
semantic similarity made it possible to resume the functions associated to the 611 biological processes GO terms in a more synthetic way, i.e. 9 clusters. As expected, some annotations were related to lipid and carbohydrate metabolism (cluster 2) thus confirming and enlarging previous results obtained in ducks [20–22, 38] and geese [40, 41]. It is interesting to note that together with up-regulation of genes in-volved in carbohydrate metabolism and lipid synthe-sis, other genes involved in lipid catabolism were down-regulated, especially in Muscovy, Mule and Hinny ducks (Figs. 7 and 8). These results indicate that hepatic steatosis in ducks involves a lot of genes playing a role in carbohydrate and lipid metabolisms, not only increasing glycolysis and de novo lipogen-esis, decreasing lipoprotein assembly and secretion Fig. 5 Enriched annotation profiles associated to differentially expressed genes. Dot representation of 611 significant (p < 0.05) enriched GO terms associated to down (left panel) and up regulated (right panel) differentially expressed genes (DEG). Count indicates the number of DEG annotated with the GO term
Downregulated Upregulated
'
1 1'
1
1
1
1
'
t
•
•
'
1
'
1
1
•
t
f
t
f
•
•
•
' '
1
11
•
.
.
1 11
1
t
'
•
•
•
•
•
1
1
r
t
•
1
•
•
t
•
1
'
.
'
'
I
•
•
•
1
•
1
t
.
•
•
t
'
Hinny Mule Muscovy Pekin Hinny Mule Muscovy Pekin
Count • 100 • 200 • 300
•
•
oo
p.adjust1
0.03 0.02 0.01and extrahepatic uptake of plasma lipids as previ-ously documented [16, 19–22], but also decreasing lipid catabolism. It is also interesting to note that to-gether with up-regulation of lipogenesis and down regulation of lipid secretion and extrahepatic uptake,
down regulation of lipid catabolism is more obvious in ducks with a higher ability to produce fatty livers, i.e. Muscovy, Mule and Hinny ducks, and less in Pe-kin ducks, suggesting that inflammation could be lower in these overfed ducks when compared to Fig. 6 Semantic similarity clustering of enriched GO terms associated to differentially expressed genes. The 611 enriched GO terms were
clustered according to their semantic similarity using the method of Wang. Cluster 1:“Cellular aromatic compound metabolic process” including 75 GO terms; Cluster 2:“Organic acid metabolic process” (108 GO terms); Cluster 3: “Anatomical structure development” (83 GO terms); Cluster 4: “Response to organic substance” (42 GO terms); Cluster 5: “Organic substance metabolic process” (40 GO terms); Cluster 6: “Regulation of biological process” (99 GO terms); Cluster 7: “Transport” (41 GO terms); Cluster 8: “Cellular component organization” (36 GO terms); Cluster 9: “Cell cycle process” (87 GO terms). GO terms in each cluster are indicated in Additional file5
Fig. 7 Enriched GO terms associated to differentially expressed genes in“Organic acid metabolic process” cluster 2. Dot representation of significant (p < 0.05) enriched GO terms associated to down (left panel) and up regulated (right panel) differentially expressed genes (DEG)and corresponding to the lower part of cluster 2 (see Additional file5for a complete view of cluster 2). Count indicates the number of DEG annotated with the same GO term
30 25 20 15 10
•
:
i
•
•
.
.
'
.
'
'
t
•
•
•
•
•
.
.
•
•
•
•
.
•
Count.
.
".
.
.
,,
.
.
.
,,
.
.
,,..
.
p.adjust.
1
-
0.02.
. .
.
0.01.
•
•
:
.
.
.
.
•
.
•
Pekin overfed ducks. Muscovy, Mule and Hinny ducks thus appear to store more lipids in the liver than Pekin ducks. Conversely, Pekin ducks export
more lipids in the blood, uptake and store them in peripheral adipose tissues [42]. Thought different sensibility to insulin could play a role in the Fig. 8 DEG involved in“lipid catabolic process”. Fold changes (FC > 2) in the four genetic types of the 45 down (left panel) and up regulated (right panel) significant (adjusted p value < 0.05) differentially expressed genes (DEG) annotated with lipid catabolism GO term (a). Interaction network of these 45 genes as defined by STRING (b). Minimum required interaction score was set to medium confidence (0.400). Lline thickness of the edges indicates the strength of data support (fusion, neighborhood, co occurrence, experimental, text mining, database and
co expression evidences)
a
Downreoulated Up,egulaled ALDH3A2 CROT. .
IDH1.
.
CIDEA.
HSD17B4.
.
.
ACAT1•
•
•
LIPC+
.
•
CPT18•
.
GPLD1.
LPIN1 PLCD3 LPL ACOX1.
ACADM ACADL Fold change ACA011.
•
ACAD9.
' ECHS1.
.
•
.
,,
CPT1A•
.
•
.
,,
ACAA1 HADHA MUT DECR1 p.adjust GRATr
CPT2 ACAA2 0.003 LPIN2•
0.002 PLA1A PLA2G12A 0.001 AMACR EHHADH NCEH1 APOB BC02 AADAC CNA1 PNPL.A2 HACL1 AKR1D1 FABP1 ASPG ADIPOO LPIN3 ECl2 PIK3CGHmny Mule Muscovy Pekin Hmny Mule Muscovy Pekm
differences observed between genetic types with re-sistance in Pekin ducks, it appeared however that all genetic types were sensitive to insulin [43].
Some other unexpected or less documented functions were also found, including down-regulation of inflam-mation, stress and immune responses, especially in Pekin ducks (cluster 6.1, Fig. 9), and up-regulation of proliferation (clusters 8 and 9). As shown in Fig. 10, down-regulation of genes involved in immune response and inflammation confirms the results of other studies conducted in waterfowls [41, 44–46]. Knowing the evo-lution of NAFLD towards more serious liver diseases, we would expect these functions being increased. In the same cluster, down regulation of response to nutrient, exogenous stimuli and insulin were also observed. Re-sistance to insulin in obese patient is well documented and is linked to type 2-diabetes, hepatic steatosis and other components of metabolic syndrome. We can thus speculate that immune response and inflammation were up-regulated during the first days of overfeeding and were then down-regulated, hepatocytes becoming resist-ant or insensitive after over-stimulation as observed for insulin response. Analyses of the kinetics of these genes across the entire period of over-feeding would help to address this question. These down-regulations could also be the result of a trade-off between transcription of genes involved in carbohydrates and lipid metabolisms which are dramatically up-regulated and other hepato-specific functions, i.e. expression of complement proteins, which are consequently down-regulated. This
hypothesis is reinforced by the fact that albumin, one hepato-specific gene, is also down-regulated after over-feeding ([37] and this study).
Many GO terms associated to proliferation were also up-regulated (additional file, clusters 9.1 and 2). Our results suggest that in addition to hypertrophy hepatic steatosis is also associated to hyperplasia of hepatic cells. Adipocyte hyperplasia is well docu-mented in obesity [47, 48] but as far we know this has not been reported yet in hepatic steatosis. How-ever, further investigations are now needed to con-firm hyperplasia in hepatic steatosis. Other studies should also be conducted to complement our results, focusing on non-coding RNAs knowing their roles in the regulation of gene expression.
Conclusions
Our study is the first report describing whole transcrip-tomes in four duck genetic types fed ad libitum and overfed. It helps better characterizing responses to overfeeding in ducks in terms of gene expression and associated functions. It also highlights up- and down-regulation of some unexpected functions in duck hepatic steatosis including immunity and cell prolifera-tion. According to duck selection, the results could rep-resent first milestones for early selection in mule’s parents, of ducks with traits of interest to the profession by identifying genes with different levels of expression between genetic types and correlated with their “foie gras” production.
Fig. 9 Enriched GO terms associated to differentially expressed genes in“Regulation of biological process” cluster 6. Dot representation of significant (p < 0.05) enriched GO terms associated to down (left panel) and up regulated (right panel) differentially expressed genes (DEG)and corresponding to the lower part of cluster 6 (cluster 6.1 in Additional file5). Count indicates the number of DEG annotated with the same GO term
acute innammatory response
inflammatory response
regulation ol humoral immune response
response to extemal stimulus delense response regulation of response to extemal stimulus
regulation of inflammatory response
positive regulation ol immune response immune response
humoral immune response positive regulation ol immune system process
regulation of acute inflammatory response
response to stress regulation ol immune response activation of immune response regulation of immune system process
adaptive immune response
regulalion of immune effector process
regulation of response to stress regulation ol delense response positive regulalion of response to stimulus humoral immune response mediated by circulating immunoglobulin adaptive immune response based on somalie recombination T cati receptor sîgnaling palhway
innate immune response
response to nutrient levels
response to extracellular stimulus
response to nutrient
response to starvation negative regulation of response to stimulus
regulalion of response to stimulus regulation ol wound healing regulation of response to wounding negative regulation of response to extemal stimulus
negative regulation of wound healing negative regulation of response to wounding
Do-Mlregulated
. .
.
•
.
•
.
•
.
•
•
•
•
•
•
•
•
•
•
•
•
•
.
.
.
•
•
•
•
•
•
• •
•
• •
•
•
•
.
.
.
•
.
.
•
.
.
.
•
.
•
.
Hmny Mule Muscovy Pekm
l.,pregulated
•
•
•
Hmny Mule Muscovy Pekm
Count
.
"...
.
• " ,ool
pad~:i, 0.020 0.015 0.010 0.005Fig. 10 DEG involved in“activation of immune response”. Fold changes (FC > 2) in the four genetic types of the 31 down regulated significant (adjusted p value < 0.05) differentially expressed genes (DEG) annotated with“activation of immune response” GO term (a). Interaction network of the 31 genes as defined by STRING (b). Minimum required interaction score was set to medium confidence (0.400). Line thickness of the edges indicates the strength of data support (fusion, neighborhood, co occurrence, experimental, text mining, database and co expression evidences) (b)
a
Oownreoulaled PTPN2•
•
CBG•
•
•
NFKB1•
•
PSME4•
•
•
NR1H4•
•
•
.
C3 A2M•
•
•
•
PTK2 C4A PDE4D.
ITK Fold change C1S.
•
CFI.
•
.
.
,
CBB•
·
ZAP70 CD3E p.adjust TRAT1.
r
CD247 GATA3•
,....
UBASH3A ,....
CCR7 C6 MBL2•
•
•
TXK MASP2.
CS GPL01•
•
VAV2 HSP90B1 STAP1 IAF4Hmny Mule Muscovy Pekm
Additional files
Additional file 1:Experimental and sequencing design. (XLSX 16 kb)
Additional file 2:Gene and transcript annotations. (XLSX 1413 kb)
Additional file 3:Gene counts. (XLSX 8974 kb)
Additional file 4:Liver weights. Ap: Common Pekin duck; Cm: Muscovy
duck; mu: Mule duck; hi: Hinny duck. (DOCX 24 kb)
Additional file 5:Clusters of enriched GO terms associated to
differentially expressed genes defined by semantic similarity. (PDF 2017 kb)
Abbreviations
DAVID:Database for annotation, visualization and integrated discovery; DEG: Differentially expressed genes; EAP: Enriched annotation profiles; FA: Fatty acids; GO: Gene ontology; GOBP: Gene ontology biological processes; HC: Hierarchical clustering; NAFLD: Non alcoholic fatty liver disease; NASH: Non alcoholic steatohepatitis; NGS: Next generation sequencing; PCA: Principal component analysis; PCR: Polymerase chain reaction; qPCR: Quantitative polymerase chain reaction; RIN: Ribonucleic acid integrity number; RNA: Ribonucleic acid; RNA seq: Ribonucleic acid sequencing; TMM: Trimmed mean of M values method; VLDL: Very low density lipoproteins
Acknowledgements
The authors greatly acknowledge Cécile Duby for technical assistance in RNA preparation. The authors also thank the staff of the INRA experimental Palmipèdes à Foie Gras (Palmipôle) unit (UE 0089, Benquet, France) for producing and rearing animals, the staff of GeT core facility (US 1426, GenoToul, Castanet Tolosan, France) for advices and sequencing, the Bioinformatics core facilities from Genotoul (Toulouse, France) and GenOuest from Biogenouest (Rennes, France) for data storage and access to clusters for analyses. Funding
The research was supported by the National Institute for Agronomical Researches (INRA) AIP Bio Ressources research grant. With the exception of funding, INRA played no role in this study.
Availability of data and materials
The dataset supporting the conclusions of this article is available in the NCBI Sequence Read Archive (SRA), under the accession number SRP144764
(https://www.ncbi.nlm.nih.gov/sra/SRP144764).
Authors’ contributions
EB: conceived the experimental design and collected liver samples. CD conceived and coordinated the RNA Seq study. OB and DE generated RNA libraries, sequencing and quality controls of RNA sequences produced. CK designed and implemented the pipeline for RNA Seq preprocessing, sequence assembly and gene expression counting. FH, MHB and CD carried out RNA Seq, DEG and annotation analyses. FH, MHB, CK and CD interpreted the data. CD and FH drafted the manuscript. CK, OB, DE and MHB were also involved in drafting some parts of the manuscript and revisited it. All authors read and approved the final manuscript.
Ethics approval and consent to participate
All experimental procedures were performed in accordance with the French National Guidelines for the care and use of animals for research purposes
(http://ethique.ipbs.fr/charteexpeanimale.pdf). Ethics Committee
authorization to experiment on living animals was not sought for this study as samples were previously collected by another study.
Consent for publication Not applicable. Competing interests
The authors declare that they have no competing interests.
Author details
1PEGASE, INRA, Agrocampus Ouest, 16 Le Clos, 35590 Saint Gilles, France. 2Mathématiques Appliquées, Agrocampus Ouest, 35042 Rennes, France. 3BOA, INRA, Université de Tours, 37380 Nouzilly, France. 4GENPhySE, INRA,
ENVT, ENSAT, 31326 Castanet Tolosan, France.5GeT PlaGE, INRA, US 1426, GenoToul, 31326 Castanet Tolosan, France. 6Bioinformatics facility, INRA,
Genotoul, 31326 Castanet Tolosan, France. 7SIGENAE, INRA, 31326
Castanet Tolosan, France.
References
1. Younossi ZM, Koenig AB, Abdelatif D, Fazel Y, Henry L, Wymer M. Global epidemiology of nonalcoholic fatty liver disease meta analytic assessment of prevalence, incidence, and outcomes. Hepatology. 2016;64(1):73 84. 2. Tamura S, Shimomura I. Contribution of adipose tissue and de novo
lipogenesis to nonalcoholic fatty liver disease. J Clin Invest. 2005;115(5): 1139 42.
3. Lavoie JM, Gauthier MS. Regulation of fat metabolism in the liver: link to non alcoholic hepatic steatosis and impact of physical exercise. Cell Mol Life Sci. 2006;63(12):1393 409.
4. Parekh S, Anania FA. Abnormal lipid and glucose metabolism in obesity: implications for nonalcoholic fatty liver disease. Gastroenterology. 2007; 132(6):2191 207.
5. Ferré P, Foufelle F. Hepatic steatosis: a role for de novo lipogenesis and the transcription factor SREBP 1c. Diabetes Obes Metab. 2010;12(Suppl 2):83 92. 6. Musso G, Gambino R, Cassader M. Recent insights into hepatic lipid
metabolism in non alcoholic fatty liver disease (NAFLD). Prog Lipid Res. 2009;48(1):1 26.
7. Fabbrini E, Sullivan S, Klein S. Obesity and nonalcoholic fatty liver disease: biochemical, metabolic, and clinical implications. Hepatology. 2010;51(2): 679 89.
8. Stojsavljevic S, Gomercic Palcic M, Virovic Jukic L, Smircic Duvnjak L, Duvnjak M. Adipokines and proinflammatory cytokines, the key mediators in the pathogenesis of nonalcoholic fatty liver disease. World J Gastroenterol. 2014;20(48):18070 91.
9. Panera N, Della Corte C, Crudele A, Stronati L, Nobili V, Alisi A. Recent advances in understanding the role of adipocytokines during non alcoholic fatty liver disease pathogenesis and their link with hepatokines. Expert Rev Gastroenterol Hepatol. 2016;10(3):393 403.
10. Polyzos SA, Kountouras J, Mantzoros CS. Adipokines in nonalcoholic fatty liver disease. Metabolism. 2016;65(8):1062 79.
11. Tilg H, Moschen AR. Evolution of inflammation in nonalcoholic fatty liver disease: the multiple parallel hits hypothesis. Hepatology. 2010; 52(5):1836 46.
12. Teli MR, James OF, Burt AD, Bennett MK, Day CP. The natural history of nonalcoholic fatty liver: a follow up study. Hepatology. 1995;22(6):1714 9. 13. Anstee QM, Day CP. The genetics of NAFLD. Nat Rev Gastroenterol Hepatol.
2013;10(11):645 55.
14. Rinella ME, Sanyal AJ. NAFLD in 2014: genetics, diagnostics and therapeutic advances in NAFLD. Nat Rev Gastroenterol Hepatol. 2015;12(2):65 6. 15. Ray K. NAFLD the next global epidemic. Nat Rev Gastroenterol Hepatol.
2013;10(11):621.
16. Hermier D, Guy G, Guillaumin S, Davail S, André JM, Hoo Paris R. Differential channelling of liver lipids in relation to susceptibility to hepatic steatosis in two species of ducks. Comp Biochem Physiol B Biochem Mol Biol. 2003; 135(4):663 75.
17. Fournier E, Peresson R, Guy G, Hermier D. Relationships between storage and secretion of hepatic lipids in two breeds of geese with different susceptibility to liver steatosis. Poult Sci. 1997;76(4):599 607.
18. Hermier D, Salichon MR, Guy G, Peresson R. Differential channelling of liver lipids in relation to susceptibility to hepatic steatosis in the goose. Poult Sci. 1999;78(10):1398 406.
19. Davail S, Rideau N, Guy G, Andre JM, Hermier D, Hoo Paris R. Hormonal and metabolic responses to overfeeding in three genotypes of ducks. Comp Biochem Physiol A Mol Integr Physiol. 2003;134(4):707 15.
20. Chartrin P, Bernadet MD, Guy G, Mourot J, Hocquette JF, Rideau N, Duclos MJ, Baéza E. Does overfeeding enhance genotype effects on liver ability for lipogenesis and lipid secretion in ducks? Comp Biochem Physiol A Mol Integr Physiol. 2006;145(3):390 6.
21. Hérault F, Saez G, Robert E, Al Mohammad A, Davail S, Chartrin P, Baéza E,
Diot C. Liver gene expression in relation 10 hepatic steatosis and lipid
secretion in twO duck species. Anim Genet. 2010;41 (1):12 20.
22. Tavernier A, Davail S, Ricaud K. Bernadet MD, Gontier K Genes involved in
the establishment of hepatic steatosis in Muscovy, Pekin and mule ducks.
Mol Cell Biochem 2017;424(1 2):147 61.
23. Schroeder A, Mueller 0, Stocker S, 5alowsky R, Leiber M, Gassmann M, Lightfoot S, Menzel W, Granzow M, Ragg T. The RIN: an RNA i ntegrity number for assigning integrity values 10 RNA measurements. BMC Mol Biol. 2006;7:3.
24. Li H, Durbin R. Fast and accurate short read alignment with burrows
wheeler transform. Bioinformatics. 2009;25(14): 1754 60.
25. Wang X. Miller OC, Harman R, Antczak DF, Clark AG. Paternally expressed genes predominate in the placenta. Proc Natl Acad Sei U SA. 2013;11(X26):
107Π10.
26. Trapnell C. Williams BA, Pertea G, Mortazavi A, Kwan G, van Baren MJ,
Salzberg SL, Wold BJ, Pachter L. Transcript assembly and quantification cy
RNA Seq reveals unannotated transcripts and isoform switching during cell
differentiation. Nat Biotechnol. 2010;28(5):511 S.
27. Robinson MD, Oshlack A. A scaling normalization method for differential expression analysis of RNA seq data. Genome Biol. 201 0; 11 (3):R.25.
28. Robinson MD, Mc(arthy DJ, Smyth GK edgeR: a bioconductor package for differential expression analysis o f digital gene expression data.
Bioinformatics. 2010;26(1):139 40.
29. Rau A, Gallopin M, Celeux G, Jaffrezic F. Data based filtering for replicated
high throughput transcriptome sequencing experiments. Bioinformatics.
2013;29(17):2146 52.
30. Huang d w, Sherman BT, Lempicki RA Bioinformatics enrichment tools:
paths toward the comprehensive functional analysis of large gene lists.
Nucleic Acids Res. 2009;37(1):1 13.
31. Huang DW, Sherman BT, Lempickl RA Systematic and integrative analysis of
large gene lists using DAVID bioinformatics resources. Nat Protocols. 2008;
4(1):44 57.
32. Huang DW, Sherman BT, Tan Q Kir J, Liu D, Bryant D, Guo Y, Stephens R, Baseler MW, Lane HC. et al. DAVID bioinformatics resources: expanded annotation database and novel algorithms 10 better extract biology from
large gene lists. Nucleic Acids Res. 2007;35(Web Server issue):Wl 69 75.
33. Wang JZ, Du
z.
Payanakool R, Yu PS, Chen CF. A new method 10 me3sure the semantic similarlty of GO terms. Bioinformatics. 2007;23(10):1274 81.34. Yu G, Wang LG, Han Y, He QY. clusterProfiler: an R package for comparing biological themes among gene clusters. Omics. 2012;16(5):284 7.
35. Szklarczyk D, Franceschini A, Wyder S, Forslund K. Heller D, Huerta Cepas J,
Simonovic M, Roth A, Santos A, Tsafou KP, et al. STRING v 1 O protein protein
interaction netw0rks, integrated over the tree of life. Nucleic Acids Res.
2015;43(Database issue):D447 52.
36. Szklarczyk D, Morris JH, Cook H, Kuhn M, Wyder S, Simonovic fv\ Santos A,
Doncheva NT, Roth A, Bork P, et al. The STRING database in 2017: quality controlled protein protein association netw0rks, made broadly accessible.
Nucleic Acids Res. 2017;45(D1):D362 8.
37. Herault F, Duby C. Baeza E. Diot C. Adipogenic genes expression in relation 10 hepatic steatosis in the liver o f twO duck species. Animal. 2018;12(12):
2571 7.
38. Zhang R, Zhu L, Zhang Y, Shao D, Wang L, Gong D. cDNA cloning and the response 10 overfeeding in the expression o f stearoyl CoA desaturase 1
gene in Landes goose. Gene. 2013;512(2):464 9.
39. Brun JM, Richard Mfv\ Marie Etancelin C. Rouvier R, Larzul C. Le canard mulard: déterminisme génétique d'un hybride intergénérique. INRA Productions Animales. 2005;18:295 308.
40. Lu L, Chen Y, Wang
z.
Li X. Chen W, Tao z, Shen J, Tian Y, Wang D, Li G, et al. The goose genome sequence IEl3ds 10 insights into the evolution o f waterfowl and susceptibility 10 fany liver. Genome Biol. 2015;16:89.41. Liu L, Zhao X, Wang Q, Sun X, Xia L, Yang B, Zhang Y, Montgomery S, Meng H, Geng T, et al. Prosteatotic and protective components in a unique model o f fany liver: gut microbiota and suppressed complement system. Sei Rep. 201q6:31763.
42. Andre JM, Guy G, Gontier Latonnelle K. Bernadet MD, Davail B, Hoo Paris R, Davail S. Influence of lipoprotein lipase activity on plasma triacylglycerol concentration and lipid storage in three genotypes of ducks. Comp Biochem Physiol A Mol lntegr Physiol. 2007;148(4):899 902
43. Gontier K. Andre JM, Bernadet MD, Ricaud K. Davail S. lnsulin effect on
lipogenesis and fat distribution in three genotypes of ducks during
overfeeding. Comp Biochem Physiol A Mol lntegr Physiol. 2013;164(3):
499 505.
44. Zhu LH, Meng H, Duan XJ, Xu GQ Zhang J, Gong DQ Gene expression profile in the liver tissue of geese after overfeeding. Poult Sei. 2011;90(1):107 17.
45. Zheng A, Chang W, Hou S, Zhang S, (ai H, Chen G, Lou R, Liu G. Unraveling molecular mechanistic differences in liver metabolism between lean and fat
lines of Pekin duck (Anas platyrhynchos domestica): a proteomic study. J
Proteome. 2014;98:271 88.
46. Zhu F, Yuan JM, Zhang ZH, Hao JP, Yang YZ. Hu SQ Yang FX. Qu u, Hou ZC. De novo transcriptome assembly and identifcation of genes associated with feed conversion ratio and bre3st muscle yield in domestic ducks. Anim Genet. 2015;46(6):636 45.
47. Hausman DB, DiGirolamo M, Bartness TJ, Hausman GJ, Martin RJ. The
biology o f white adipocyte proliferation. Obes Rev. 2001;2(4):239 54.
48. Jeffery E. Church CD, Holtrup B, Colman L, Rodeheffer MS. Rapid depot specific activation of adipocyte precursor cells at the onset of obesity. Nat