HAL Id: halshs-03073242
https://halshs.archives-ouvertes.fr/halshs-03073242
Preprint submitted on 16 Dec 2020
HAL is a multi-disciplinary open access
archive for the deposit and dissemination of
sci-entific research documents, whether they are
pub-lished or not. The documents may come from
teaching and research institutions in France or
abroad, or from public or private research centers.
L’archive ouverte pluridisciplinaire HAL, est
destinée au dépôt et à la diffusion de documents
scientifiques de niveau recherche, publiés ou non,
émanant des établissements d’enseignement et de
recherche français ou étrangers, des laboratoires
publics ou privés.
a Tale of Hidden Green Attitude
Olivier Beaumais, Mireille Chiroleu-Assouline
To cite this version:
Olivier Beaumais, Mireille Chiroleu-Assouline. Informal versus Formal Corporate Social
Responsibil-ity: a Tale of Hidden Green Attitude. 2020. �halshs-03073242�
WORKING PAPER N° 2020 – 81
Informal versus Formal Corporate Social Responsibility:
a Tale of Hidden Green Attitude
Olivier Beaumais
Mireille Chiroleu-Assouline
JEL Codes: M14, Q59, L29, C38.
Keywords: corporate social responsibility, corporate environmental
responsability, non-parametric Item Response Theory, scoring, stakeholders,
SME, France.
a Tale of Hidden Green Attitude
Olivier Beaumais
yand Mireille Chiroleu-Assouline
zDecember 16, 2020
Abstract
We explore …rms’ commitment to Corporate Social Responsibility (CSR). Using a unique dataset
of 8,857 French …rms collected through a survey conducted at the end of 2011 by the French National
Institute of Statistics and Economic Studies (INSEE), we …rst construct 3 CSR pillar scores for each
…rm, based on a non-parametric Item Response Theory model known as Mokken Scale Analysis. CSR
scores, along with responses to speci…c items of the 2011 INSEE survey, allow us to characterize …rms
implementing formal versus informal CSR. We then estimate simple probit models and count data models
to show that, with regards to CSR commitment, size de…nitely matters, and that a signi…cant share of
…rms stating that they are not actively committed to CSR, actually engage signi…cantly in CSR, with
no monotonic size e¤ect. Cooperation with external actors such as NGOs mitigates the size e¤ect in the
likelihood of carrying out informal CSR, whereas the pressure of NGO campaigns against large companies
mainly spurs the environmental score of smaller …rms in the same sector.
K eyw ords : corp orate so cial resp onsibility, corp orate environm ental resp onsability, non-param etric Item R esp onse T heory, scoring, stakeholders, SM E, France.
JE L codes : M 14, Q 59, L29, C 38.
This research has been funded by the French National Research Agency (ANR-15-CE05-0008-01), the French Ministery for Environment and the program Investissements d’Avenir of the French government (ANR-17-EURE-001).
yCREAM EA-4702, University of Rouen Normandy and LISA UMR CNRS 6240, University of Corte, France. Email:
olivier.beaumais@univ-rouen.fr.
zParis School of Economics, University of Paris 1 Panthéon-Sorbonne, France. Email :
1
Introduction
Walking the walk or talking the talk? Corporate social responsibility (CSR) is the ultimate …eld in which talking the talk without walking the walk is commonly deemed as a speci…c form of greenwashing (Lyon and Montgomery (2015), Gatti et al. (2019)). The big companies are often accused of allowing such a gap between their acts and their speech, because they would be more willing to use CSR as a communication tool, whereas small and medium enterprises (SMEs) would be less often but more sincerely committed to CSR. To what extent is this assertion veri…ed? How di¤erent are small and large …rms in their CSR practices? In the CSR …eld, this is one of the topics that deserves thorough analysis (Kitzmueller and Shimshack (2012), Schmitz and Schrader (2015), Aguinis and Glavas (2012), Croson and Treich (2014), Crifo and Forget (2015)). This is all the more important since in most OECD countries small and medium-sized enterprises account for an overwhelming majority of businesses (99%) and more than half of GDP (OECD (2019)). Because of this weight and their role in innovation, they are key actors in the move towards sustainability.
Indeed, the existing literature shows that size de…nitely matters for CSR involvement (Spence (1999), Russo and Tencati (2009), Baumann-Pauly et al. (2013)). Among the possible explanations is a lack of understanding of the concept of CSR itself due to its vagueness. Baron (2001) stated that “corporate social responsibility is a poorly and incompletely de…ned concept”. The notion itself has its origins in the e¤orts of companies to rebuild their legitimacy following the economic crisis of the 1930s. The inclusion of an environmental dimension is more recent (Vatn (2018)). Among the many successive de…nitions of CSR, the one given by the European Union’s Green Paper (EC (2001), p. 6) presented it as a voluntary approach by companies to integrate social and environmental concerns into their strategy and in their interactions with their stakeholders. The World Business Council for Sustainable Development (WBCSD (2004)) broadened the de…nition to include a company’s commitment to contribute to sustainable economic development, working with all its stakeholders. And in 2011, for the European Commission, the concept has become both simpler and more vague, omitting the voluntary aspect, with CSR becoming “the responsibility of companies for their impact on society”(EC (2011)). The vagueness of this de…nition helps to account for the very di¤erent forms CSR can take in di¤erent companies and countries.1
CSR, and particularly its environmental dimension, is commonly seen as the implementation of Freeman’s stakeholder theory, which sets as a guideline for companies to go beyond simply maximizing shareholder value and take into account the interests of their stakeholders - agents or groups that can in‡uence or are
1Matten and Moon (2008) also emphasize institutional dissimilarities to explain why US and European companies di¤er in
their degree of explicit acknowledgement of CSR in their strategy: American corporations are characterized by explicit CSR whilst European corporations implement implicit CSR. They underline, however, the ongoing convergence between …rms of both origin, with CSR becoming increasingly explicit for European …rms as well.
a¤ected by the achievement of the …rm’s objectives (Freeman (1984), Delmas and To¤el (2004), Delmas and To¤el (2011), Russo and Perrini (2010), Perrini et al. (2007)). According to Russo and Tencati (2009), large corporations implement formal CSR strategies (notably by implementing formal management systems devoted to CSR), whilst SMEs run informal CSR strategies. Di¤erent other explanations have been o¤ered for this unequal commitment to CSR, among which scarcity of resources and organizational costs (Perrini et al. (2007), Jenkins (2009)), or endogenous organizational characteristics promoting the internal implementation of CSR-related practices in core business functions (Baumann-Pauly et al. (2013)).2 On the basis of four
in-depth case studies, Murillo and Lozano (2006) con…rm that SMEs speci…c involvement may take a di¤erent form than for large …rms because they are closely connected to their environment or communities in which they often act as benefactors or strongly committed agents (Spence (1999)), the values of their manager or owner constituting one major driver (Spence et al. (2003)). As a result, SMEs are especially interested in social capital, as predicted by Spence et al. (2003), but do not appear to communicate their social practices, which constitutes an informal CSR. Murillo and Lozano (2006) argue that the very concept of CSR in SMEs is confused with the account of speci…c practices carried out, and does not make SMEs’managers or employees feel comfortable; they consider CSR as being a metalanguage used to describe speci…c actions or practices more than an operative or management language. Similarly Russo and Perrini (2010) note that SMEs hardly ever use the language of CSR to describe their actions.
Our research questions are related to this set of theoretical assertions and …rst …ndings: do we observe a gap between CSR forms depending on the corporations’size that could be interpreted as the evidence of formal CSR in large corporations and informal CSR in SMEs? Is this gap di¤erentiated according to the CSR pillars? How is it caused or a¤ected by stakeholders’pressure?
The empirical literature on this issue is scarce and scattered. The main di¢ culty lies in the fact that there is no common assessment of the degree of CSR for all companies, and therefore not for small and medium-sized enterprises. The best known of the existing ratings, the scores assigned by the KLD MSCI company, concerns only 8500 companies worldwide.3 Therefore most articles adopt a restricted viewpoint or
treat the di¤erent population segments in a di¤erent way from the beginning. In the same way as Murillo and Lozano (2006), the existing papers rely until now on small samples or qualitative case studies. Kühn et al. (2014), for example, conduct a qualitative content analysis based on the Global Reporting Initiative (GRI) guidelines to address how transparent French listed companies of the CAC 40 communicate their
2Magill, Quinzii and Rochet (2015) argue that it would be not optimal for small competitive …rms to have the same level of
CSR than large …rms with signi…cant market power. This is due to their speci…c de…nition of CSR in their theoretical framework: a responsible …rm cares about social welfare, by weighing stakeholders’ welfare instead of only shareholders’.
CSR engagement externally, whereas Vo et al. (2015) use a sample of 155 …rms (drawn from a panel of about 1,200 French SMEs) to compare the roles of economic, social, and environmental motives in driving SMEs to integrate CSR into their business strategy. Some studies are limited to intra-sectoral di¤erences (Torugsa et al. (2012), O’Connor et al. (2017)). Very few papers use large datasets representative of the size diversity of the business sector: one of them is Russo and Tencati (2009), who study the behavior of a large sample composed of 3,626 Italian companies of all sizes. The only current exceptions is Turker (2009) who constructs a scale of CSR for Turkish …rms by asking 280 respondents to give binary answers (yes/no) to 42 statements about their …rm’s practices.
By contrast, our paper aims to shed light on the potentially very di¤erent ways that companies can consider CSR by drawing a comprehensive and detailed picture of the di¤erentiated spreading of the CSR concept and practices among …rms. The data set used in this paper, which is the largest ever gathered for France (8,857 …rms), includes small and medium enterprises as well as large …rms, allowing us to take into account industry di¤erences. Moreover, our data set is composed of …rst-hand raw data, free from any potentially biased exploitation and interpretation. And because the data we used was disclosed by …rms to the French statistical institute for statistical use only and under con…dentiality rules, it is very unlikely to be strategically biased, in order to be awarded a good score to be used by investors for example. In addition, the data set is comprehensive concerning …rms with more than 500 employees and the rest of the sample relies on the best sampling practices to date. One of the advantages of this extensive survey is that it allows a rigorous comparison across …rms, that have to answer the same questions, unlike Baumann-Pauly et al. (2013), who de…ne a priori di¤erent indicators for SMEs or for multinational companies, and focus on 12 so-called “data-rich”case studies (biased toward CSR champions). To our knowledge, this survey is the only one ever conducted that provides information on informal versus formal CSR.
Our contribution is twofold. First, on the methodological level, we propose an original way of constructing quantitative scores for the CSR practices of …rms, along the three traditional dimensions (economic and societal, social, environmental). Our work is the …rst one to construct CSR scores based on the non-parametric Mokken scale analysis, and thus to draw a very detailed picture of the features of CSR in French …rms. This method represents a clear progress compared to factorial analysis used in previous papers (Russo and Tencati (2009), Turker (2009)), while being less intensive in terms of calculation than the Bayesian IRT method put forward by Carroll et al. (2016). The scale for CSR that we obtain constitutes the most important contribution of our work. This scale can be used to test a large range of hypothesis about the drivers and outcomes of CSR in the French …rms. We propose some …rst results in this paper that pave the
way for fruitful future research.
Second, on the empirical level, in terms of understanding the mechanisms of CSR, our estimates make it possible to grasp the importance of size e¤ects, motivations for CSR and the pressure exerted by NGOs on the existence of a signi…cant proportion of informal CSR. We show that the …rst di¤erence between SMEs and large …rms lies in the understanding and simple knowledge of the CSR concept. But we also note that, among …rms that know it, a signi…cant share of them assert that they do not engage in any CSR related activity. Perhaps the most striking point is that many of them keep walking the walk without talking the talk... as they assert that they are not actively committed to CSR whereas they disclose signi…cant CSR activities. These speci…c behaviors are analyzed in detail. We …nd that the size e¤ect in the likelihood of conducting informal CSR is mitigated when companies cooperate with external actors, such as associations or NGOs. We also assess the impact on CSR scores of the organizational structure of companies and the in‡uence of pressure from NGO campaigns against large companies in the same industry, due to the threat of being attacked as well or the increased salience of environmental issues (Baron (2016), Baron and Diermeier (2007)).
The remainder of the paper is structured as follows. Section 2 presents the survey and the data. Section 3 is devoted to a discussion of the CSR scores used in the literature and to the implementation in our case of the Mokken scale analysis allowing us to construct an original scale for CSR, which disentangles pillar scores. Section 4 examines some features of CSR knowledge and implementation across French …rms. Section 5 o¤ers conclusions.
2
Data
2.1
The survey
The data used in this paper was collected through a survey conducted at the end of 2011 by the French National Institute of Statistics and Economic Studies (INSEE). 8,857 French …rms were required to …ll-in a mandatory questionnaire of about 60 questions regarding their knowledge and implementation of corporate social responsibility (CSR). The sample was carefully weighted in order to represent the size composition of the business sector in France, excluding only micro-enterprises (less then 10 employees). In the remainder of the paper, we follow the same de…nition of small, medium-sized, and large …rms as Russo and Tencati (2009) based on the de…nition established by the EU (EC (2003)): small …rms are …rms with less than 50 employees (including sub-category between 10 and 19 employees); medium-sized …rms are …rms with less
than 250 employees; …rms with a greater number of employees are considered large. In addition, the sample is comprehensive for …rms with more than 500 employees.
Contrary to Ernst and Honoré-Rougé (2012), who restricted their descriptive analysis of the survey’s results to …rms with more than 50 employees, we exploit the whole sample in order to fully take stock of its diversity in a common framework (as deemed necessary by Blombäck and Wigren (2009)), and to be able to also draw some conclusions about the di¤erences among small and medium-sized …rms.
The survey instrument was carefully designed by a committee of experts, hosted by the INSEE. The committee included statisticians from the INSEE, researchers in the …eld of environmental economics and numerous meetings were necessary to achieve the …nal version of the questionnaire. The questionnaire is composed of four main parts, the …rst one focused on general assertions about the …rm’s knowledge of CSR and governance issues and three parts focused on the three traditional “pillars”of CSR, namely the economic and societal pillar, the social pillar, and the environmental pillar.4 A prominent feature of this survey is
its …rst question: “Have you ever heard of Corporate Social responsibility?” In case of negative answer, the respondent was required to go directly to the following sections, which did not take for granted any preliminary knowledge about CSR. In case of positive answer, the next questions explored the meaning of the concept for the …rms, their feeling to behave as a responsible …rm, their motivations to do so and their internal organization to implement this corporate social responsibility.
The economic and societal pillar relates to how the …rm manages its relationships with its customers, its suppliers and the society at large. Examples of questions within the economic pillar part of the questionnaire are the following: “Do you ask some of your suppliers to commit themselves to respecting speci…cations, some of which are CSR-related clauses?”, or “Does your group cooperate with other companies or organizations for CSR actions? With which ones (…rms, administrations, NGOs, banks)?”
The social pillar covers actions taken by …rms to promote diversity and inclusion, to improve employee health and well-being, and human resources management. Examples of questions within the social pillar part of the questionnaire include: “Do you implement speci…c policies against discrimination based on gender? ethnic origin? age? disabled persons?”
The environmental pillar relates to the management of the …rm’s impact on the environment. Examples of questions within the environmental pillar section of the questionnaire are the following: “Does your …rm develop eco-friendly products?”, “Are some of your products eco-labelled?” or more thematically “Did your …rm commit to improving its energy e¢ ciency or to reducing its carbon emissions?”
2.2
Some descriptive statistics
About 60% of the …rms state that they have never heard about CSR. This percentage varies by industry (see Table 1) and also by size (Table 2): in the “Other service activities” sector, the percentage rises to about 67%, while it is only 23.7% in the “Electricity, Gas, Steam” sector.
Table 1: Having heard about CSR (No/Yes) - Frequency and percentage by industry
Sector Frequency No Yes
Mining and Quarrying 534 65.09 34.91
Manufacturing 31,366 58.05 41.95
Electricity, Gas, Steam 160 23.70 76.30
Water supply, sewerage, waste management 1,317 40.57 59.43
Construction 25,929 66.65 33.35
Wholesale and retail trade 35,672 64.65 35.35
Transportation and storage 9,206 59.40 40.60
Accommodation and food service activities 11,573 63.47 36.53
Information and communication 5,919 51.47 46.53
Real estate activities 2,721 58.26 41.74
Professional, scienti…c and technical activities 13,717 48.31 51.69
Administration and support activities 10,244 58.34 41.66
Other service activities 2,022 66.96 33.04
Likewise, 40% of medium-sized …rms (between 50 and 249 employees) claim not to have ever heard about CSR, whereas the percentage falls to only 10% for very large …rms (more than 500 employees).
Table 2: Having heard about CSR (No/Yes) - Frequency and percentage by size
Size Frequency No Yes
10-19 78,724 69.06 30.94 20-49 47,509 58.61 41.39 50-249 19,826 40.30 59.70 250-499 2,415 20.54 79.46 500+ 1,906 9.24 90.76 Total 150,380 60.43 39.57
About 52% percent of the …rms know about CSR and are currently taking actions related to CSR; 12%, despite having heard about CSR, state that they do not take any action related to CSR. Note that the design of the questionnaire allowed …rms which stated not to have ever heard about CSR to answer all the questions under the three CSR pillars’headings.
3
In search of a CSR score
3.1
The state of the art
As with de…ning CSR, measuring CSR is also challenging. Most of the empirical works related to CSR rely on the use of ratings, such as the Kinder, Lydenberg, and Domini (KLD) index (see Chatterji et al. (2016)). Raters actually employ proprietary methodologies to evaluate …rms’ environmental, social and governance performance. Even if these methodologies are not known in detail, they each proceed by gathering raw data from numerous sources, like o¢ cial government data, …rms’disclosures (e.g., press reports) and, sometimes, speci…c interviews. These raw data are then turned into scores, of which the structure can be more or less detailed. For example, the KLD score which serves as the basis of the analysis done by Carroll et al. (2016) is constructed from more than 80 binary indicators, each of them capturing whether or not a given …rm meets a given objective related to CSR. When necessary, subscores can be extracted from the full list of indicators, as in Lioui and Sharma (2012) and Chatterji et al. (2009) who use only the 14 KLD’s environmental “strengths” and “concerns” indicators which form the KLD’s environmental subscore.
That these ratings actually and accurately measure CSR remains an open question. As a matter of fact, the evaluation of six of the leading raters by Chatterji et al. (2016) concludes on a negative note regarding the validity of the most prominent CSR targeted scores (which, as Berg et al. (2020) show, can di¤er signi…cantly between rating agencies, mainly due to di¤erences in scope and measurement). Ratings, however, are not the only means of measuring CSR. Appropriately designed scales, at the individual or organizational level, can also provide reliable information to construct CSR scores (Turker (2009)). Compared to ratings, the scale approach operates by collecting information regarding CSR practices directly from the …rms, through the administration of a questionnaire made of CSR-related items, whereas raters actually do mainly content analysis.
Indeed, questionnaires are commonly designed to assess single latent traits (e.g., psychological trait, state of health, speci…c abilities, green attitudes). Constructing a unidimensional measure of a latent trait from responses to a set of binary (yes/no) and/or ordinal-polytomous questions is at the core of item response theory (IRT).
Carroll et al. (2016) recently introduced IRT with the goal of improving measurement in strategic management research. More precisely they adopt a Bayesian approach to estimating the parameters of a Rasch (1960) like model including elements of dynamics, constructing, from KLD data covering 22 years, what they call D-SOCIAL-KLD scores. They convincingly argue that the latter scores enrich the measurement of CSR, when compared to simple additive scores derived from the binary KLD indicators. The picture obtained
from the D-SOCIAL-KLD score appears much more nuanced, especially when it comes to the assessment of …rms’ involvement in CSR over time. Carroll et al. (2016) however acknowledge that obtaining such a nuanced picture of …rms’ latent CSR trait comes at a cost: the Bayesian approach is computationally intensive, and thus may not pay o¤ su¢ ciently in the case of single period data. Still, they call for further use of IRT models by researchers to advance measurement in strategic management research, notably in CSR.
Actually, IRT provides various models to construct a score that gives a unidimensional measure of the latent trait under study, from which the units (individuals, …rms) of interest can be ordered. Some are parametric, like the Rasch (1960) model, initially developed for dichotomous items - questions, or one-parameter logistic model, and later extended to polytomous items (see Embretson and Reise, 2000), or the partial credit model ( Zheng and Rabe-Hesketh (2007)).
3.2
A Mokken scale analysis of CSR practices
We retain here a non parametric approach: the Mokken scale analysis (MSA, Mokken, 1971). Indeed, the MSA is less demanding in terms of underlying assumptions than parametric models, and allows keeping more items to form the scale. Thus, the precision of the score constructed from the scale, simply by summing up the positive responses to the items forming the scale, is higher (Hardouin et al. (2011)). Note that both the Rasch model and the Mokken scale analysis can be seen as successors of the Guttman scaling technique (van Schuur (2003)). A set of binary items is said to form a perfect Guttman scale if a respondent who gives a positive response to a more di¢ cult (i.e., with a high proportion of negative responses) item will also give a positive response to all items that are less di¢ cult. In terms of CSR construct, this means that a …rm that claims to be involved in the less popular CSR-related activity, should also claim to be involved in all the other CSR-related (more popular) activities. Of course, empirical data sets show model (perfect Guttman scale) violations: a respondent who gives a positive response to a di¢ cult item can give a negative response to an easier item. Such a violation is called a Guttman error. In short, MSA proceeds by assessing model violations through the comparison of actual Guttman errors and theoretical Guttman errors obtained under the assumption of independence between the responses to two di¤erent items. On the basis of this comparison, Loevinger coe¢ cients are calculated, notably the Loevinger coe¢ cient of scalability (HS) which
measures whether a set of items actually forms a scale, here denoted S. The following rule of thumb (Mokken (1971); van Schuur (2003)) applies: when HS < 0:3, the scale is poor, when 0:3 HS < 0:4, the scale is
has been widely used in human resources management literature, for example to measure high-involvement work practices (Zatzick and Iverson (2006)). Applying MSA to the 2011 survey data allows us to derive CSR scores for each of the CSR pillars.
3.3
Pillar scores
The economic and societal pillar part of the survey comprises 15 binary questions, out of which 8 were found to form a weak scale (HS = 0:38). Regarding the social part of the survey, 21 binary questions were asked
to the respondents. 18 were found to form a medium scale (HS = 0:48). Finally the environmental pillar
was assessed through 8 items, which all form a strong scale (HS = 0:53).5 The economic and societal score
and the environmental score range both from 0 to 8, with the same median of 2, rather low, whereas the social score ranges from 0 to 18, with a median of 5.
Table 3: CSR scores by industry
Societal score Social score Environmental score
Mean Std Min/Max Mean Std Min/Max Mean Std Min/Max
Mining and Quarrying 1.88 1.82 0/8 5.56 4.05 0/16 3.56 1.80 1/8
Manufacturing 1.60 1.73 0/8 4.36 3.91 0/18 2.35 2.05 0/8
Electricity, Gas, Steam 3.34 1.89 0/8 8.21 4.26 1/18 4.44 1.69 1/8
Water supply, sewerage, waste management 2.49 2.13 0/8 6.98 4.67 0/18 3.74 2.01 0/8
Construction 2.00 1.74 0/8 3.78 3.44 0/18 1.79 1.80 0/8
Wholesale and retail trade 1.34 1.63 0/8 4.25 3.85 0/18 2.01 2.01 0/8
Transportation and storage 1.15 1.48 0/8 5.06 4.10 0/18 2.06 1.88 0/8
Accommodation and food service activities 1.61 1.73 0/8 4.65 4.07 0/18 2.50 2.26 0/8
Information and communication 0.91 1.44 0/8 4.51 4.24 0/18 1.09 1.47 0/8
Real estate activities 1.54 1.70 0/8 4.36 4.54 0/18 1.80 2.12 0/8
Professional, scienti…c and technical activities 1.18 1.72 0/8 4.21 4.22 0/18 1.40 1.89 0/8
Administration and support activities 1.68 1.88 0/8 4.99 4.33 0/18 1.99 2.12 0/8
Other service activities 1.32 1.56 0/7 3.92 3.61 0/18 1.51 1.85 0/7
Table 3 presents the mean scores by industry and their intra-industry distribution. The same sectors “Electricity, Gas, Steam”and “Water supply, sewerage, waste management”, commonly identi…ed as having signi…cant impacts on the environment, have the highest average scores not only for the environmental pillar but also for the other two. Across industries, the environmental score is the more unequally distributed with a standard error equal to 50% of its industry average (38% for the economic and social score, and 26% for the social score).
Beyond the Loevinger scalability coe¢ cients, the internal consistency of scales can be assessed by com-puting the associated Cronbach’s . Again, the standards for what makes a good Cronbach’s are not set in stone, but a value between 0.65 and 0.8 (or higher) is generally considered acceptable. The result for
each of the scales is respectively 0.76 for the economic and societal scale, 0.89 for the social scale and 0.79 for the environmental scale. Therefore, we can be con…dent in the internal consistency of the three scales, meaning that the related scores actually re‡ect the latent CSR traits underlying …rms’ involvement in the three pillars related activities.
We assess the external consistency of our scales by using the …rst question of the 2011 INSEE survey, which asked the respondents whether they “have ever heard about Corporate Social responsibility?”. This question was not involved in the construction of any of the three scores. Indeed, we expect that …rms claiming not to have ever heard about CSR score lower than the others. Table 4 shows clear evidence in support of our expectation, thus in support of external validity of the scores: for each of the three pillar scores, the di¤erence in mean scores between …rms claiming to have heard about CSR and …rms claiming the opposite is signi…cant and positive. If we take the mean score of the “do not know CSR”…rms as a reference, the di¤erence in percentage ranges from 76% (environmental score), to 88% (economic and societal, social scores).
Table 4: Pillar scores - di¤erence in means
Do not know CSR Know CSR
Mean score Mean score Di¤erence
Economic and societal score 1.13 2.12 0.99
- [0.97 ; 1.00]
Social score 3.23 6.09 2.86
- - [2.82 ; 2.89]
Environmental score 1.54 2.71 1.17
- - [1.14 ; 1.18]
95% con…dence interval into brackets
0 .1 .2 .3 .4 .5 Den si ty 2 4 6 8 S oc ietal s c ore Do not know CSR K now CS R
So cietal pillar score
0 .05 .1 .15 .2 Den si ty 5 10 15 20 S oc ial s core Do not know CSR K now CS R
So cial pillar score
0 .1 .2 .3 .4 Den si ty 3 4 5 6 7 8 E nvironmental s c ore Do not know CSR K now CS R
Environm ental pillar score
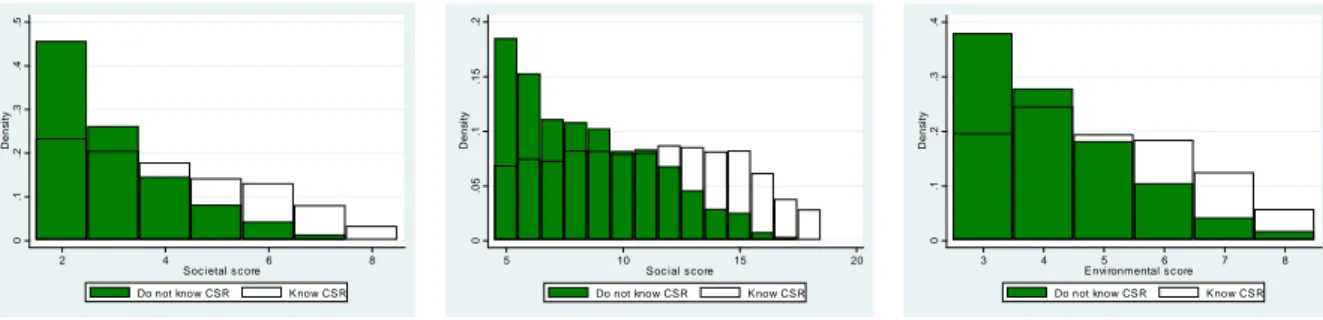
Figure 1: CSR pillar scores distributions
Actually, the scores do not only di¤er in mean, but also in their distributions. For example, Figure 1 depicts the three pillar scores for …rms that “do not know CSR” (meaning …rms claiming not to have ever
heard about CSR) and for those that “know CSR”. Clearly, the distribution of each of these score for the latter group of …rms shifts to the right, showing evidence in favor to the external validity of the score.
While acknowledging that a rigorous assessment of the three scores would require appropriate in-depth analysis, we consider to have collected su¢ cient evidence to be reasonably con…dent in their external validity. In addition, Table 5 reports the Spearman rank-correlation coe¢ cients between the three scores, along with 95% con…dence intervals6. Remember that the Spearman rank-correlation coe¢ cients measure the
statistical dependence between the ranking of two variables, here two ordinal variables, and assess the strength and direction of the monotonic relationship between these two variables.7
Table 5: Spearman rank-correlation coe¢ cients Do not know CSR
Economic and societal score Social score Environmental score
Economic and societal score 1
-Social score 0.296 1 [0.266 ; 0.327] -Environmental score 0.439 0.409 1 [0.411 ; 0.465] [0.381 ; 0.437] -Know CSR
Economic and societal score 1
-Social score 0.502 1
[0.481 ; 0.521]
-Environmental score 0.610 0.467 1
[0.593 ; 0.627] [0.445 ; 0.481]
-95% con…dence interval into brackets - Fisher’s transformation
Again, a striking result emerging from Table 5 is that not only the point estimates of the Spearman rank-correlation coe¢ cients di¤er in magnitude, but also that the 95 % con…dence intervals do not overlap between the two groups of …rms. The Spearman rank-correlation coe¢ cients between the three pillar scores are systematically and signi…cantly higher for the “know CSR”group than for the “do not know CSR”group. In any case, the Spearman rank-correlation coe¢ cients are always positive, indicating that when one score increases, the other scores also increase. In terms of CSR-related activities, this means that involvement in each of the three pillars related activities goes hand in hand.
6The 95% con…dence intervals are based on Fisher’s transformation.
7Chatterji et al. (2016) also use Spearman rank-correlation coe¢ cients in their e¤ort to assess whether ratings provided by
3.4
Informal and formal CSR
In our data, we identify …rms performing formal CSR, as de…ned by Russo and Tencati (2009), as …rms answering that they implement CSR strategies. The main part of them have high scores, in general and on individual details, but some of them also seem to score badly at least for one pillar.
Among the other …rms, we can distinguish two categories: …rms that answered that they have never heard about CSR and …rms that know the concept, or at least the word, but assert that they are not implementing any CSR strategy. Within these two categories, we consider that …rms scoring above a given mean pillar score as performing informal CSR for the corresponding pillar.8 Therefore, in view of subsequent estimations, we
de…ne three binary indicators (one for each pillar score) that take on the value of 1 when the …rm scores above the mean, and 0 otherwise.
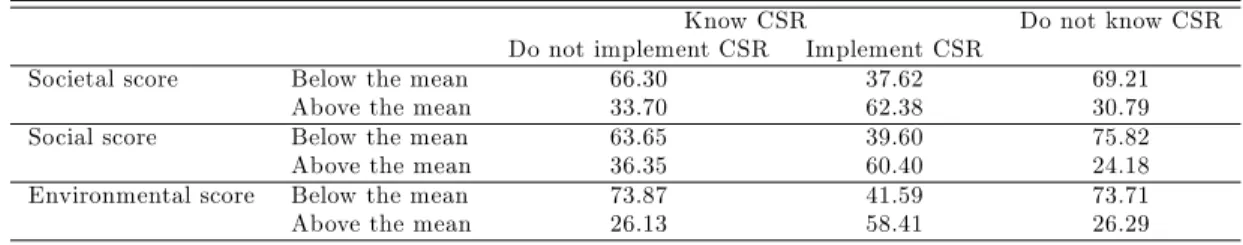
Table 6: Pillar scores
Know CSR Do not know CSR
Do not implement CSR Implement CSR
Societal score Below the mean 66.30 37.62 69.21
Above the mean 33.70 62.38 30.79
Social score Below the mean 63.65 39.60 75.82
Above the mean 36.35 60.40 24.18
Environmental score Below the mean 73.87 41.59 73.71
Above the mean 26.13 58.41 26.29
As can be seen from Table 6, …rms that answered that they have not ever heard about CSR actually score under the mean, most of the time. But a signi…cant percentage of them score above the mean: about 31% for the societal score, 24% for the social score and 26% for the environmental score. Likewise, among …rms having heard about CSR, but stating they don’t implement CSR strategies, a signi…cant percentage scores above the mean (respectively, 34%, 36% and 26%). Note that the percentages (below the mean, above the mean) for …rms which stated that they implement CSR strategies are reversed, as could be expected.
4
The drivers of informal vs formal CSR
4.1
Size e¤ects
According to Russo and Tencati (2009), the di¤erence between formal and informal CSR is mostly explained by the size of the …rms. Our data allow us to test this assumption in detail. To do so, we estimate three
8Because our data were transmitted by the companies within the framework of a survey for statistical purposes only, with
all the required guarantees of anonymity, we consider it unlikely that this re‡ects a strategic behavior of under-reporting, or brownwashing, as described by Kim and Lyon (2014) as well as by Lyon and Maxwell (2016).
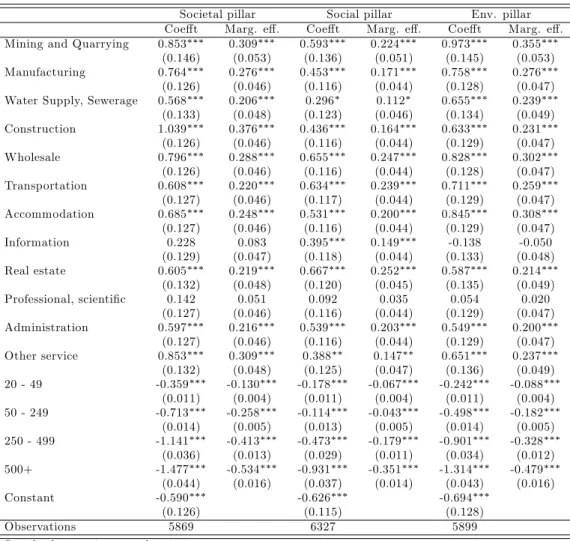
simple probit models, to characterize the probability of implementing informal versus formal CSR. The results and the associated marginal e¤ects are reported in Table 7.
Table 7: Probability of implementing informal CSR vs formal CSR
Societal pillar Social pillar Env. pillar
Coe¤t Marg. e¤. Coe¤t Marg. e¤. Coe¤t Marg. e¤.
Mining and Quarrying 0.853 0.309 0.593 0.224 0.973 0.355
(0.146) (0.053) (0.136) (0.051) (0.145) (0.053)
Manufacturing 0.764 0.276 0.453 0.171 0.758 0.276
(0.126) (0.046) (0.116) (0.044) (0.128) (0.047)
Water Supply, Sewerage 0.568 0.206 0.296 0.112 0.655 0.239
(0.133) (0.048) (0.123) (0.046) (0.134) (0.049) Construction 1.039 0.376 0.436 0.164 0.633 0.231 (0.126) (0.046) (0.116) (0.044) (0.129) (0.047) Wholesale 0.796 0.288 0.655 0.247 0.828 0.302 (0.126) (0.046) (0.116) (0.044) (0.128) (0.047) Transportation 0.608 0.220 0.634 0.239 0.711 0.259 (0.127) (0.046) (0.117) (0.044) (0.129) (0.047) Accommodation 0.685 0.248 0.531 0.200 0.845 0.308 (0.127) (0.046) (0.116) (0.044) (0.129) (0.047) Information 0.228 0.083 0.395 0.149 -0.138 -0.050 (0.129) (0.047) (0.118) (0.044) (0.133) (0.048) Real estate 0.605 0.219 0.667 0.252 0.587 0.214 (0.132) (0.048) (0.120) (0.045) (0.135) (0.049) Professional, scienti…c 0.142 0.051 0.092 0.035 0.054 0.020 (0.127) (0.046) (0.116) (0.044) (0.129) (0.047) Administration 0.597 0.216 0.539 0.203 0.549 0.200 (0.127) (0.046) (0.116) (0.044) (0.129) (0.047) Other service 0.853 0.309 0.388 0.147 0.651 0.237 (0.132) (0.048) (0.125) (0.047) (0.136) (0.049) 20 - 49 -0.359 -0.130 -0.178 -0.067 -0.242 -0.088 (0.011) (0.004) (0.011) (0.004) (0.011) (0.004) 50 - 249 -0.713 -0.258 -0.114 -0.043 -0.498 -0.182 (0.014) (0.005) (0.013) (0.005) (0.014) (0.005) 250 - 499 -1.141 -0.413 -0.473 -0.179 -0.901 -0.328 (0.036) (0.013) (0.029) (0.011) (0.034) (0.012) 500+ -1.477 -0.534 -0.931 -0.351 -1.314 -0.479 (0.044) (0.016) (0.037) (0.014) (0.043) (0.016) Constant -0.590 -0.626 -0.694 (0.126) (0.115) (0.128) Observations 5869 6327 5899
Standard errors in parentheses p < 0:05, p < 0:01, p < 0:001
Keeping in mind that the reference industry is “Electricity, Gas, Steam”, whereas the reference size is “10 - 19 employees”, the marginal e¤ects show some interesting results. For most of the industries, the probability of implementing informal CSR is higher, compared to the reference industry. The most important e¤ect on the probability of implementing informal CSR versus formal CSR is found for the “Mining and Quarrying” sector for the environmental pillar, for the “Construction” sector for the economic and societal pillar and for the “Real estate” sectors. These three sectors are among those least well informed about CSR (Table 1), but this does not explain everything, since a signi…cant e¤ect on the likelihood of doing informal rather than formal CSR is demonstrated for the “Water supply”sector, which is nevertheless mostly informed, but
les than “Electricity, Gas, Steam”.
The size e¤ect is found to be very clear: from Table 7, the probability of implementing informal CSR decreases monotonically with the …rms’size. This e¤ect is more pronounced for the environmental pillar than for the social pillar, but less than for the economic and societal pillar, whatever the size category considered. There is a large di¤erence between large …rms and very small ones: for …rms with more than 500 employees, the probability of implementing informal CSR actions related to the societal pillar is 0.53 probability points lower than for …rms with 10 to 19 employees. The di¤erence is of 0.35 probability points for the social pillar and 0.48 for the environmental pillar. But this di¤erence already appears between small and medium size …rms: 0.13 points for the societal pillar (0.07/0.09 for the social/environmental pillars) for …rms with 20-49 employees. Note that we did not …nd any signi…cant interaction e¤ects between size and industry.
4.2
Stating or not stating to implement CSR
Baumann-Pauly et al. (2013) argue that “small …rms possess several organizational characteristics that are favorable for promoting the internal implementation of CSR-related practices in core business functions, but constrain external communication and reporting about CSR. In contrast, large …rms possess several characteristics that are favorable for promoting external communication and reporting about CSR, but at the same time constrain internal implementation”.
We test this hypothesis by studying further the size impact on commitment to CSR, now focusing on …rms stating that they have heard about CSR. These …rms were asked whether they are implementing CSR strategies (implementing CSR-related actions). Of course, we expect that …rms stating that they implement CSR (hereafter S-CSR …rms, for stating CSR …rms) score higher than the others (NS-CSR …rms, for not stating CSR). Given our previous results, we also expect that scores increase with size. What is not clear, however, is whether the size e¤ect is similar for S-CSR …rms and NS-CSR …rms. To explore this question, we estimate Negative Binomial models, as our dependent variables (the pillar scores) can be considered as count data variables.9 We introduce interaction variables between size and the binary indicator coding S-CSR
…rms (variable S CSR in Table 8 that reports also the associated marginal e¤ects).
As above, the size e¤ect is clear: the e¤ect of the size on the score is signi…cantly positive, and increases with size. Moreover S-CSR …rms score higher than NS-CSR …rms. For example, the mean social score for S-CSR …rms is about 1.74 points higher than the same score for NS-CSR-…rms and the relative e¤ect is much more signi…cant for the environmental score (1.36 compared to a medain value equal to 2). All the
9Chatterji et al. (2009) also estimate count data models (Poisson and Negative Binomial) in their assessment of the KLD
Table 8: CSR knowledge, action and size e¤ect - Accounting for interaction e¤ects
Societal score Social score Env. score
Coe¤t Marg. e¤. Coe¤t Marg. e¤. Coe¤t Marg. e¤.
Mining and Quarrying -0.122 -0.259 -0.336 -2.048 -0.194 -0.526
(0.088) (0.187) (0.076) (0.466) (0.072) (0.195)
Manufacturing -0.361 -0.769 -0.299 -1.822 -0.361 -0.980
(0.068) (0.145) (0.059) (0.361) (0.056) (0.151)
Water Supply, Sewerage -0.108 -0.229 -0.018 -0.108 -0.231 -0.626
(0.073) (0.156) (0.063) (0.386) (0.060) (0.163) Construction -0.049 -0.105 -0.186 -1.132 -0.483 -1.309 (0.068) (0.145) (0.059) (0.362) (0.056) (0.152) Wholesale -0.411 -0.876 -0.206 -1.258 -0.481 -1.305 (0.068) (0.145) (0.059) (0.361) (0.056) (0.151) Transportation -0.660 -1.404 -0.129 -0.785 -0.528 -1.434 (0.069) (0.148) (0.060) (0.365) (0.057) (0.154) Accommodation -0.131 -0.278 0.014 0.085 -0.246 -0.669 (0.069) (0.147) (0.060) (0.364) (0.056) (0.153) Information -0.688 -1.464 -0.174 -1.062 -0.997 -2.704 (0.070) (0.150) (0.060) (0.367) (0.058) (0.157) Real estate -0.304 -0.646 -0.436 -2.659 -0.577 -1.565 (0.072) (0.154) (0.062) (0.381) (0.060) (0.162) Professional, scienti…c -0.517 -1.100 -0.208 -1.267 -0.782 -2.121 (0.069) (0.146) (0.059) (0.362) (0.056) (0.153) Administration -0.254 -0.540 -0.097 -0.594 -0.522 -1.416 (0.069) (0.147) (0.060) (0.364) (0.056) (0.153) Other service -0.871 -1.855 -0.290 -1.771 -0.940 -2.552 (0.079) (0.169) (0.065) (0.396) (0.065) (0.177) 20 - 49 -0.107 0.242 0.141 1.023 0.154 0.492 (0.019) (0.017) (0.013) (0.035) (0.016) (0.018) 50 - 249 0.229 0.776 0.749 4.079 0.526 1.063 (0.023) (0.023) (0.015) (0.057) (0.018) (0.024) 250 - 499 0.455 1.374 0.948 6.285 0.639 1.656 (0.059) (0.058) (0.041) (0.165) (0.048) (0.061) 500+ 0.529 2.061 1.095 7.813 0.630 2.043 (0.081) (0.074) (0.056) (0.222) (0.068) (0.074) S-CSR 0.528 1.194 0.336 1.737 0.612 1.366 (0.013) (0.015) (0.010) (0.040) (0.012) (0.017) 20 - 49 S-CSR 0.284 0.080 0.057 (0.022) (0.015) (0.018) 50 - 249 S-CSR 0.164 -0.138 -0.164 (0.025) (0.018) (0.021) 250 - 499 S-CSR 0.147 -0.099 -0.096 (0.062) (0.044) (0.050) 500+ S-CSR 0.294 -0.119 0.031 (0.083) (0.059) (0.070) Constant 0.502 1.450 0.808 (0.069) (0.059) (0.056) ln( ) -1.334 -1.228 -1.796 (0.019) (0.010) (0.022) Observations 5345 5345 5345
Standard errors in parentheses p < 0:05, p < 0:01, p < 0:001
sectors perform less than the reference sector “Electricity, Gas, Steam” with some sectoral di¤erences, and also some di¤erences by pillar. For the societal and environmental pillar, the worst performance is found for the “Information” sector, whereas the “bad” sector is “Real estate” for the social pillar. Regarding the interaction e¤ects, Table 8 provide some contrasted results. Indeed some of the interaction e¤ects are found to be signi…cant, sometimes with opposite signs for di¤erent size categories. Compared with NS-CSR …rms with 20 to 49 employees, S-CSR …rms with 20 to 49 employees score higher for each pillar, exhibiting actual higher involvement in each of the pillar related CSR activities. For S-CSR …rms with 50 to 249 employees, the behavior appears more heterogeneous: these …rms perform better for the societal related CSR activities, but do worse for the two other pillars related activities.
4.3
To have or not to have a CSR department
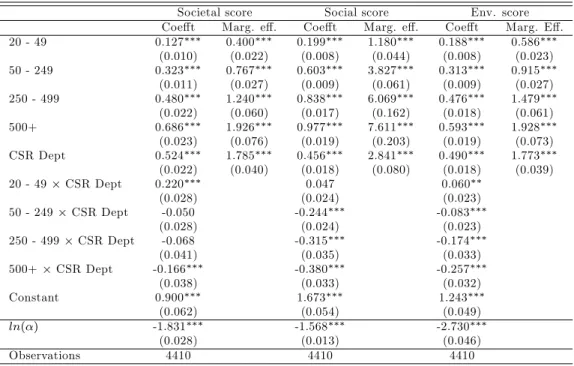
The 2011 INSEE survey enables to test whether some organizational features of the …rms have an impact on their CSR scores. For example, Murillo and Lozano (2006) argue that large companies are much closer to the generic discourse of CSR, given that CSR is the responsibility of a department that gives shape and contents to the concept through the creation of routines and procedures. Notably, S-CSR …rms were asked whether or not they have a CSR department. Again, we expect that S-CSR …rms having a CSR department score higher than S-CSR …rms not having a CSR department. However, does the e¤ect of having a CSR department on scores vary with size? Estimating Negative Binomial models with interactions e¤ects with a variable coding the presence of a CSR department (variable CSR_Dept in Table 9), we …nd evidence that this is the case.
Industry …xed e¤ects are omitted from the table but they show that no sector has higher scores than the reference sector10.
The marginal e¤ects in Table 9 still show clear size e¤ects. Having a CSR department is associated with a higher pillar score, ranging from 1.77 points to 2.84 points, depending on the pillar. However, the e¤ect of having a CSR department is more subtle than it could appear at …rst sight. Indeed, some interaction e¤ects are found to be signi…cant in Table 9. The e¤ect of having a CSR department is actually greater for …rms with 20 to 49 employees (positive and signi…cant interaction e¤ect, except for the social score), than for …rms with more than 500+ (negative and signi…cant interaction e¤ect). Thus, the return of creating a CSR department is always positive, but seems to be even more important for small size …rms.
Table 9: CSR department and size e¤ect - Accounting for interaction e¤ects
Societal score Social score Env. score
Coe¤t Marg. e¤. Coe¤t Marg. e¤. Coe¤t Marg. E¤.
20 - 49 0.127 0.400 0.199 1.180 0.188 0.586 (0.010) (0.022) (0.008) (0.044) (0.008) (0.023) 50 - 249 0.323 0.767 0.603 3.827 0.313 0.915 (0.011) (0.027) (0.009) (0.061) (0.009) (0.027) 250 - 499 0.480 1.240 0.838 6.069 0.476 1.479 (0.022) (0.060) (0.017) (0.162) (0.018) (0.061) 500+ 0.686 1.926 0.977 7.611 0.593 1.928 (0.023) (0.076) (0.019) (0.203) (0.019) (0.073) CSR Dept 0.524 1.785 0.456 2.841 0.490 1.773 (0.022) (0.040) (0.018) (0.080) (0.018) (0.039) 20 - 49 CSR Dept 0.220 0.047 0.060 (0.028) (0.024) (0.023) 50 - 249 CSR Dept -0.050 -0.244 -0.083 (0.028) (0.024) (0.023) 250 - 499 CSR Dept -0.068 -0.315 -0.174 (0.041) (0.035) (0.033) 500+ CSR Dept -0.166 -0.380 -0.257 (0.038) (0.033) (0.032) Constant 0.900 1.673 1.243 (0.062) (0.054) (0.049) ln( ) -1.831 -1.568 -2.730 (0.028) (0.013) (0.046) Observations 4410 4410 4410
Standard errors in parentheses p < 0:05, p < 0:01, p < 0:001
4.4
Pressure from NGOs and CSR scores
We now explore the e¤ect of pressure exerted by non-governmental organizations (NGOs) attacks on CSR scores. In particular, we would like to test the hypothesis that NGOs’attacks, which target large companies, could have both a direct e¤ect on large …rms and a crowding-in e¤ect on smaller …rms in the same industry. For this purpose we have matched the data from our main database with data from the Sigwatch database, that lists for the period 2010-2015, all campaigns by NGOs in 103 di¤erent countries, against multinational …rms (Koenig (2017), Hatte and Koenig (2018)). We extract from Sigwatch data the number of NGOs’ attacks of French companies by industry for the years 2010 and 2011: 138 attacks in two years mostly focused on environmental issues (96%). We then measure the intensity of attacks by industry as the ratio between the number of attacks and the number of large companies (more than 500 employees) of each industry. The corresponding ratio (variable attack_intens) ranges from 0 to 5 (see Table 10), as one …rm may be the target of several attacks.
This ratio is interacted with …rms size; the idea here is to analyze possible crowding-in e¤ects. Table 11 shows how the size e¤ect is modulated by the intensity of the attacks. As earlier, the dependent variable is each pillar score, and Negative Binomial models are estimated.
Table 10: NGOs attack intensity by sector
NGOs actions (number of attacks) 500+ (number of …rms) Attack intensity
Mining and Quarrying 2 5 0.4000
Manufacturing 52 656 0.0793
Electricity, Gas, Steam 55 11 5.0000
Water Supply, Sewerage 3 36 0.0833
Construction 7 145 0.0483 Wholesale 5 362 0.0138 Transportation 6 140 0.0429 Accommodation 4 61 0.0656 Information 4 129 0.0310 Real estate 0 34 0.0000 Professional, scienti…c 0 136 0.0000 Administration 0 182 0.0000 Other service 32 10 3.2000
Table 11: CSR and NGOs attack intensity by sector
Societal score Social score Env. score
Coe¤t Marg. E¤. Coe¤t Marg. E¤. Coe¤t Marg. E¤.
20 - 49 0.212 0.314 0.341 1.482 0.296 0.606 (0.007) (0.010) (0.005) (0.022) (0.006) (0.013) 50 - 249 0.525 0.796 0.875 3.807 0.590 1.192 (0.009) (0.014) (0.007) (0.031) (0.008) (0.017) 250 - 499 0.900 1.363 1.207 5.258 0.895 1.793 (0.021) (0.032) (0.016) (0.071) (0.019) (0.039) 500+ 1.225 1.857 1.384 6.015 1.082 2.166 (0.022) (0.035) (0.018) (0.079) (0.021) (0.043) attack_intens -0.063 -0.100 0.052 (0.013) (0.032) (0.017) 20 - 49 attack_intens -0.074 -0.026 0.067 (0.018) (0.013) (0.016) 50 - 249 attack_intens -0.057 -0.044 0.030 (0.026) (0.019) (0.024) 250 - 499 attack_intens -0.101 -0.041 -0.029 (0.049) (0.039) (0.047) 500+ attack_intens -0.130 -0.082 -0.059 (0.050) (0.041) (0.048) Constant 1.109 1.774 1.134 (0.087) (0.069) (0.080) ln( ) -0.500 -0.760 -0.580 (0.009) (0.006) (0.009) Observations 8757 8757 8757
Standard errors in parentheses p < 0:05, p < 0:01, p < 0:001
As can be seen from Table 11, the direct size e¤ect on scores is always positive (relative to size category 10-19). For the social and societal pillars, the size e¤ect is, in most cases, signi…cantly moderated by the intensity of NGOs’attacks. On the other hand, the size e¤ect is signi…cantly accentuated for the environmental pillar score, but only for the size category 20-49. The e¤ect is very signi…cant. There would therefore be a crowding-in e¤ect, for …rms in the 20-49 category, in relation to the intensity of attacks targeting large …rms (as suggested by Lyon and Maxwell (2008)).
The total e¤ect of the intensity of the attacks on the three scores is signi…cant and slightly negative for the social and societal scores, signi…cant and slightly positive for the environmental score. As a result, NGOs attacks, generally focused on large …rms and on environmental issues, may tend to focus …rms’CSR on actions that fall under the environmental pillar, to the detriment of actions under the other pillars. In short, there would be a crowding-out e¤ect related to the intensity of NGOs’attacks on social and societal scores. It can be assumed that the resources devoted to CSR actions are being redeployed in favour of the environmental pillar, under pressure from NGOs.
4.5
Cooperation with other …rms and associations as a path towards formal
CSR
To further illustrate the impaact of cooperation with di¤erent stakeholders, Table 12 presents additional interaction e¤ects showing how the size e¤ect on the probability of implementing informal versus formal CSR is reinforced when …rms cooperate with other …rms, association and/or non-governmental organizations in the implementation of CSR related actions.
Table 12: Probability of implementing informal CSR vs formal CSR - Interaction e¤ects with cooperation or NGOs’attack
Societal score Social score Env. score Societal score Social score Env. score
Cooperation with other …rms = Yes Commitment to various actions and cooperation with NGOs = Yes
20 - 49 Yes -0.343 -0.370 -0.382 20 - 49 Yes -0.947 -0.419 -0.904 (0.031) (0.037) (0.036) (0.078) (0.081) (0.073) 50 - 249 Yes -0.269 -0.627 -0.346 50 - 249 Yes -1.531 -1.304 -1.643 (0.036) (0.040) (0.040) (0.117) (0.107) (0.103) 250 - 499 Yes -0.175 -0.515 -0.257 250 - 499 Yes -0.825 -0.922 -1.221 (0.081) (0.078) (0.085) (0.174) (0.175) (0.172) 500+ Yes -0.499 -0.704 -0.435 500+ Yes -1.373 -1.176 -1.698 (0.099) (0.095) (0.103) (0.271) (0.235) (0.272)
Cooperation with associations = Yes NGOs’ attack intensity = Yes
20 - 49 Yes -0.362 0.854 -1.224 20 - 49 attack_intens -0.202 -0.023 -0.044 (0.059) (0.120) (0.078) (0.028) (0.029) (0.028) 50 - 249 Yes -0.406 0.607 -0.772 50 - 249 attack_intens -0.351 -0.157 -0.245 (0.066) (0.122) (0.072) (0.058) (0.042) (0.055) 250 - 499 Yes -0.384 0.558 -0.731 250 - 499 attack_intens -0.530 0.010 -0.056 (0.124) (0.161) (0.135) (0.359) (0.073) (0.101) 500+ Yes -0.658 0.462 -0.823 500+ attack_intens -0.158 0.006 0.086 (0.142) (0.171) (0.148) (0.164) (0.094) (0.094)
Standard errors in parentheses p < 0:05, p < 0:01, p < 0:001
As found earlier, the probability of implementing informal CSR decreases with size. Firms were asked: “Do you cooperate with other …rms or organizations for CSR actions?”; if yes, …rms were asked “With
associations? (yes/no)”. Also, a speci…c question is whether …rms cooperate with NGOs in carrying out CSR-related actions. All the interaction e¤ects between size and binaries coding the three types of cooperation are found highly signi…cant and negative, meaning that cooperation acts as a lever for formal CSR, with the noticeable exception of the size/cooperation with associations for the social pillar. Firms probably cooperate with associations in the …eld of human resources management, which is at the core of the social pillar of CSR, as handled by the questionnaire (see the questionnaire in Appendix). The stronger negative interaction e¤ect on the probability of implementing informal CSR is found for cooperation with NGOs, keeping in mind that the percentage of …rms which actually cooperate with NGOs is low, ranging from 1.69% for 10-19 size category to 8.76% for 500+ size category.
4.6
Motives for pro-environmental actions and informal CSR
Concerning the environmental pillar of CSR, …rms were asked about the pro-environmental actions they were implementing. For example (see the questionnaire, in Appendix), …rms were asked whether they were “engaged in an environmental management approach”, whether they had “an energy e¢ ciency or emission reduction plan” or “a waste reduction and recycling plan”. This series of questions ends with a question worded as follows: “What is the main determinant of your commitment to the above approach(s)?” Five items were proposed in response: 1. To develop new products, 2. To enhance the …rm’s image, 3. Ethical approach to environmental protection, 4. To motivate employees, 5. Cost cutting. In order to explore how these motives could in‡uence the e¤ect of …rm size on the probability of implementing informal CSR, we estimated probit models that include interaction terms between size and motives variables. Since these two categorical variables are discretized, we focus here on the marginal e¤ects of the motives (relative to the reference motive, “To develop new products”) for each size category (see Table 13).
The e¤ect of size on the probability of implementing informal CSR remains the same as in previous models: the probability of implementing informal CSR decreases with size. Table 17 shows that the motive/size interaction e¤ects are di¤erentiated by motive and size category. Thus motive 2 “To enhance the …rm’s image”, increases the probability of doing informal CSR for …rms with 10 to 19 employees, decreases this same probability for …rms with 20 to 49 employees, and has no e¤ect for the other size categories. This suggests that small …rms (10-19 employees) actually invest in pro-environmental actions for reasons that are more related to an expected return in terms of image than to a formal commitment to CSR.
On the other hand, motive 3 “Ethical approach to Environmental Protection” can be understood as the expression of an intrinsic motivation for CSR. Here the marginal e¤ects are all signi…cant and negative,
Table 13: Informal CSR vs formal CSR and motives for commitment in various CSR related actions
M arginal e¤ects of m otives for each size category
Size Societal score Social score Env. score Size Societal score Social score Env. score
Reference category: motive=1, "To develop new products"
motive=2, "To enhance the …rm’s image" motive=4, "To motivate employees"
10 - 19 0.453 0.140 0.087 10 - 19 -0.089 -0.019 -0.023 (0.009) (0.010) (0.010) (0.011) (0.013) (0.012) 20 - 49 -0.097 -0.016 -0.067 20 - 49 -0.112 0.050 -0.117 (0.010) (0.010) (0.010) (0.014) (0.014) (0.014) 50 - 249 0.020 0.001 -0.010 50 - 249 -0.031 -0.035 -0.075 (0.013) (0.013) (0.013) (0.019) (0.019) (0.020) 250 - 499 -0.036 -0.003 0.012 250 - 499 -0.010 -0.060 -0.101 (0.028) (0.031) (0.030) (0.048) (0.047) (0.041) 500+ 0.032 0.052 0.023 500+ 0.021 -0.054 -0.021 (0.024) (0.028) (0.025) (0.045) (0.038) (0.039)
motive=3, "Ethical approach to environmental protection" motive=5, "Cost cutting"
10 - 19 -0.133 -0.123 -0.031 10 - 19 0.070 0.151 0.182 (0.008) (0.010) (0.009) (0.009) (0.011) (0.009) 20 - 49 -0.141 -0.095 -0.142 20 - 49 -0.024 0.081 -0.039 (0.009) (0.009) (0.008) (0.010) (0.011) (0.010) 50 - 249 -0.143 -0.126 -0.130 50 - 249 0.030 0.108 0.088 (0.010) (0.010) (0.011) (0.013) (0.012) (0.013) 250 - 499 -0.080 -0.107 -0.088 250 - 499 0.020 0.068 0.047 (0.022) (0.024) (0.022) (0.028) (0.030) (0.029) 500+ -0.021 -0.046 -0.032 500+ 0.074 0.095 0.091 (0.015) (0.018) (0.016) (0.027) (0.029) (0.028)
Standard errors in parentheses p < 0:05, p < 0:01, p < 0:001
showing that this is a motive that is more associated with a formal practice of CSR. When …rms report taking pro-environmental actions to motivate their employees, the marginal e¤ect obtained is generally not signi…cant; however, for category 20-49 employees this motivation is associated with a higher involvement in formal CSR for the societal and environmental pillar, and a lower involvement for the social pillar (which is the pillar speci…cally concerning human resources management, see the questionnaire in Appendix).
Finally, motive 5 “Cost cutting” generally moderates the size e¤ect on the probability of implementing informal CSR and is therefore associated, particularly for small …rms (for which marginal e¤ects are most important) with an increased practice of informal CSR.
5
Conclusions
In this article, we have shown, using …rst-hand raw data from a large-scale survey on French …rms’commit-ment to CSR, the usefulness of Item Response Theory, namely Mokken Scale Analysis, for the construction of appropriate scores to assess actual CSR-related behaviors. We provide some convincing evidence regard-ing not only the internal validity, but also the external validity of these scores. Usregard-ing simple, but robust, econometric techniques, we draw a detailed picture of size e¤ects on …rms’ commitment to CSR. Beyond
that, informal and formal CSR are characterized, with the …nding that a signi…cant share of the …rms are in truth committed to CSR, while stating that they are not. Our work o¤ers original features, which allow us to obtain a very precise and detailed picture of the CSR behaviors of French …rms, along the three pillars: economic and societal, social, environmental.
In this article, we used one question of the survey to assess the external consistency of the scores based on other questions. However, assessing the external consistency of scales, including CSR scales, may be more challenging. Usually, when researchers create a new scale, the external validity is tested by comparing scores across groups of units (…rms, individuals) with known properties (or behaviors).11 As regards CSR ratings,
Carroll et al. (2016) stress the fact that an entire literature has emerged, with the purpose of assessing their validity. As an illustration, Chatterji et al. (2009) focus on the environmental rating provided by KLD (14 binary indicators coding environmental “strengths” and “concerns”). In order to assess how this environmental rating performs in providing transparent information about …rms’responsible (or irresponsi-ble) behavior to stakeholders, they collect data on …rms’environmental performance from external sources (notably from the US Environmental Protection Agency) and use econometric techniques (mainly Poisson and Negative Binomial models) to explore the statistical association between the rating and the actual …rms’ behavior. Their results cast some doubts on the external validity of the KLD rating. Such an approach could be applied to the three scores that we have constructed. We leave this assessment and comparison to future work.
We believe that CSR scores derived from MSA are a reliable basis for future work and might provide useful improvements compared to existing CSR scales. As argued by Chatterji et al. (2009), valid measures of CSR commitment are a necessary step in the exploration of CSR-related behaviors, as well as a necessary step in the derivation of well-founded academic conclusions regarding the relationship between, e.g., CSR performance and innovation in green products, CSR performance and …nancial performance (Blasi et al. 2018), to name but a few.
1 1For example, when presenting their revised version of the New Ecological Paradigm (NEP) scale, Dunlap et al. (2000)
recall that the external validity of the previous version of the NEP scale was con…rmed by numerous studies targeting interest groups such as environmental organizations. Remembering that the NEP scale aims at measuring pro-environmental behaviors, environmentalists were found to score higher on the NEP scale than the general public. Also, Dunlap et al. (2000) report that numerous studies have found signi…cant relationships between NEP scale scores and self-reported or observed pro-environmental attitudes.
References
Aguinis, H., and A. Glavas, 2012. What we know and don’t know about corporate social responsibility: a review and research agenda. Journal of management, 38(4), 932-968.
Baron D.P., 2001 Private politics, corporate social responsibility, and integrated strategy. Journal of Economics and Management Strategy, 10:7–45.
Baron, D. P., 2016. Self-Regulation and the Market for Activism, Journal of Economics & Management Strategy, 25(3), 584-607.
Baron D.P. and D. Diermeier, 2007 Strategic Activism and Non-Market Strategy, Journal of Economics and Man-agement Strategy, 6/3, 599-634.
Berg, F., Koelbel, J. F., & Rigobon, R. (2020). Aggregate confusion: the divergence of ESG ratings. MIT Sloan School Working Paper 5822-19. Available at SSRN 3438533.
Blasi, S., Caporin, M., and F. Fontini, 2018. A multidimensional analysis of the relationship between corporate social responsibility and …rms’economic performance. Ecological Economics, 147, 218-229.
Blombäck, A., and C. Wigren, 2009. Challenging the importance of size as determinant for CSR activities. Manage-ment of EnvironManage-mental Quality: An International Journal, 20(3), 255-270.
Baumann-Pauly, D., Wickert, C., Spence, L. J., and A. G. Scherer, 2013. Organizing corporate social responsibility in small and large …rms: Size matters. Journal of Business Ethics, 115(4), 693-705.
Carroll, R. J., Primo, D. M., and B. K. Richter, 2016. Using item response theory to improve measurement in strategic management research: An application to corporate social responsibility. Strategic Management Journal, 37(1), 66-85.
Chatterji, A. K., Levine, D. I., and M. W. To¤el, 2009. How well do social ratings actually measure corporate social responsibility?. Journal of Economics & Management Strategy, 18(1), 125-169.
Chatterji, A. K., Durand, R., Levine, D. I., and S. Touboul, 2016. Do ratings of …rms converge? Implications for managers, investors and strategy researchers. Strategic Management Journal, 37: 1597–1614.
Cordeiro, J. J., & M. Tewari, 2015. Firm characteristics, industry context, and investor reactions to environmental CSR: A stakeholder theory approach. Journal of Business Ethics, 130(4), 833-849.
Crifo, P., and V.D. Forget, 2015. The economics of corporate social responsibility: A …rm-level perspective survey. Journal of Economic Surveys, 29(1), 112-130.
Croson, R., and N. Treich, 2014. Behavioral environmental economics: promises and challenges. Environmental and Resource Economics, 58(3), 335-351.
Delmas, M., & M. W. To¤el, 2004. Stakeholders and environmental management practices: an institutional frame-work. Business Strategy and the Environment, 13(4), 209-222.
Delmas, M., & M. W. To¤el, 2011. Institutional pressures and organizational characteristics: Implications for en-vironmental strategy. In Oxford handbook of business and the environment (Ch. 13. pp. 229–247). Oxford: Oxford University Press.
Drempetic, S., Klein, C., and B. Zwergel, 2019. The In‡uence of Firm Size on the ESG Score: Corporate Sustainability Ratings Under Review. Journal of Business Ethics, 1-28.
Dunlap, R. E., Van Liere, K. D., Mertig, A. G., and R.E. Jones, 2000. Measuring endorsement of the New Ecological Paradigm: A revised NEP scale. Journal of Social Issues, 56(3), 425–442.
European Commission, 2001. Green Paper - Promoting a European framework for Corporate Social Responsibility. COM/2001/366. Brussels.
European Commission, 2003. SMEs in Europe 2003. Enterprise Publications. Luxembourg.
European Commission, 2011. A renewed EU strategy 2011-14 for Corporate Social Responsibility. Communication from the Commission to the European Parliament, the Council, the European Economic and Social Committee and the Committee of the Regions. COM/2011/0681.
Ernst, E., and Y. Honoré-Rougé, 2012. La responsabilité sociétale des entreprises : une démarche déjà répandue. INSEE Première, 1421.
Freeman, R. (1984). E.(1984), Strategic management: A stakeholder approach. Boston: Pitman, 46.
Gatti, L., Seele, P., & Rademacher, L. (2019). Grey zone in–greenwash out. A review of greenwashing research and implications for the voluntary-mandatory transition of CSR. International Journal of Corporate Social Responsibility, 4(1), 6.
Graa‡and, J., and R. Gerlagh, 2019. Economic freedom, internal motivation, and corporate environmental responsi-bility of SMEs. Environmental and Resource Economics, 74(3), 1101-1123.
Hardouin, J.-B. , Bonnaud-Antignac, A. and V. Sébille, 2011. Nonparametric Item Response Theory using Stata. The Stata Journal, 11(1), 30-51.
Hatte, S., and P. Koenig. 2018. The Geography of NGO Activism against Multinational Corporations. The World Bank Economic Review. doi: 10.1093/wber/lhy007
Jenkins, H., 2009. A ‘business opportunity’ model of corporate social responsibility for small- and medium-sized enterprises. Business ethics: a European review, 18(1), 21-36.
Kim, E. H., and T. P. Lyon, 2014. Greenwash vs. brownwash: Exaggeration and undue modesty in corporate sus-tainability disclosure. Organization Science, 26(3), 705-723.
Kitzmueller, M., and J. Shimshack, 2012. Economic perspectives on corporate social responsibility. Journal of Eco-nomic Literature, 50(1), 51-84.
Koenig, P., 2017. Notes on Sigwatch’s NGO campaign database. halshs-01671758.
Kühn, A. L., Stiglbauer, M., and J. Heel, 2014. Does mandatory CSR reporting lead to higher CSR transparency? The case of France. Corporate Ownership and Control, 11(2), 29-45.
Lioui, A., and Sharma, Z., 2012. Environmental corporate social responsibility and …nancial performance: Disentan-gling direct and indirect e¤ects. Ecological Economics, 78, 100-111.
Lyon, T. P., & Maxwell, J. W. (2008). Corporate social responsibility and the environment: A theoretical perspective. Review of environmental economics and policy, 2(2), 240-260.
Lyon, T. P., & Maxwell, J. W. (2016). Self-Regulation and regulatory discretion: Why …rms may be reluctant to signal green. In Strategy Beyond Markets. Emerald Group Publishing Limited.
Lyon, T. P., & Montgomery, A. W. (2015). The means and end of greenwash. Organization & Environment, 28(2), 223-249.
Magill, M., Quinzii, M., and J. C. Rochet, 2015. A theory of the stakeholder corporation. Econometrica, 83(5), 1685-1725.
Matten, D., and J. Moon, 2008. “Implicit” and “explicit” CSR: A conceptual framework for a comparative under-standing of corporate social responsibility. Academy of Management Review, 33(2), 404-424.
Murillo, D., and J.M. Lozano, 2006. SMEs and CSR: An approach to CSR in their own words. Journal of Business Ethics, 67(3), 227-240.
O’Connor, A., Parcha, J. M., & Tulibaski, K. L. (2017). The institutionalization of corporate social responsibility communication: An intra-industry comparison of MNCs’ and SMEs’ CSR reports. Management Communication Quarterly, 31(4), 503-532.
OECD, 2019, OECD SME and Entrepreneurship Outlook 2019, OECD Publishing, Paris.
https://doi.org/10.1787/34907e9c-en
Perrini, F., Russo, A., and A. Tencati, 2007. CSR strategies of SMEs and large …rms. Evidence from Italy. Journal of Business Ethics, 74(3), 285-300.
Rasch, G., 1960. Probabilistic Models for Some Intelligence and Attainment Tests. Copenhagen: Danmarks Peda-gogiske Institut.
Russo, A., & F. Perrini, 2010. Investigating stakeholder theory and social capital: CSR in large …rms and SMEs. Journal of Business Ethics, 91(2), 207-221.
Russo, A., and A. Tencati, 2009. Formal vs. informal CSR strategies: Evidence from Italian micro, small, medium-sized, and large …rms. Journal of Business Ethics, 85, 339-353.
Spence, L. J., 1999. Does size matter? The state of the art in small business ethics. Business ethics: a European review, 8(3), 163-174.
Spence, L. J., Schmidpeter R., and A. Habisch. 2003, Assessing Social Capital: Small and Medium Sized Enterprises in Germany and the UK, Journal of Business Ethics, 47(1), 17-29.
Schmitz, J., and Schrader, J. 2015. Corporate social responsibility: A microeconomic review of the literature. Journal of Economic Surveys, 29(1), 27-45.
Torugsa, N. A., O’Donohue, W., & Hecker, R. (2012). Capabilities, proactive CSR and …nancial performance in SMEs: Empirical evidence from an Australian manufacturing industry sector. Journal of Business Ethics, 109(4), 483-500.
Turker, D., 2009. Measuring corporate social responsibility: A scale development study. Journal of Business Ethics, 85(4), 411-427.
van Schuur, W. H., 2003. Mokken scale analysis: Between the Guttman scale and parametric item response theory. Political Analysis, 11(2), 139-163.
Vatn, A, 2018. Environmental governance–from public to private?. Ecological Economics, 148, 170-177.
Vo, L. C., Delchet-Cochet, K., and H. Akeb, 2015. Motives Behind The Integration Of CSR Into Business Strategy: A Comparative Study In French SMEs. Journal of Applied Business Research, 31(5), 1975.
World Business Council for Sustainable Development (WBCSD), 2004. Cross-cutting themes— Corporate responsi-bility. http://www.wbcsd.org/
Zatzick, C.D., and R. D. Iverson, 2006. High-Involvement Management and Workforce Reduction: Competitive Advantage or Disadvantage?. Academy of Management Journal, 49(5), 999–1015.
Zheng, X., and S. Rabe-Hesketh, 2007. Estimating parameters of dichotomous and ordinal item response models with gllamm. The Stata Journal 7(3): 313-333.