• Aucun résultat trouvé

Title : Citation analysis of scientific categories Auteurs:

N/A
N/A
Protected

Academic year: 2021

Partager "Title : Citation analysis of scientific categories Auteurs:"

Copied!
25
0
0

Texte intégral

(1)

Title : Citation analysis of scientific categories Auteurs:

Authors : Gregory S. Patience, Christian A Patience, Bruno Blais et Francois Bertrand

Date: 2017

Type: Article de revue / Journal article

Référence:

Citation : Patience, G. S., Patience, C. A., Blais, B. & Bertrand, F. (2017). Citation analysis of scientific categories. Heliyon, 3(5). doi:10.1016/j.heliyon.2017.e00300

Document en libre accès dans PolyPublie

Open Access document in PolyPublie

URL de PolyPublie:

PolyPublie URL: https://publications.polymtl.ca/3594/

Version: Version officielle de l'éditeur / Published version Révisé par les pairs / Refereed

Conditions d’utilisation:

Terms of Use : CC BY

Document publié chez l’éditeur officiel Document issued by the official publisher

Titre de la revue:

Journal Title: Heliyon (vol. 3, no 5) Maison d’édition:

Publisher: Elsevier URL officiel:

Official URL: https://doi.org/10.1016/j.heliyon.2017.e00300 Mention légale:

Legal notice:

Ce fichier a été téléchargé à partir de PolyPublie, le dépôt institutionnel de Polytechnique Montréal

This file has been downloaded from PolyPublie, the institutional repository of Polytechnique Montréal

http://publications.polymtl.ca

(2)

26 November 2016 Revised:

20 April 2017 Accepted:

27 April 2017 Heliyon 3 (2017) e00300

Citation analysis of scientific categories

Gregory S. Patience

a,∗

, Christian A. Patience

b

, Bruno Blais

a

, Francois Bertrand

a

a

Department of Chemical Engineering, Polytechnique Montréal, C.P. 6079, Succ. CV, Montréal, H3C 3A7 Québec,

Canada

b

Department of Mechanical Engineering, McGill University, Montréal, Québec, Canada

* Corresponding author.

E-mail address: gregory-s.patience@polymtl.ca (G.S. Patience).

Abstract

Databases catalogue the corpus of research literature into scientific categories and report classes of bibliometric data such as the number of citations to articles, the number of authors, journals, funding agencies, institutes, references, etc. The number of articles and citations in a category are gauges of productivity and scientific impact but a quantitative basis to compare researchers between categories is limited. Here, we compile a list of bibliometric indicators for 236 science categories and citation rates of the 500 most cited articles of each category. The number of citations per paper vary by several orders of magnitude and are highest in multidisciplinary sciences, general internal medicine, and biochemistry and lowest in literature, poetry, and dance. A regression model demonstrates that citation rates to the top articles in each category increase with the square root of the number of articles in a category and decrease proportionately with the age of the references: articles in categories that cite recent research are also cited more frequently. The citation rate correlates positively with the number of funding agencies that finance the research. The category ℎ-index correlates with the average number of cites to the top 500 ranked articles of each category (𝑅 2 = 0.997 ). Furthermore, only a few journals publish the top 500 cited articles in each category: four journals publish 60% (𝜎 = ±20% ) of these and ten publish 81% (𝜎 = ±15% ).

Keywords: Information Science

(3)

1. Introduction

Bibliometric indicators contribute to ranking universities (Kinney, 2007, Moed, 2017), researchers (Hirsch, 2005, Verma, 2015), and journals (Garfield, 2006), and funding decisions for institutes and governments (Bornmann et al., 2008, Bornmann and Daniel, 2008). An individual’s citation count and ℎ-index, and the impact factor of the journal’s that publishes their work provide input to awards and promotion committees. However, when these committees examine diverse dossiers and compare prestige and productivity between categories, they have little quantitative metrics to substantiate their decisions. Ranking criteria include alumni, awards, highly cited individuals, the number of articles in the Science Citation Index-Expanded and Social Science Index, and articles published in Science and Nature (ARWU, 2016). Citation counts are the basis of several bibliometric indicators—ℎ-index, impact factor (𝑁 IF ), eigen factor, and 𝑔-index. The ℎ-index equals the rank of an article (ordered from the most cited article to the least cited), ℎ, for which it has been cited at least that often (Hirsch, 2005). But these indicators are unhelpful when comparing an engineer versus a scientist or a poet and a cinematographer. Furthermore, because of the disproportionate weighting of the 𝑁 IF as a means to measure the quality of an article, the San Francisco Declaration on Research Assessment recommended that it not be used for hiring, promotions or funding decisions (Cagan, 2013). Many journals accept their recommendations and now report the (SNIP), SCImago Journal Rank (SJR) and a five-year impact factor (𝑁 IF,5 ) together with 𝑁 IF . The SNIP considers a three-year window and corrects for a fields average number of references in papers (Moed, 2010, Leydesdorff and Opthof, 2010).

Google Scholar groups journals into scientific categories and then ranks them according to an 5 -index: the number of articles in the previous five years with that number of citations (Braun et al., 2006). The most common ranking system is the Journal Impact Factor (𝑁 IF ) that represents the ratio of the number of citations in years 𝑥 − 1 and 𝑥 − 2 to the number of articles the journal publishes in year 𝑥.

The number of citations is a proxy to an article’s quality (Ebadi and Schiffauerova, 2016); however, since citations practices differ widely across scientific categories, many researchers question their validity as an evaluation metric (Bornmann and Daniel, 2008, Adler et al., 2009, MacRoberts and MacRoberts, 1996). Indeed, comparing productivity and prestige across scientific fields is dubious without criteria that represent substantial contribution. Still, national research evaluation agencies base their judgment criteria on the number of citations (Radicchi and Castellano, 2012, Abbott, 2009, Gilbert, 2009). Normalizing citations corrects for differences in citation rates between categories (Radicchi and Castellano, 2012, Colliander and Ahlgren, 2011, Waltman and van Eck, 2013, Kaur et al., 2013).

Fractional citation counting apportions credit based on the number of authors of

(4)

an article and is one method to account for differences in researchers citation counts between scientific categories (Garfield, 1979, Moed, 2010). Combining fractional counting with percentile ranks (Leydesdorff and Opthof, 2010) may be a superior indicator of a researchers. Relative impact indicators for mean citations compare journal papers between fields (Schubert and Braun, 1986, Vinkler, 2003, 2013).

Here we compare the citation practices of the scientific categories in Web of Science TM Core Collection (2015) TM (WoS). First we describe the database, then demonstrate how the number of citations, 𝑁 cit , varies as a function of bibliometric factors—number of articles per category, number of authors per article (for the 500 most cited), age of the references in these articles, number of institutions financing the research and factors related to journals that publish the research. We demonstrate that the number of articles and the age of the references explain more variance in the citation rates of the 500 most cited articles in each category than do the number of references and the number of authors. This premise compares elite articles from each of the categories and implies that the 500 most cited articles of each have the same quality, which exaggerates the differences between a category that has 300 000 articles and one that has 5000. It attributes scientific advances to research that is cited most. Rather than the top 500, future work will compare 500 articles from each category starting from the 10% or the 25%.

2. Methods

From 2010 to 2014, Web of Science Core Collection 𝑇 𝑀 (WoS) (Web of Science TM Core Collection, 2015) indexed 11.9 million documents into 251 scientific categories. Researchers in the pure sciences, engineering and medicine publish more work indexed by WoS compared with the humanities, social sciences and fine arts.

Within these broad scientific fields and subfields, publication and citation rates vary widely, which complicates comparing the researchers, category, journal or institutes, productivity and impact (Waltman and van Eck, 2013). Since the citation patterns vary with document type (Radicchi and Castellano, 2012), we only consider the 6.5 million publications that WoS classifies as articles and ignore all other types (reviews, papers in proceedings, meeting abstracts, etc.).

In the beginning of January, 2016, we downloaded the WoS 500 most cited articles from each of the 251 categories. Following Crespo et al. (2010), we consider that citations represent intrinsic scientific value and the culture of the scientific field.

Since the database has the top 500 articles in each category, we consider that

differences in citation rates within these categories are due entirely to bibliometric

factors and not quality or scientific impact.

(5)

We restricted the work to the Web of Science Core Collection. In the Basic Search category of the WoS, we entered “:” as the criteria and highlighted the field category Topic. We added a second field category Year Published and set the years to 2010–2014. In the following Search page, we restricted the study to Articles (under the Document Types tab). For each of the 251 Web of Science Categories, we sorted the articles from most cited to least cited, then saved the first 500 articles from the Save to Other File Format tab, included the Full Record and Cited References, and set the File Format to Tab-Delimited.

Each category file contains more than 40 columns of data including: article category, author’s full name, title, journal, abstract, date, scientific field, affiliations, funding agencies, etc. Some errors remain in the database particularly related to the formatting of the references. We checked all references that were older than 500 years and corrected erroneous entries.

The WoS citation index compiles data from 12 000 journals. It assigns many of these articles to more than one category such that the sum of the total number of articles is 11.3 million (although the overall total number of articles is only 6.5 million): 304 journals have articles that are duplicated in two categories, 68 are assigned to 3 categories, 16 to 4 categories and 4 journals to 5 categories.

Articles from Advanced Materials and Nano Letters appear in 6 categories. Nine of the top 10 articles in mathematical computational biology, computer science interdisciplinary applications, and probability and statistics are identical. Equally, biochemical research methods, biophysics and crystallography share all of the top 6 articles except for one. The article with the most cites (18103) is listed in three categories: biochemistry molecular biology, genetics heredity, and evolutionary biology.

WoS assigns 337 000 articles to multidisciplinary materials and only 800 to poetry and African, Australian, and Canadian literature. Because of this large disparity in the number of articles per category, we combined similar categories to ensure that each had at least 4000 papers. For example, we added medical ethics to the ethics category and put folklore, and 6 literature categories to literary theory criticism. The mean number of papers in each category of the truncated dataset (236 categories) was 𝑁 ̄ art = 43000 papers.

The following list describes the bibliometric field indicators. We correlated the

number of times papers are cited with bibliometric indicators. For each indicator,

we developed a power law expression and calculated the 𝑅 2 . We then developed

power law correlations with multiple factors and retained the expression that gave

the highest 𝑅 2 .

(6)

𝑅 cat We rank the categories from 1 to 236 based on the number of articles that WoS assigns to each. Multidisciplinary materials science, multidisciplinary chemistry, applied physics and chemical physics have the most articles (> 240000 ) while demography, industrial labor relations and logic have the least (< 4500 ).

𝑁 ̄ cit The first several dozen articles in as many as 20 categories have uncharacteristically high citations. The paper with 18103 citations inflates the mean category average of biochemistry molecular biology, genetics heredity, and evolutionary biology by 36. To reduce the variability introduced by these highly cited articles, we set 𝑁 ̄ cit equal (Redner, 1998) to the average number of citations to papers ranked from 31 to 500.

cat The category ℎ-index considers a five-year period (2010 to 2014) and equals the number of articles in a category, ℎ, that have been cited at least times: Multidisciplinary materials science, multidisciplinary chemistry, multidisciplinary sciences and general internal medicine all have at least 300 articles that have been cited more than 300 times (ℎ cat > 300); literary reviews, romance literature and classics have less than 10 papers that have been cited 10 times (ℎ cat < 10).

𝑁 ̄ IF The mean weighted average of the 𝑁 IF (2014) of the 10 journals that publish the most cited papers in each category:

𝑁 ̄ IF =

𝑛 𝑖 𝑁 IF,𝑖

𝑛 𝑖 (1)

where 𝑛 𝑖 is the number of articles the 𝑖 th journal publishes ( 𝑖 = 1, 10 ).

𝑁 art Total number of articles that WoS assigns to each category.

𝑁 ̄ fund Mean number of agencies that funded the research as reported in WoS funding agencies listed in the WoS.

𝑁 ref The total number of references in the bibliography of all 500 articles in a category.

𝛽 The Weibull distribution characterizes the relationship between the cumulative number of references, 𝑛(𝑡) , and their age, 𝑡, the difference between the year the journal published the article and when the reference was published (Patience et al., 2015):

𝑛(𝑡) = 𝑁 ref (

1 − exp (

𝑡 𝛽

))

(2) where 𝛽 is the scale parameter: 63% of the references are younger than 𝛽.

As many as 85 categories cite at least one article older than 300 y and

8 categories cite more than 100 articles older than that (the number of

reference articles older than 300 y are in parentheses): classics (687),

romance literature (414), literary theory criticism (397), history (344),

theatre (283), multidisciplinary humanities (141), philosophy of science

(7)

history (102) and art (101). We excluded all references older than 100 y in calculating 𝛽 and only consider references written after 1916.

𝑁 ̄ au Astronomy astrophysics averages 116 co-authors per article, while particles fields physics averages 169 and nuclear physics average 290. The number of co-authors per article exceeds 15 in 15 categories. To avoid these anomalously high values, in our model, we fit the number of authors per article (in each category) to a Weibull function then assign the number of authors per paper, 𝑁 au equal to 𝛽 𝑎𝑢 .

𝜂 The fraction of 500 articles that the top 4 journals publish. In agricultural engineering, Bioresource Technology published 422 of the top 500 articles;

Neuroimage published 80% of the top 500 of the neuroimaging category;

and, Science and Nature published 454 of the 500 most cited in multidisciplinary sciences. Although 10% of the journals indexed by WoS have at least one paper among the 500 most cited, only 10 journals account for 60% of the 118000 articles of this study. (Supplementary file:Top 10 journals per category.xlsx)

3. Results

The ℎ-index links productivity of individuals with the citation history of their published articles. It prejudices young researchers and individuals who publish in categories with low citation rates. Modifications to improve the ℎ-index include fractional counting (Leydesdorff and Opthof, 2010), normalizing citations, correcting for the dimensionality of the ℎ-index with a conversion factor (Dienes, 2015). An ℎ cat minimizes the pitfalls associated with the individual ℎ-index; it is an aggregate value that applies to all researchers for the same 5-year period. It is a measure of productivity and correlates with the number of researchers in a field, which reflects the priority that society attributes to specific scientific categories.

For instance, the cat (2010–2014) of multidisciplinary sciences is 367: 367 articles between 2010 and 2014 were cited at least 367 times as of January 2016. It was only 3 for Slavic Literature.

The average of the number of citations to the top 500 papers per categories, 𝑁 ̄ cit , correlates with cat (Figure 1):

cat = 4.5 𝑁 ̄ cit 0.71 , 𝑅 2 = 0.997 (3)

Iglesias and Pecharromán (2007) derived a theoretical relationship that they apply to individuals that takes into account both the category productivity and an individual’s productivity based on

=

3

𝑁 art

4 𝑁 ̄ cit 2∕3 (4)

(8)

Figure 1. The

cat

correlates with the average number of citations of the most highly ranked articles.

A power law model fits the average citation rates of articles ranked from 31–100 better than those ranked from 1–30. The correlation coefficient is 𝑅

2

= 0.997 for the articles ranked from 31–500.

Eq. (3) specifically applies to the article rank from 31 to 500. For the articles ranked from 31 to 100, the data are displaced to the right slightly (the coefficient increases) but the slope of the line is the same and slightly higher than the Eq. (4). In fact, considering any series of articles with the same rank—100 to 200, 200 to 300, 300 to 500—only the coefficient changes but the exponent is essentially constant and 𝑅 2 > 0.99 . However, for the most highly cited papers, ranked 1 to 30, for example, many categories deviate substantially from the regression line (circles to the right).

Such articles in these categories represent the substantial fluctuations (Redner, 1998) characteristic of the extremes of the bibliometric citation data. Coincidentally, they share the most highly cited papers.

Whereas the cat increases to the power 0.71 with respect to 𝑁 ̄ cit , how does the category average impact factor, 𝑁 ̄ IF , vary with 𝑁 ̄ cit ? The impact factor for a given year, 𝑖 is:

𝑁 IF,𝑖 = 𝑁 cit,𝑖−1 + 𝑁 cit,𝑖−2

𝑁 art,𝑖−1 + 𝑁 art,𝑖−2 (5)

Recall that the category impact factor is the weighted average 𝑁 IF of the top 10 journals that publish the 500 most cited articles. Finardi (2013) reported that 𝑁 IF are poorly correlated with 𝑁 cit but differences among scientific areas exist. By restricting our analysis to the most highly cited papers, we evaluate the differences between areas and find that 𝑁 ̄ IF increases linearly with citations, but more precisely 𝑁 ̄ cit (Figure 2):

𝑁 ̄ IF = 0.075 𝑁 ̄ cit , 𝑅 2 = 0.81 (6)

𝑁 ̄ IF is greater than 25 for general internal medicine (50), multidisciplinary sciences

(36), and cell biology (26) (Appendix). It is below 0.5 for literary theory criticism,

romance literature, classics, theater, and Asian studies. The categories that deviate

(9)

Figure 2. The weighted 𝑁 ̄

IF

of the journals that publish the top 500 articles for each category is proportional to the average of the number of citations per category.

substantially from the regression line include electrical engineering, applied mathematics, astronomy/astrophysics and nuclear science technology.

4. Discussion

Both the cat and 𝑁 ̄ IF correlate with citation rates and are useful metrics to compare categories quantitatively. But what factors contribute to the citation frequency of an article? Tahamtan et al. (2016) categorize the factors that contribute to how often an article is cited: (1) paper related—research quality, novelty, how well the authors present their results, accessibility, the number of references, 𝑁 ref and age, 𝛽. (Vieira and Gomes, 2010); (2) journal related—𝑁 IF , language; and, (3) author related—𝑁 au , authors reputation, collaborations, race, gender, age etc. Yu and Yu (2014) included research field as an addition factor that contributes to citation frequency, which would include 𝑁 art and 𝑁 fund . Here we examine all four factors but assume that since we populate the database solely with the most cited articles, the research quality is equivalent across all categories. The article related aspects we consider are 𝑁 ref , 𝛽 and the number of articles WoS assigns to a category, 𝑁 art . The only journal related factor we consider is 𝑁 IF , as expressed by the parameter 𝜂. We compared the percentage of women graduating from 141 scientific disciplines with the average number of citations in those disciplines and found no positive correlation, which agrees with other work (National Science Foundation, 2014, Rørstad and Aksnes, 2015).

Other author related factors we examined include 𝑁 au and 𝑁 fund .

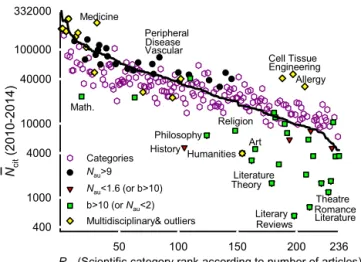
The number of articles in a category, 𝑁 art , is the single most important factor

that correlates with 𝑁 ̄ cit (SCImago Journal Rank, Zitt and Small, 2010). It decays

exponentially with respect to the rank (Figure 3). Articles in categories that

cite proportionately more often than the number of articles that WoS assigns to

(10)

Figure 3. The total citation count to the top papers in a category (30 < 𝑅 ≤ 500), 𝑁 ̄

cit

, versus the rank of the number of papers assigned to this category (black line). The number of citations to the most cited papers for each category follows a similar trend (magenta hexagons). Several categories related to biology/medicine cite more frequently than the number of papers in these categories whereas the social sciences, the arts and some categories related to mathematics cite less frequently.

the category lie above the black line in Figure 3 (biological sciences—general internal medicine, peripheral vascular disease, cell tissue engineering, allergy and evolutionary biology). Cell tissue engineering, andrology and mathematical psychology are cited 3 times more than there are papers (𝑁 cit > 3 𝑁 art ). Mathematics, nursing, religion, history, humanities and literature are among the categories that cite proportionately less often than the number of papers that they publish and fall below the line: History and literature reviews have 10 times more papers than citations (𝑁 cit < 10 𝑁 art ). Assuming that the number of citations is directly proportional to the number of papers explains 64% of the variance: 𝑁 cit = 0.73 𝑁 art (𝑅 2 = 0.64 ).

The deviation between the highest number of citations and the lowest for a given 𝑁 art is about 3. Biological sciences and medicine related categories lie near the upper bound while humanities lie below the lower bound.

Equally important as 𝑁 art to explain the variance in the category 𝑁 ̄ cit data is the average age of the references in the articles’ bibliography, 𝛽 . The Weibull distribution accounts for more than 99.5% of the variance in the age distribution. It varies from 4 y (nanoscience nanotechnology and multidisciplinary materials science) to more than 20 y (classics, history of social sciences and romance literature), and averages 9 y over all categories. Categories with a lower 𝛽 will necessarily have journals with a higher 𝑁 IF since researchers cite recent articles. As many as 44% of the papers that researchers publish in multidisciplinary materials science are two years old or less while it is only 5% in classics. An inverse cubed relation accounts for 66% of the variance in the data:

𝑁 ̄ cit = 35000∕𝛽 3 , 𝑅 2 = 0.66 (7)

(11)

Figure 4. The average number of citations to the top ranked articles in a category 30 < 𝑅 ≤ 500, 𝑁 ̄

cit

, increases proportionately with the square of the number of authors and are bounded by two extremes 𝑁 ̄

cit

= 𝑁 ̄

au2

and 𝑁 ̄

cit

= 10 𝑁 ̄

au2

. Ten categories average more than 15 authors per category, which corresponds to hyperauthorship (red filled triangles) (Boffito et al., 2016).

Besides the number of papers in a category and 𝛽, the number of citations increases with the number of authors, 𝑁 au (Figure 4) (Abramo and D’Angelo, 2015, Glänzel and Thijs, 2004). Authorship attributes credit to those that contribute to research.

Through authorship, people accrue a reputation (Cronin, 2001). Researchers in biosciences cite more often than architects and these varying citation practices render comparisons across scientific fields problematic (Crespo et al., 2010). Articles in multidisciplinary physics, astronomy/astrophysics, particles fields physics and nuclear physics can have several hundred and even more than three thousand authors—hyperauthorship (Birnholtz, 2006, Li et al., 2013)—whereas literature, poetry, and history tend to have a single author. Ten categories exceed 15 authors per paper, which is indicative of hyperauthorship (Boffito et al., 2016). Excluding hyperauthorship, papers average less than 5 authors per paper. Citations increase with the square of the number of authors per paper, with a 10-fold spread:

𝑁 ̄ au 2 < ̄ 𝑁 cit < 10𝑁 𝑎𝑢 2 (8)

5. Model

Principal component analysis shows that no linear combination of all possible parameters accounts for the majority of the variance. However, a power law model including the prime factors accounts for 86% of the variance: 𝑁 ̄ cit = 𝛼 0 𝑁 art 𝛼

1

𝑁 ̄ au 𝛼

2

∕𝛽 𝛼

3

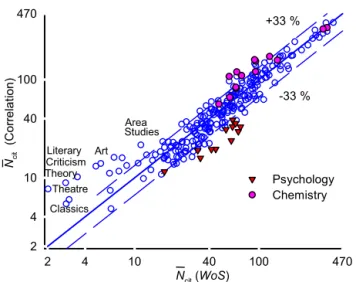
. Excluding 12 categories related to psychology, business and management (Iglesias and Pecharromán, 2007), the following expression accounts for 95% of the variance:

𝑁 ̄ cit =

( 1.5 + 0.33𝜂 (

1 + 𝑁 fund ) 5∕4 ) 𝑁 art 0.5

𝛽 (9)

(12)

Figure 5. The equation 𝑁 ̄

cit

=

( 1.6 + 0.37𝜂 ( 1 + 𝑁

fund

)

1.3

)

𝑁

art0.5

∕𝛽 accounts for 95% of the variance in the average number of citations per category.

The number of papers in a category and the age of the references in these papers account for most of the variance in 𝑁 ̄ cit . The first term variable in the parenthesis, 𝜂, represents the fraction of articles of the 500 most cited articles that the top 4 journals publish (Tables 1–8). This factor exceeds 0.97 for agricultural engineering, multidisciplinary sciences, neuroimaging and material sciences coatings, and is lower than 0.26 for literary criticism, classics, and management.

The second term variable, 𝑁 fund , accounts for the number of funding agencies that finance the research, which correlates with the number of authors—the correlation coefficient was lower with 𝑁 ̄ au versus 𝑁 fund . Considering that the SNIP (Source Normalized Impact per Paper) journal metric accounts for the average length of reference lists, it is surprising that this factor is insignificant for this data set (Leydesdorff and Opthof, 2010). Presumably, funding agencies weigh their selection criteria heavily on the established publishing record of researchers, which reinforces the Matthew effect (Ebadi and Schiffauerova, 2016).

Most categories lie within 33% of the regression line but the regression model

consistently underestimates the citations to the psychology categories and it

overestimates many of the fine arts categories and some of the chemistry categories

(Figure 5).

(13)

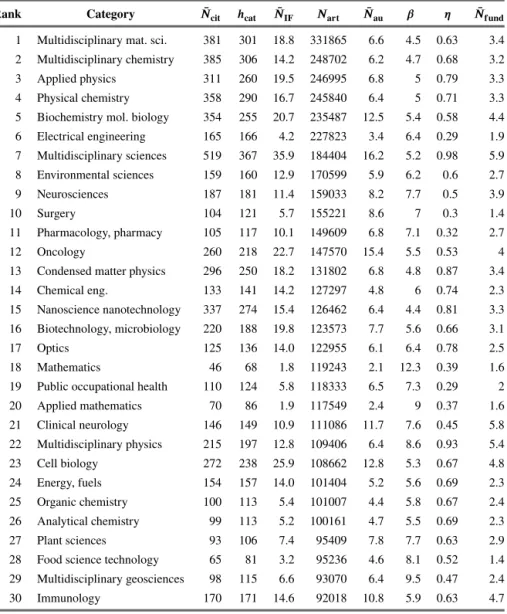
Table 1. Bibliometric indicators (2010–2014): Category rank from 1 to 30.

Rank Category 𝑵 ̄

𝐜𝐢𝐭

𝒉

𝐜𝐚𝐭

𝑵 ̄

𝐈𝐅

𝑵

𝐚𝐫𝐭

𝑵 ̄

𝐚𝐮

𝜷 𝜼 𝑵 ̄

𝐟𝐮𝐧𝐝

1 Multidisciplinary mat. sci. 381 301 18.8 331865 6.6 4.5 0.63 3.4 2 Multidisciplinary chemistry 385 306 14.2 248702 6.2 4.7 0.68 3.2

3 Applied physics 311 260 19.5 246995 6.8 5 0.79 3.3

4 Physical chemistry 358 290 16.7 245840 6.4 5 0.71 3.3

5 Biochemistry mol. biology 354 255 20.7 235487 12.5 5.4 0.58 4.4 6 Electrical engineering 165 166 4.2 227823 3.4 6.4 0.29 1.9 7 Multidisciplinary sciences 519 367 35.9 184404 16.2 5.2 0.98 5.9 8 Environmental sciences 159 160 12.9 170599 5.9 6.2 0.6 2.7

9 Neurosciences 187 181 11.4 159033 8.2 7.7 0.5 3.9

10 Surgery 104 121 5.7 155221 8.6 7 0.3 1.4

11 Pharmacology, pharmacy 105 117 10.1 149609 6.8 7.1 0.32 2.7

12 Oncology 260 218 22.7 147570 15.4 5.5 0.53 4

13 Condensed matter physics 296 250 18.2 131802 6.8 4.8 0.87 3.4

14 Chemical eng. 133 141 14.2 127297 4.8 6 0.74 2.3

15 Nanoscience nanotechnology 337 274 15.4 126462 6.4 4.4 0.81 3.3 16 Biotechnology, microbiology 220 188 19.8 123573 7.7 5.6 0.66 3.1

17 Optics 125 136 14.0 122955 6.1 6.4 0.78 2.5

18 Mathematics 46 68 1.8 119243 2.1 12.3 0.39 1.6

19 Public occupational health 110 124 5.8 118333 6.5 7.3 0.29 2

20 Applied mathematics 70 86 1.9 117549 2.4 9 0.37 1.6

21 Clinical neurology 146 149 10.9 111086 11.7 7.6 0.45 5.8 22 Multidisciplinary physics 215 197 12.8 109406 6.4 8.6 0.93 5.4

23 Cell biology 272 238 25.9 108662 12.8 5.3 0.67 4.8

24 Energy, fuels 154 157 14.0 101404 5.2 5.6 0.69 2.3

25 Organic chemistry 100 113 5.4 101007 4.4 5.8 0.67 2.4

26 Analytical chemistry 99 113 5.2 100161 4.7 5.5 0.69 2.3

27 Plant sciences 93 106 7.4 95409 7.8 7.7 0.63 2.9

28 Food science technology 65 81 3.2 95236 4.6 8.1 0.52 1.4 29 Multidisciplinary geosciences 98 115 6.6 93070 6.4 9.5 0.47 2.4

30 Immunology 170 171 14.6 92018 10.8 5.9 0.63 4.7

(14)

Table 2. Bibliometric indicators (2010–2014): Category rank from 31 to 60.

Rank Category 𝑵 ̄

𝐜𝐢𝐭

𝒉

𝐜𝐚𝐭

𝑵 ̄

𝐈𝐅

𝑵

𝐚𝐫𝐭

𝑵 ̄

𝐚𝐮

𝜷 𝜼 𝑵 ̄

𝐟𝐮𝐧𝐝

31 General internal medicine 460 316 49.7 91063 19.0 5.8 0.97 8.8 32 Astronomy, astrophysics 197 177 5.7 90901 20.8 7.1 0.61 8.1

33 Heredity genetics 229 200 21.3 90283 17.7 5.1 0.55 7

34 Microbiology 125 133 7.9 89376 9.3 6.1 0.47 3.6

35 Radiology, nuclear medicine 115 128 5.9 87358 7.6 6.8 0.57 2.3

36 Economics 79 97 4.2 85808 2.3 9.1 0.29 0.3

37 Polymer science 98 109 5.0 85683 4.7 6.3 0.68 2.1

38 Mechanics 67 86 3.2 82732 2.9 9.3 0.34 1.4

39 Cardiac cardiovascular systems 208 182 14.3 82181 14.5 7.5 0.81 3.8 40 Experimental medicine 162 167 18.1 80830 13.4 6.4 0.84 4.5

41 Ecology 124 130 7.9 79713 5.7 8.6 0.28 2.6

42 Physics–atomic mol. chem. 127 138 5.1 79699 3.9 7.3 0.77 2.5

43 Psychiatry 117 129 11.1 77000 7.8 7.5 0.52 5

44 Metallurgy, metallurgical eng. 65 82 3.6 76348 4.3 9.4 0.8 1.7

45 Mechanical engineering 58 76 3.1 75736 3.3 9.4 0.43 1.5

46 Biochemical research methods 207 162 14.0 73352 6.0 5.8 0.6 3.1 47 Endocrinology, metabolism 127 134 9.7 71958 9.4 6.9 0.54 3.6

48 Veterinary sciences 40 56 2.2 70466 5.7 8.8 0.37 1.3

49 Pediatrics 74 91 5.0 69246 7.1 7.8 0.62 2.3

50 Civil engineering 67 85 3.9 68200 4.0 7.3 0.79 1.7

51 Applied chemistry 69 85 3.9 64375 4.7 7.4 0.59 1.7

52 Inorganic, nuclear chemistry 78 95 4.7 64157 5.0 7.4 0.89 2.4 53 Instruments, instrumentation 74 90 4.8 63594 4.3 6.2 0.75 2.3

54 Medicinal chemistry 73 89 4.3 62651 6.5 7.6 0.65 1.8

55 Electrochemistry 101 117 5.1 62286 5.0 5.6 0.73 2

56 Interdisciplinary computer sci. 134 126 4.1 60469 3.8 7.7 0.61 1.8

57 Infectious diseases 110 121 9.1 59151 10.3 6.1 0.59 4.1

58 Telecommunications 83 105 3.3 58937 3.7 5.3 0.47 1.4

59 Water resources 69 88 4.2 57784 4.7 8.2 0.7 1.9

60 Biophysics 107 113 8.3 57391 6.3 6.8 0.4 3.1

(15)

Table 3. Bibliometric indicators (2010–2014): Category rank from 61 to 90.

Rank Category 𝑵 ̄

𝐜𝐢𝐭

𝒉

𝐜𝐚𝐭

𝑵 ̄

𝐈𝐅

𝑵

𝐚𝐫𝐭

𝑵 ̄

𝐚𝐮

𝜷 𝜼 𝑵 ̄

𝐟𝐮𝐧𝐝

61 Particles fields physics 126 134 5.4 57041 4.5 10.8 0.8 8.1 62 Meteorology, atmospheric sci. 104 119 6.5 55871 9.5 7 0.52 2.9

63 Zoology 45 62 3.1 55437 4.4 15.6 0.38 2.6

64 Computer sci. info. systems 84 101 3.7 53146 3.2 7.5 0.45 1.5

65 Computer sci. AI 111 125 4.7 53076 3.1 7.6 0.41 2.1

66 Gastroenterology, hepatology 133 142 13.2 52101 10.5 6.5 0.73 3.6 67 Environmental engineering 105 119 5.3 51862 4.8 6.2 0.79 2

68 Obstetrics, gynecology 65 84 4.5 51756 6.7 7.3 0.54 1.9

69 Biomedical engineering 98 111 7.4 50719 6.6 6.3 0.84 2.6

70 Multidisc. engineering 53 74 2.6 50580 3.3 8.8 0.54 1.6

71 Orthopedics 64 83 3.8 50246 5.7 8.1 0.51 1.4

72 Mathematical physics 61 78 2.4 49314 2.8 9.2 0.7 2.2

73 Marine, freshwater biology 55 73 2.8 49131 5.2 10.1 0.31 2.3

74 Biology 85 100 6.6 49057 6.7 7.7 0.63 3.1

75 Thermodynamics 64 84 3.6 48245 3.4 7.9 0.61 1.1

76 Toxicology 76 94 5.5 47447 6.6 7.9 0.43 2

77 Physiology 66 79 4.3 47206 6.4 8.3 0.36 2.5

78 Hematology 127 136 9.4 46673 12.9 6.4 0.78 3.9

79 Urology, nephrology 93 109 8.4 46350 9.2 6.1 0.69 2.3

80 Educational research 44 66 2.7 46203 2.7 9.6 0.37 0.1

81 Nutrition, dietetics 83 101 4.9 45511 6.7 7.2 0.56 2.3

82 Nuclear sci. technology 38 57 1.4 45307 6.8 9.9 0.62 1.9

83 Geochemistry, geophysics 73 90 4.1 45091 4.7 11 0.45 2

84 Peripheral vascular disease 157 152 11.4 44332 12.1 7.9 0.83 3.9 85 Statistics, probability 109 111 4.2 44155 3.2 8.3 0.78 1.9

86 Fluids, plasmas physics 55 72 2.5 43118 3.6 8.7 0.7 1.7

87 Management 75 94 4.9 42111 2.5 11.9 0.25 0.2

88 Interdisciplinary math appl. 55 73 2.6 42083 2.8 9 0.46 1.6

89 Crystallography 78 84 4.2 41570 5.7 6.4 0.94 2.5

90 Spectroscopy 53 72 2.5 41260 5.3 8.4 0.39 2.5

(16)

Table 4. Bibliometric indicators (2010–2014): Category rank from 91 to 120.

Rank Category 𝑵 ̄

𝐜𝐢𝐭

𝒉

𝐜𝐚𝐭

𝑵 ̄

𝐈𝐅

𝑵

𝐚𝐫𝐭

𝑵 ̄

𝐚𝐮

𝜷 𝜼 𝑵 ̄

𝐟𝐮𝐧𝐝

91 Dentistry, oral surgery 46 64 3.7 41075 5.6 8.4 0.45 1

92 Agronomy 47 66 3.2 40309 5.5 9.1 0.53 1.9

93 Ophthalmology 68 85 4.6 39500 6.5 8.8 0.66 2.8

94 Operations res. management 55 72 2.6 38668 2.6 9.9 0.47 1.2 95 Multidisciplinary agriculture 45 62 2.8 38386 5.3 7.8 0.83 1.6

96 Sport science 61 78 3.8 38073 5.5 8.4 0.57 1.3

97 Automation control systems 91 108 4.5 37607 3.1 6.7 0.67 2.1 98 Computer sci. software eng. 47 66 2.1 37596 3.4 7.5 0.28 1.4 99 Health care science services 71 89 3.9 37155 6.0 7.2 0.44 1.3

100 Respiratory system 98 115 9.1 36915 10.5 7.2 0.7 4.1

101 Pathology 75 95 6.3 36251 9.4 6.6 0.54 2.7

102 Multidisciplinary psychology 81 99 7.8 35326 2.8 10.8 0.5 0.4

103 Computer science theory 59 81 3.0 33601 3.2 7.6 0.33 2

104 Rehabilitation 44 63 2.8 33403 5.1 8.7 0.34 1.1

105 History 10 21 1.1 33312 1.4 19.6 0.28 0

106 Dairy, animal science 37 58 2.3 32548 5.5 9.6 0.7 1.8

107 Nursing 28 43 1.9 32082 3.9 8.1 0.26 0.9

108 Clinical psychology 68 86 4.8 31743 5.1 9.3 0.33 1.6

109 Virology 91 109 7.0 31649 10.1 6.2 0.85 3.4

110 Nuclear Physics 82 100 4.7 31571 4.7 12.2 0.85 10.9

111 Experimental psychology 67 85 3.5 31321 3.3 10.1 0.34 0.9

112 Coatings, films 52 69 2.8 30783 4.8 7.4 0.98 1.7

113 Dermatology 48 65 5.3 30474 7.2 8.3 0.62 2.1

114 Political science 39 57 3.1 29881 1.7 10.1 0.3 0

115 Psychology 73 92 8.1 29628 4.1 10.3 0.4 1.7

116 Environmental studies 70 90 6.2 29625 3.3 7.2 0.63 1.5

117 Computational biology 122 121 4.5 29329 4.2 6.5 0.81 2.3

118 Entomology 34 49 2.4 29266 4.6 10.9 0.3 1.9

119 Oceanography 50 68 2.8 29259 4.8 10 0.4 2.4

120 Business 67 87 5.1 27946 2.5 11.9 0.29 0

(17)

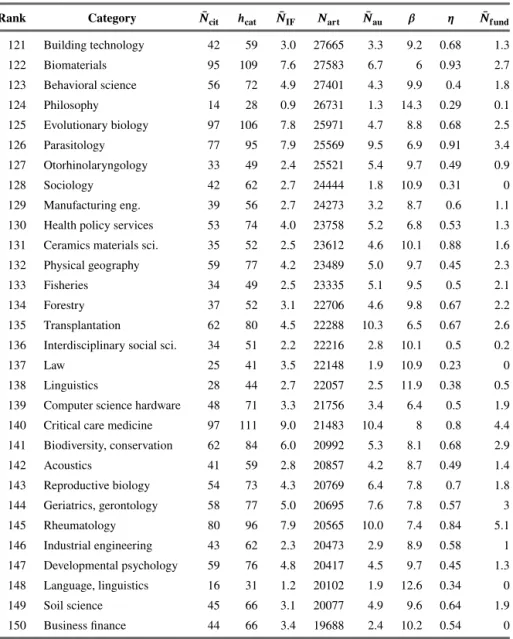
Table 5. Bibliometric indicators (2010–2014): Category rank from 121 to 150.

Rank Category 𝑵 ̄

𝐜𝐢𝐭

𝒉

𝐜𝐚𝐭

𝑵 ̄

𝐈𝐅

𝑵

𝐚𝐫𝐭

𝑵 ̄

𝐚𝐮

𝜷 𝜼 𝑵 ̄

𝐟𝐮𝐧𝐝

121 Building technology 42 59 3.0 27665 3.3 9.2 0.68 1.3

122 Biomaterials 95 109 7.6 27583 6.7 6 0.93 2.7

123 Behavioral science 56 72 4.9 27401 4.3 9.9 0.4 1.8

124 Philosophy 14 28 0.9 26731 1.3 14.3 0.29 0.1

125 Evolutionary biology 97 106 7.8 25971 4.7 8.8 0.68 2.5

126 Parasitology 77 95 7.9 25569 9.5 6.9 0.91 3.4

127 Otorhinolaryngology 33 49 2.4 25521 5.4 9.7 0.49 0.9

128 Sociology 42 62 2.7 24444 1.8 10.9 0.31 0

129 Manufacturing eng. 39 56 2.7 24273 3.2 8.7 0.6 1.1

130 Health policy services 53 74 4.0 23758 5.2 6.8 0.53 1.3

131 Ceramics materials sci. 35 52 2.5 23612 4.6 10.1 0.88 1.6

132 Physical geography 59 77 4.2 23489 5.0 9.7 0.45 2.3

133 Fisheries 34 49 2.5 23335 5.1 9.5 0.5 2.1

134 Forestry 37 52 3.1 22706 4.6 9.8 0.67 2.2

135 Transplantation 62 80 4.5 22288 10.3 6.5 0.67 2.6

136 Interdisciplinary social sci. 34 51 2.2 22216 2.8 10.1 0.5 0.2

137 Law 25 41 3.5 22148 1.9 10.9 0.23 0

138 Linguistics 28 44 2.7 22057 2.5 11.9 0.38 0.5

139 Computer science hardware 48 71 3.3 21756 3.4 6.4 0.5 1.9

140 Critical care medicine 97 111 9.0 21483 10.4 8 0.8 4.4

141 Biodiversity, conservation 62 84 6.0 20992 5.3 8.1 0.68 2.9

142 Acoustics 41 59 2.8 20857 4.2 8.7 0.49 1.4

143 Reproductive biology 54 73 4.3 20769 6.4 7.8 0.7 1.8

144 Geriatrics, gerontology 58 77 5.0 20695 7.6 7.8 0.57 3

145 Rheumatology 80 96 7.9 20565 10.0 7.4 0.84 5.1

146 Industrial engineering 43 62 2.3 20473 2.9 8.9 0.58 1

147 Developmental psychology 59 76 4.8 20417 4.5 9.7 0.45 1.3

148 Language, linguistics 16 31 1.2 20102 1.9 12.6 0.34 0

149 Soil science 45 66 3.1 20077 4.9 9.6 0.64 1.9

150 Business finance 44 66 3.4 19688 2.4 10.2 0.54 0

(18)

Table 6. Bibliometric indicators (2010–2014): Category rank from 151 to 180.

Rank Category 𝑵 ̄

𝐜𝐢𝐭

𝒉

𝐜𝐚𝐭

𝑵 ̄

𝐈𝐅

𝑵

𝐚𝐫𝐭

𝑵 ̄

𝐚𝐮

𝜷 𝜼 𝑵 ̄

𝐟𝐮𝐧𝐝

151 Developmental biology 85 102 8.9 17669 7.6 6.7 0.86 3.5

152 Social psychology 50 68 3.8 17553 3.1 12 0.47 0

153 Information, library sci. 41 62 2.9 17488 2.8 9.1 0.51 0.7 154 Multidisciplinary humanities 8 21 1.7 17455 1.7 12.9 0.51 0

155 Geography 45 67 3.7 17381 2.3 7.9 0.46 0.6

156 Agricultural engineering 68 85 4.3 17177 4.6 7.3 0.99 1.8 157 Education scientific disc. 34 53 2.5 17068 3.6 8.3 0.61 0.7

158 Anthropology 33 50 2.9 16922 3.2 11.8 0.5 1.5

159 Anesthesiology 55 72 4.8 16889 6.5 7.5 0.75 2.1

160 Horticulture 30 45 2.6 16857 6.3 9.3 0.73 1.9

161 Remote sensing 56 77 4.6 16306 4.3 8.4 0.8 1.7

162 Literature 6 20 1.0 16235 1.4 14.1 0.48 0

163 Transportation sci. 38 54 2.6 16111 3.0 7.7 0.64 1.5

164 Applied psychology 46 68 4.0 16034 2.9 11.5 0.4 0.1

165 Religion 9 22 1.0 15876 1.9 12.4 0.47 0

166 International relations 27 47 2.6 15566 1.7 8.6 0.42 0

167 Composites materials sci. 40 56 3.2 15411 3.7 8.1 0.86 1.3

168 Emergency medicine 33 53 3.3 15289 6.8 8.2 0.81 1.1

169 Tropical medicine 40 58 3.5 15286 8.9 8.3 0.91 2.4

170 Substance abuse 43 64 3.7 15071 4.8 8.5 0.56 1.9

171 Photographic technology 59 81 4.6 15007 4.3 8.4 0.85 1.8

172 Integrative medicine 28 41 2.9 14095 6.2 8.9 0.84 1.5

173 Medical laboratory technol. 41 63 4.9 13860 7.2 7.1 0.76 2

174 Ethics 21 37 2.0 13768 2.2 10.2 0.64 0.4

175 Transportation 31 47 2.5 13688 2.8 9.1 0.61 0.7

176 Communication 28 47 2.1 13327 2.1 9.8 0.36 0

177 Biomedical social science 34 52 3.0 13187 4.9 8.2 0.71 0.7 178 Aaerospace engineering 19 34 1.2 13077 3.0 11.3 0.71 1.1 179 Literary theory criticism 3 10 0.0 12970 1.1 18.5 0.25 0

180 Planning development 36 57 2.7 12802 2.0 9.3 0.49 0

(19)

Table 7. Bibliometric indicators (2010–2014): Category rank from 181 to 210.

Rank Category 𝑵 ̄

𝐜𝐢𝐭

𝒉

𝐜𝐚𝐭

𝑵 ̄

𝐈𝐅

𝑵

𝐚𝐫𝐭

𝑵 ̄

𝐚𝐮

𝜷 𝜼 𝑵 ̄

𝐟𝐮𝐧𝐝

181 Paleontology 28 44 2.5 12463 4.7 13.9 0.61 2.5

182 Geological engineering 24 38 1.9 12317 3.2 12.6 0.4 1.6

183 Mining, mineral processing 24 39 1.7 12260 4.8 11.9 0.89 1.4

184 Medical informatics 38 58 2.7 12051 4.7 7.3 0.6 1.6

185 Art 6 17 1.3 12001 2.6 14.5 0.66 0.5

186 Gerontology 41 60 4.2 11865 6.4 9 0.77 2.3

187 Characterization, testing 20 35 1.8 11782 3.8 9.8 0.7 1.3

188 Neuroimaging 82 98 6.0 11759 6.8 7.1 0.97 3

189 Geology 36 55 3.9 11542 4.9 11.8 0.71 2.2

190 Archaeology 20 34 2.0 11383 3.9 13.5 0.73 1.5

191 Mineralogy 36 53 3.4 11194 4.6 11.5 0.71 2.1

192 History philosophy of sci. 15 30 1.4 11047 1.8 14.3 0.42 0.6 193 Social sci. math. methods 32 53 2.7 10603 2.3 11.3 0.49 0.9

194 Area studies 12 24 1.0 10533 1.5 7.6 0.3 0

195 Family studies 27 46 1.8 10331 3.3 9.5 0.44 0

196 Audiology speech pathology 27 41 2.2 10179 3.8 11.6 0.68 1.4 197 Cell tissue engineering 93 111 14.9 10045 9.4 5.7 0.83 3.9

198 Literary reviews 1 9 0.5 9790 1.1 15.4 0.65 0

199 Textiles materials sci. 26 46 3.4 9736 4.9 7.6 0.95 2

200 Educational psychology 38 59 3.4 9692 3.2 11.2 0.57 0

201 Social work 20 33 1.8 9670 2.9 9.6 0.51 0

202 Limnology 38 56 3.2 9578 4.3 10.4 0.86 2.3

203 Criminology, penology 23 38 2.2 9572 2.7 11.1 0.34 0

204 Mycology 33 52 4.0 9402 5.6 10.9 0.5 2.1

205 Anatomy morphology 24 41 2.5 9343 5.1 11.1 0.54 2

206 Hospitality, leisure, sport 27 44 2.3 9328 2.4 10.4 0.61 0.1

207 Allergy 63 86 9.6 9201 9.5 7.1 0.91 6

208 Architecture 4 14 0.5 8993 2.0 15 0.48 0.3

209 Urban studies 25 42 2.2 8965 2.4 9 0.55 0.5

210 Petroleum engineering 12 27 1.1 8874 3.5 13.7 0.77 1.2

(20)

Table 8. Bibliometric indicators (2010–2014): Category rank from 211 to 236.

Rank Category 𝑵 ̄

𝐜𝐢𝐭

𝒉

𝐜𝐚𝐭

𝑵 ̄

𝐈𝐅

𝑵

𝐚𝐫𝐭

𝑵 ̄

𝐚𝐮

𝜷 𝜼 𝑵 ̄

𝐟𝐮𝐧𝐝

211 Romance literature 2 6 0.1 8795 1.1 19.9 0.33 0

212 Cultural studies 16 33 1.2 8481 1.6 10.1 0.54 0.1

213 Public administration 21 38 1.9 8453 1.8 9.6 0.35 0

214 Music 7 20 1.5 8387 2.0 13.5 0.58 0.2

215 Paper, wood material sci. 22 40 2.5 8359 4.1 10.2 0.85 1.6

216 Legal medicine 24 42 2.4 8334 5.1 8.7 0.78 0.9

217 Primary health care 23 38 2.8 8239 5.5 7.8 0.48 1.4

218 Social issues 19 35 2.3 7834 2.1 9.2 0.44 0.3

219 Robotics 27 46 2.2 7672 3.4 8.1 0.62 1.5

220 Ocean engineering 18 32 1.7 7660 3.4 11.1 0.77 1.8

221 Classics 3 9 0.0 7618 1.1 22.8 0.24 0

222 Biological psychology 36 56 4.0 7480 3.7 10.6 0.6 1.5

223 Women’s studies 19 32 1.8 7312 3.0 9.6 0.6 0.4

224 Special education 24 42 2.0 6813 4.2 9.9 0.63 0

225 Ergonomics 22 38 1.8 6340 3.1 10 0.69 0.4

226 Cybernetics computer sci. 31 56 4.0 6295 3.3 8.3 0.7 2.1

227 Theater 2 10 0.3 6009 1.2 15.2 0.35 0

228 Ornithology 18 34 2.4 5757 4.9 7 0.59 1.5

229 Asian studies 3 11 0.4 5561 1.2 18.5 0.35 0

230 Film, radio, television 9 28 0.7 5400 1.4 10.3 0.52 0

231 Mathematical psychology 21 42 2.7 5340 2.5 12.3 0.77 0.2

232 Microscopy 24 43 2.3 4904 5.1 9.8 0.71 1.8

233 History of social sci. 7 17 0.8 4867 1.7 21.4 0.42 0

234 Demography 19 36 1.8 4447 2.0 10.1 0.52 0

235 Industrial relations labor 13 28 1.5 4403 2.1 10.8 0.44 0

236 Logic 7 19 0.6 4381 1.8 15.1 0.38 1

6. Conclusions

Publishing a highly cited paper is gratifying and confirms that the work has an impact on the scientific community. However, the number of citations the top articles accrue depends on factors other than quality and originality. We tabulate bibliometric indicators for the top 500 cited articles of 236 scientific categories and include the average impact factors of the journals that publish the articles, the category ℎ-index and the total number of articles in each category. With this data, researchers, institutions and funding agencies can gauge their productivity and impact quantitatively.

Citation rates, 𝑁 ̄ cit vary across research categories by several orders of magnitude as do the number of articles per category and the number of authors per article.

Categories with more articles and more funding are cited more. Other factors that

correlate with citations include the age of the references, journal impact factor and

(21)

funding agencies. We assume that 𝑁 ̄ cit is related to bibliometric indicators and that 500 articles from categories with 100 000 articles (0.5%) are comparable to those with 5000 (10%). This comparison may exaggerate the differences between fields, but science endeavours that have orders of magnitude more researchers will have that much more impact.

Most categories are within 33% of the 𝑁 ̄ cit regression equation. Other factors that may account for the difference may be related to the scope of the category.

For instance, many researchers outside of the psychology field may be citing psychology papers, which would increase the number of citations beyond what we expect based on the bibliometric indicators. The correlation overestimates the number of citations for nursing and many engineering categories: here, the citation patterns might be narrower as only the people in these fields cite one another.

A further limitation to the analysis relates to the limitations of WoS: coverage of the humanities, social sciences, business, and even mathematics are poorer than they are for natural sciences and health sciences. However, the number of funding agencies, which correlates with the number of authors (and the number of international collaborations), helps increase the visibility of research and its scientific impact.

Declarations

Author contribution statement

Gregory S. Patience: Conceived and designed the experiments; Performed the experiments; Analyzed and interpreted the data; Contributed reagents, materials, analysis tools or data; Wrote the paper.

Christian A. Patience: Analyzed and interpreted the data; Contributed reagents, materials, analysis tools or data.

Bruno Blais, Francois Bertrand: Contributed reagents, materials, analysis tools or data.

Funding statement

This research did not receive any specific grant from funding agencies in the public, commercial, or not-for-profit sectors.

Competing interest statement

The authors declare no conflict of interest.

(22)

Additional information

Supplementary content related to this article has been published online at https://doi.org/10.1016/j.heliyon.2017.e00300.

References

Abbott, A., 2009. Italy introduces performance-related funding: agency to evaluate research is launched. Nature 460, 559.

Abramo, G., D’Angelo, C.A., 2015. The relationship between the number of authors of a publication, its citations and the impact factor of the publishing journal:

Evidence from Italy. J. Informetr. 9 (4), 746–761.

Adler, R., Ewing, J., Taylor, P., 2009. Citation statistics a report from the International Mathematical Union (IMU) in cooperation with the International Council of Industrial and Applied Mathematics (ICIAM) and the Institute of Mathematical Statistics (IMS). Stat. Sci. 24 (1), 1–14.

ARWU, 2016. Academic ranking of world universities. http://www.

shanghairanking.com/aboutarwu.htm.

Birnholtz, J.P., 2006. What does it mean to be an author? The intersection of credit, contribution, and collaboration in science. J. Am. Soc. Inf. Sci. Technol. 57 (13), 1758–1770.

Boffito, D.C., Patience, C.A., Patience, P.A., Bertrand, F., Patience, G.S., 2016.

How do you write and present research well? 8—assign authorship according to intellectual involvement. Can. J. Chem. Eng. 94 (6), 1127–1134.

Bornmann, L., Daniel, H.D., 2008. What do citation counts measure? A review of studies on citing behavior. J. Doc. 64 (1), 45–80.

Bornmann, L., Wallon, G., Ledin, A., 2008. Does the committee peer review select the best applicants for funding? An investigation of the selection process for two European molecular biology organization programmes. PLoS ONE 3, e3480.

Braun, T., Glänzel, W., Schubert, A., 2006. A Hirsch-type index for journals.

Scientometrics 69 (1), 169–173.

Cagan, R.L., 2013. The San Francisco Declaration on Research Assessment. Dis.

Models Mech. 6 (4), 869–870.

Colliander, C., Ahlgren, P., 2011. The effects and their stability of field normalization

baseline on relative performance with respect to citation impact: a case study of

20 natural science departments. J. Informetr. 5, 101–113.

(23)

Crespo, J.A., Li, Y., Ruiz-Castillo, J., 2010. The measurement of the effect on citation inequality of differences in citation practices across scientific fields. PLoS ONE 8 (3), e58727.

Cronin, B., 2001. Hyperauthorship: a postmodern perversion or evidence of a structural shift in scholarly communication practises? J. Am. Soc. Inf. Sci.

Technol. 52 (7), 558–569.

Dienes, K.R., 2015. Completing ℎ. J. Informetr. 9 (2), 385–397.

Ebadi, A., Schiffauerova, A., 2016. How to boost scientific production? A statistical analysis of research funding and other influencing factors. Scientometrics 106 (3), 1093–1116.

Finardi, U., 2013. Correlation between journal impact factor and citation performance: an experimental study. J. Informetr. 7 (2), 357–370.

Garfield, E., 1979. Is citation analysis a legitimate evaluation tool? Scientometrics 1, 359–375.

Garfield, E., 2006. The history and meaning of the journal impact factor. J. Am. Med.

Assoc. 295 (1), 90–93.

Gilbert, N., 2009. Good grades, but who gets the cash? Nature 457, 13.

Glänzel, W., Thijs, B., 2004. Does co-authorship inflate the share of self-citations?

Scientometrics 61 (3), 395–404.

Hirsch, J.E., 2005. An index to quantify and individual’s scientific research output.

Proc. Natl. Acad. Sci. 102 (46), 16569–16572.

Iglesias, J., Pecharromán, C., 2007. Scaling the ℎ-index for different scientific ISI fields. Scientometrics 73 (3), 303–320.

Kaur, J., Radicchi, F., Menczer, F., 2013. Universality of scholarly impact metrics.

J. Informetr. 7, 924–932.

Kinney, A.L., 2007. National scientific facilities and their science impact on nonbiomedical research. Proc. Natl. Acad. Sci. 104 (46), 17943–17947.

Leydesdorff, L., Opthof, T., 2010. Scopus’s source normalized impact per paper (SNIP) versus a journal impact factor based on fractional counting of citations.

J. Am. Soc. Inf. Sci. Technol. 61, 2365–2369.

Li, Y., Radicchi, F., Castellano, C., Ruiz-Castillo, J., 2013. Quantitative evaluation of alternative field normalization procedures. J. Informetr. 7, 746–755.

MacRoberts, M.H., MacRoberts, B.R., 1996. Problems of citation analysis.

Scientometrics 36, 435–444.

(24)

Moed, H.E., 2010. Measuring contextual citation impact of scientific journals.

J. Informetr. 4, 265–277.

Moed, H.E., 2017. A critical comparative analysis of five world university rankings.

Scientometrics 110, 967–990.

National Science Foundation, 2014. https://www.nsf.gov/statistics/2016/nsf16300/

digest/nsf16300.pdf. (Accessed 15 June 2015).

Patience, G.S., Boffito, D.C., Patience, P.A., 2015. Communicate Science Papers, Presentations and Posters Effectively. Academic Press, Waltham, MA.

Radicchi, F., Castellano, C., 2012. Testing the fairness of citation indicators for comparison across scientific domains: the case of fractional citation counts.

J. Informetr. 6, 121–130.

Redner, S., 1998. How popular is your paper? An empirical study of the citation distribution. Eur. Phys. J. B 4, 131–134.

Rørstad, K., Aksnes, D.W., 2015. Publication rate expressed by age, gender and academic position—a large-scale analysis of Norwegian academic staff.

J. Informetr. 9 (2), 317–333.

Schubert, A., Braun, T., 1986. Relative indicators and relational charts for comparative assessment of publication output and citation impact.

Scientometrics 9 (5), 281–291.

Tahamtan, I., Ashar, A.S., Ahamdzadeh, K., 2016. Factors affecting number of citations: a comprehensive review of the literature. Scientometrics 107 (3), 1195–1225.

Verma, I.M., 2015. Impact, not impact factor. Proc. Natl. Acad. Sci. 112 (26), 7875–7876.

Vieira, E.S., Gomes, J.N.F., 2010. Citations to scientific articles: its distribution and dependence on article features. J. Informetr. 4 (1), 1–13.

Vinkler, P., 2003. Relations of relative scientometric indicators. Scientometrics 58 (3), 687–694.

Vinkler, P., 2013. Comparative rank assessment of journal articles. J. Informetr. 7 (3), 712–717.

Waltman, L., van Eck, N.J., 2013. A systematic empirical comparison of different approaches for normalizing citation impact indicators. J. Informetr. 7, 833–849.

Web of Science TM Core Collection, 2015. http://apps.webofknowledge.com.

(Accessed 5 January 2015).

(25)

Yu, T., Yu, G., 2014. Features of scientific papers and the relationship with their citation impact. Malaysian J. Libr. Inf. Sci. 19 (1), 37–50.

Zitt, M., Small, H., 2010. Modifying the journal impact factor by fractional citation

weighting: the audience factor. J. Am. Soc. Inf. Sci. Technol. 61, 2365–2369.

Figure

Figure 1. The ℎ cat correlates with the average number of citations of the most highly ranked articles.
Figure 2. The weighted
Figure 3. The total citation count to the top papers in a category (30 &lt;
Figure 4. The average number of citations to the top ranked articles in a category 30 &lt;
+7

Références

Documents relatifs

The mean- ing of generic words evolved at the same time as taxonomies, which entailed a lexical vacancy for certain concepts: there is no word in modern French for

Considering the urgent need for new, automated approaches to browse and aggregate scientific information, in recent years a number of natural language processing challenges have

On the other, socio- cultural and historical parameters appear to be relevant at each level of color categorization and lexicalization, in the shaping of basic terms, in the

Focusing on the categories of nouns and verbs, Pinker suggests that children have innate knowledge of a relation between the noun word class and reference to a person

More crucially, we do not only report a list on the basis of the cumulated number of citations received between year of publication and the end of the observation period, but also

It is well known (see [Orl04], [BW12], [EfPo15], [BRTV]) that the dg-category of relative singularities Sing(B, f ) associated to a 1-dimensional affine flat Landau-Ginzburg model

On the other hand, combining the previous Proposition with the fact that Lurie’s model structure on scaled simplicial sets is cartesian (see [16 16, Proposition 3.1.8] and [16 16,

In section 1 we recall some background material on cluster-tilting objects in 2-CY categories, on generalized cluster categories from [Ami08] and on Jacobian algebras from