A remarkable change of the spectrum of the magnetic Of?p star
HD 148937 reveals evidence of an eccentric, high-mass binary
G.A. Wade∗
1, J.V. Smoker
2, C.J. Evans
3, I.D. Howarth
4, R. Barba
5, N.L.J. Cox
6,7,
N. Morrell
8, Y. Naz´e
9, J. Cami
10,11, A. Farhang
10,12, N.R. Walborn
13†, J. Arias
5, R. Gamen
14 1Department of Physics& Space Science, Royal Military College of Canada, PO Box 17000 Station Forces, Kingston, ON, Canada K7K 0C62European Southern Observatory, Alonso de Cordova 3107, Casilla 19001, Vitacura, Santiago 19, Chile 3UK Astronomy Technology Centre, Royal Observatory, Blackford Hill, Edinburgh, EH9 3HJ, UK 4Department of Physics& Astronomy, University College London, Gower Street, London WC1E 6BT, UK 5Departamento de F´ısica y Astronom´ıa, Universidad de La Serena, Av. Cisternas 1200, La Serena, Chile 6Anton Pannekoek Institute for Astronomy, University of Amsterdam, NL-1090 GE Amsterdam, The Netherlands 7ACRI-ST, 260 Route du Pin Montard, Sophia Antipolis, France
8Las Campanas Observatory, Carnegie Observatories, Casilla 601, La Serena, Chile 9FNRS - University of Li`ege, B5C, All´ee du 6 Aoˆut 19c, B4000-Li`ege, Belgium
10Department of Physics and Astronomy and Centre for Planetary Science and Exploration (CPSX), The University of Western Ontario, London, ON N6A 3K7, Canada 11SETI Institute, 189 Bernardo Ave, Suite 100, Mountain View, CA 94043, USA
12School of Astronomy, Institute for Research in Fundamental Sciences, 19395-5531 Tehran, Iran 13Space Telescope Science Institute, 3700 San Martin Drive, Baltimore, MD 21218, USA
14Instituto de Astrof´ısica de La Plata, CONICET–UNLP and Facultad de Ciencias Astron´omicas y Geof´ısicas, UNLP, Paseo del Bosque, s/n, La Plata, Argentina
Accepted . Received , in original form
ABSTRACT
We report new spectroscopic observations of the magnetic Of?p star HD 148937 obtained since 2015 that differ qualitatively from its extensive historical record of weak, periodic spec-tral variations. This remarkable behaviour represents clear evidence for an unprecedented change in the character of variability of the star. In this paper we describe the new spectral properties and compare them to the previous line profiles. Based on measurements of the ra-dial velocities of the C iii/N iii emission lines near 4640 Å and the C iv absorption lines near 5800 Å, we infer that HD 148937 is likely a high-mass, double-lined spectroscopic binary. Combining the spectroscopic orbit with an archival interferometric measurement of the appar-ent separation of the equal-brightness componappar-ents, we tappar-entatively conclude that HD 148937 consists of two O-type stars with masses of approximately 34 and 49 M , orbiting in an
ec-centric (e = 0.75), long-period (Porb ∼ 26 y) orbit. We discuss the potential relationship of
the binary system to the peculiar properties of HD 148937, and propose future observations to refine the orbital and stellar properties.
Key words: Stars : rotation – Stars: massive – Instrumentation : spectropolarimetry – Stars: magnetic fields – Stars: binaries: spectroscopic
1 INTRODUCTION
Magnetism in O-type stars is a recently-discovered phenomenon:
the first magnetic O-type star was reported only in 2002 (
Do-nati et al. 2002), and since that time large-scale surveys such as
the CFHT’s MiMeS (Wade et al. 2016;Grunhut et al. 2017) and
ESO’s BOB (Morel et al. 2015) Large Programs have succeeded in
identifying only a dozen in our Galaxy. As a consequence of the small sample size, our understanding of their properties is limited.
The known population (e.g.Wade & MiMeS Collaboration 2015)
∗E-mail: wade-g@rmc.ca †Deceased 22 February, 2018.
ranges in spectral type from around O6 to O9.5. Although spectral types are variable and luminosity classes challenging to establish for many magnetic O stars, most appear to be main sequence ob-jects. The detected magnetic fields are generally oblique dipoles, with polar strengths ranging from ∼ 0.1 kG to over 20 kG. Their magnetic fields channel their powerful winds, resulting in dense cir-cumstellar magnetospheres confined to co-rotate with the star ( Pe-tit et al. 2013). As a consequence, magnetic O stars exhibit strong variability across the electromagnetic spectrum, with line and con-tinuum emission modulated periodically according to the stellar ro-tation period.
Notwithstanding their relative rarity (Grunhut et al. 2017 re-ported that just 7 ± 3% of O stars observed in the MiMeS survey
host detectable magnetic fields), recent work has shown that mag-netic O stars may provide new keys to resolving a number of im-portant, outstanding puzzles in stellar evolution, including the large component masses of some merging black holes in binary systems (Petit et al. 2017), and the occurrence of pair-instability supernovae in high-metallicity environments (Georgy et al. 2017).
HD 148937 was classified as a member of the peculiar Of?p spectral class byWalborn(1972,1973). The spectral peculiarities that are diagnostic of this class are now known to be intimately associated with magnetism, and magnetic fields have been de-tected in all known Galactic members (Grunhut et al. 2017).Naz´e et al.(2008,2010) reported variability of optical spectral lines of HD 148937 with a period of 7.03 d, which they speculated may be related to the presence of a magnetic field, with the star viewed near the rotational pole.
At the time of its identification as a magnetic star in 2011 (Hubrig et al. 2011;Wade et al. 2012), HD 148937 was only the fifth known magnetic O star. It remains both the hottest and most massive star of this class (Teff = 41 kK, M ∼ 60 M ;Naz´e et al.
2008;Wade et al. 2012, but see further discussion in Sect. 5 of this paper). ESPaDOnS (e.g.Silvester et al. 2012) Stokes I and V obser-vations carried out by the MiMeS collaboration (Wade et al. 2012) detected a weak (∼ 300 G) longitudinal magnetic field and con-firmed relatively subtle variability of both the longitudinal field and
many optical spectral lines according to the 7.03 d period. Wade
et al.(2012) interpreted the results in the context of the Oblique
Rotator Model (ORM; Stibbs 1950), inferring that the star hosts
an oblique, dipolar magnetic field that confines the star’s outflow-ing wind into a co-rotatoutflow-ing dynamical magnetosphere with a mag-netic wind confinement parameter (which measures the degree to which the stellar wind dynamics are influenced by the magnetic
field) equal to η∗ = 20. As a consequence, the periodic
variabil-ity observed in the spectroscopic record is interpreted as rotational modulation according to its 7.03 d rotation period.
Many spectral lines of HD 148937 – including lines in strong emission, as well as those in absorption – exhibit detectable vari-ability according to this period (Naz´e et al. 2010; see Fig. 5 ofWade et al. 2012). The measured equivalent widths (EWs) of the spectral lines vary approximately sinusoidally, and emission and absorp-tion lines vary approximately in phase. This variability is also ex-plained by the ORM, in which rotation of the star and its oblique magnetosphere results in periodic modulation of the spectrum. For HD 148937,Wade et al.(2012) inferred a rotation axis inclination of i 6 30◦
, a magnetic obliquity β ∼ 40◦
, and a magnetic dipole strength of Bdof 1 kG.
Early studies left a number of peculiar characteristics of this
system unexplained. In particular,Wade et al.(2012) commented
that the star exhibits large cycle-to-cycle changes in the line pro-files that probe the magnetosphere. They attributed these variations to “intrinsic changes in the amount or distribution of emitting mate-rial with time, i.e. evolution of the magnetosphere of HD 148937”. However, they were unable to determine if the proposed evolution was secular or stochastic. They also noted that while the Zeeman signatures of HD 148937 observed in mean (Least Squares Decon-volved, or LSD) line profiles were very weak, a large Stokes V signal was observed in the absorption component of the He i λ5876 line. Since this line is not a particularly sensitive magnetic diagnos-tic, the appearance of a strong Zeeman signature in this line (while being absent from other lines of comparable magnetic sensitivity) was not straightforwardly understood byWade et al.(2012).
Finally, HD 148937 is distinguished from other magnetic O stars by its remarkable bipolar nebula, NGC 6164/5 (seeMahy et al.
2017, and references therein). Recently,Mahy et al.(2017) ana-lyzed Spitzer and Herschel observations of the NGC 6164/5 nebula to constrain its global morphology, kinematics and abundances, and the evolutionary status of the central star. They concluded that the structure of the nebula is particularly complex and is composed of a close bipolar ejecta nebula, an ellipsoidal wind-blown shell, and a spherically symmetric Str¨omgren sphere. The combined analyses of the known kinematics and of the new abundances of the nebula suggest either a helical morphology for the nebula, possibly linked to the magnetic geometry, or the occurrence of a binary merger. The latter hypothesis would be of great interest, since binary merg-ers have been proposed as a potential pathway to the generation of magnetic fields in massive stars (e.g.Langer 2012) .
HD 148937 was resolved as an interferometric binary in the course of the Southern Massive Stars at High angular resolution
survey (SMASH+;Sana et al. 2014). Those authors reported that
HD 148937 is an equal-brightness stellar pair (∆m = 0.00 ± 0.02
in H-band) with separation ρ = 21.05 ± 0.67 mas. Sana et al.
(2014) further detected a faint (∆H = 5.39 ± 0.15) companion at
3.30 ± 0.06 arcsec. Interestingly, none of the previous spectroscopic and imaging studies of the system (Naz´e et al. 2008,2010;Wade et al. 2012;Mahy et al. 2017) have reported any direct evidence of binarity.
The measured angular separation can be leveraged to deter-mine the instantaneous projected physical separation of the equal-brightness pair. The revised Hipparcos parallax implies a distance
d = 0.43 ± 0.11 kpc, yielding a separation of 8.9 AU1. On the
other hand, the Gaia DR2 parallax (Lindegren et al. 2018) yields a significantly greater distance of 1.14 ± 0.06 kpc, which implies an instantaneous separation nearly three times larger. However, both results may be compromised by the binarity (see Sect. 6.1).
In this paper we report a significant, unprecedented change in the optical line profiles of HD 148937 that stands in stark contrast to the historical record of its periodic variability. Potential origins of the unexpected variability could be associated with the probable binarity detected by interferometry. A companion of comparable mass and luminosity to the magnetic star might, for example, also be detectable spectroscopically, and its orbital motion might trans-late into spectral variability. Alternatively, the two stars might in-teract episodically or periodically, or one of the components might undergo instability and eruption, e.g. a Luminous Blue Variable (LBV)-like eruption. Another more exotic possibility is a signifi-cant reconfiguration of the stellar magnetosphere.
In order to better understand the origin of the change of the spectrum of HD 148937, we describe and analyze new spectro-scopic observations which, in combination with archival data, pro-vide new insight into the character of the HD 148937 system.
2 OBSERVATIONS
2.1 Optical spectroscopy
High-resolution, high signal-to-noise ratio (S/N) spectra of HD 148937 were obtained in August 2015, September 2016, April
1 We note that the paper bySana et al.(2014) appears to contain a typo, since those authors report an instantaneous projected separation of 40 AU based on the Hipparcos distance. We note furthermore that the article re-ports two slightly different values of ρ. H. Sana (priv. comm.) confirms that ρ = 21.05±0.67 mas as reported in table 1 of that paper is in fact the correct value.
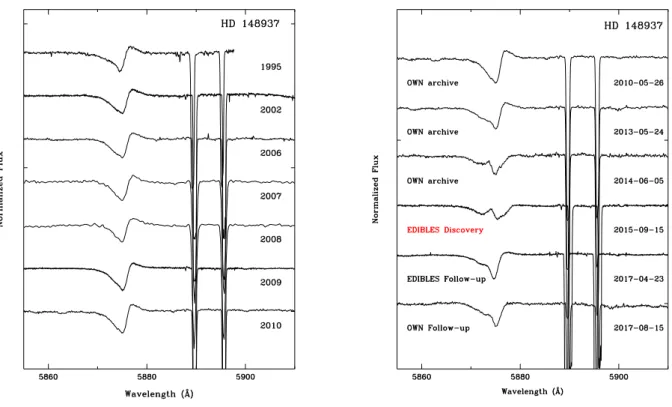
Figure 1. Left - Illustration of the telluric-corrected line profiles of He i λ5876 of HD 148937 prior to 2011. All profiles except the 1995 (UCLES) observation are qualitatively consistent with the range of profile shapes attributed to rotational modulation byWade et al.(2012). The UCLES profile shows a weaker extended blue wing that distinguishes it, and that may indicate that another episode, similar to that inferred to be occurring now, was underway at that time. Right -Illustration of the change in the character of the He i λ5876 profile in 2013, and its subsequent evolution.
2017, May 2017, and June 2017 in the context of the ESO Dif-fuse Interstellar Band Large Exploration Survey (EDIBLES) Large Program (Cox et al. 2017).
HD 148937 was observed with the UVES spectrograph (Dekker et al. 2000) mounted on the Very Large Telescope (VLT) at the Paranal Observatory. UVES covers the optical spectrum from 305 nm to 1042 nm at high spectral resolving power (R ∼ 71,000 in the near-UV/blue to R ∼ 107,000 in the red part of the spectrum). The scientific goals of the EDIBLES program require a very high S/N for each of the target spectra; typically the S/N is 700–1000 depending on the wavelength range. To achieve this data quality, additional calibration files and data reduction steps are necessary; see Cox et al. (2017) for details. HD 148937 was observed in total
on 5 different occasions by EDIBLES; however, on each visit only
part of the spectrum was observed.
Additional spectroscopic observations of HD 148937 were ob-tained during the intensive high-resolution spectroscopic campaign of Southern Galactic O- and WN-type stars (the “OWN Survey”;
Barb´a et al. 2010,2017). The data were obtained using the REOSC
Cassegrain spectrograph2in cross-dispersed mode attached to the
“Jorge Sahade” 2.15 m telescope at the Complejo Astron´omico El
Leoncito (CASLEO, Argentina; R= 15, 000, 3600 6 λ 6 6100 Å)
and the ´echelle spectrograph at the 2.5 m du Pont telescope of Las
2 On long-term loan from the University of Li`ege.
Campanas Observatory (LCO), in Chile (R= 40, 000, 3450 6 λ 6
9850 Å). Observations were collected between May 2006 and Au-gust 2017. For wavelength calibration of CASLEO and LCO spec-troscopic observations, we obtained calibration lamp (Th-Ar) ex-posures immediately before or after each target integration, at the same telescope position. The spectra were processed and calibrated using standard IRAF3routines.
One spectrum was obtained with the Magellan Inamori
Ky-ocera double Echelle spectrograph, MIKE (Bernstein et al. 2003)
on the 6.5m Magellan II (Clay) telescope. HD 148937 was ob-served through a 0.700
slit yielding R ∼ 40, 000 in the blue side (3350-5000 Å) and R ∼ 33, 000 in the red side (4900-9500 Å). Both detectors were read out in 2x2 binning mode. The S/N is around 200 in the region containing He i λ5876. The data were reduced with IRAF echelle routines.
Ten FEROS spectra, 5 of which were first discussed and mea-sured byNaz´e et al.(2008), were also included. We also include a single spectrum obtained using the UCLES spectrograph at the Anglo-Australian Telescope in 1995, that was also discussed and analyzed by those authors.
3 IRAF is distributed by the National Optical Astronomy Observatories, which are operated by the Association of Universities for Research in Astronomy, Inc., under cooperative agreement with the National Science Foundation.
Finally, we also included a single UVES-POP observation (Bagnulo et al. 2003) obtained in 2002, and a subset of the
ES-PaDOnS spectra (obtained in 2009 and 2010) reported by Wade
et al.(2012).
We note that while some other spectra of HD 148937 may ex-ist in the archives, these data either do not add significantly (typi-cally having been acquired at dates similar to the data in hand) or are lacking coverage of the key spectral features (i.e. the λ5800 and λ4640 features) used in our study.
All of the spectra used in this study are summarized in Table1.
2.2 X-ray flux
New X-ray observations were acquired to investigate if the X-ray emission of HD 148937 has been impacted by the phenomena re-sponsible for the recent spectroscopic changes (as is further dis-cussed in Sect. 6.3).
We obtained a new observation of HD 148937 with Chandra (Weisskopf et al.(1996); ObsID = 20148, 9ks duration) in June 2018. The source spectrum was extracted using “specextract” un-der CIAO v4.9 in a circle centered on the SIMBAD coordinates of HD 148937 and with 5 pixels radius. The background spectrum was extracted in the surrounding annulus with external radius of 15 pixels. Response matrices necessary for flux and energy calibration were calculated after extraction and the spectrum was grouped to reach a minimum of 15 counts per bin. To avoid pile-up, the data were obtained only for a subarray of ACIS (chip #7) in TE (timed exposure) mode and using a frame time of 0.4 s.
As appropriate for massive stars, the spectral fitting was done within Xspec using an absorbed optically-thin thermal emission
model of the type wabs × phabs × (apec1+ apec2), considering
plasma abundances fixed to those ofAnders & Grevesse(1989). The first component (wabs) represents the interstellar absorption, which was fixed to the appropriate value (i.e. absorbing column Nint
H = 4 × 10
21 cm−2, see Naz´e et al. 2012b and references
therein). The second one (phabs, which has a single fitted pa-rameter Nadd
H ) accounts for potential circumstellar absorption. The
last components (apec1,2) represent the thermal emission by the
hot plasma. Two components are needed to fit well the observed spectra (see Naze et al. 2012b) ; each one has two free param-eters : the temperature (kT ) and the normalization factor (norm) which is linked to the emission measure of the plasma. As in
Naz´e et al. (2012b), there are two solutions of similar quality (χ2∼ 1) : the ”cool” solution has Nadd
H = (0.34 ± 0.08) × 10
22cm−2,
kT1 = 0.29 ± 0.03 keV, norm1 = (1.1 ± 0.4) × 10−2cm−5, kT2 =
2.02 ± 0.09 keV, and norm2 = (3.20 ± 0.15) × 10−3cm−5; the ”hot”
one has Na
Hdd= (0.07 ± 0.08) × 10
22cm−2, kT
1= 0.74 ± 0.03 keV,
norm1 = (2.0 ± 0.4) × 10−3cm−5 , kT2 = 2.6 ± 0.2 keV, and
norm2 = (2.25 ± 0.17) × 10−3cm−5. The observed flux in the 0.5–
10.keV energy range is (3.3 ± 0.1) × 10−12erg cm−2s−1.
3 LONG-TERM LINE PROFILE VARIABILITY OF
HD 148937
The change in character of the spectrum of HD 148937 was first identified by the EDIBLES team from profiles of the He i λ5876 line obtained in 2015 (on JD 2457251, which we will refer to as ‘the 2015 spectrum’). As illustrated in the left panel of Fig.1, the profile of the λ5876 line maintained the same essential quasi-P Cyg morphology in observations obtained from 1995-2010. The (small) range of variability of the profiles acquired during this period is in
HJD UT date Instrument RV λ4640 RV λ5800 -2400000 (km s−1) (km s−1) 49822.5 1995-04-15 UCLES∗ −24.3 ± 1 −23.9 ± 3 52332.841 2002-02-27 UVES −15.5 ± 1 52783.757 2003-05-24 FEROS −17.6 ± 1 −22.5 ± 3 52784.749 2003-05-25 FEROS −17.8 ± 1 −21.4 ± 3 53131.618 2004-05-06 FEROS −18.3 ± 1 −25.0 ± 3 53509.728 2005-05-19 FEROS −17.6 ± 1 −23.8 ± 3 53547.535 2005-06-26 FEROS −17.4 ± 1 −28.2 ± 3 53866.8 2006-05-11 CASLEO −12.4 ± 3 −24.2 ± 4 53871.828 2006-05-16 CASLEO −14.0 ± 3 −32.3 ± 5 53874.758 2006-05-19 du Pont echelle −19.6 ± 1 −27.9 ± 3 53898.789 2006-06-12 FEROS −17.4 ± 1 −20.9 ± 3 53951.543 2006-08-04 FEROS −17 ± 1 −23.3 ± 3 53920.672 2006-07-04 du Pont echelle −16.9 ± 1 −30.4 ± 3 53938.632 2006-07-22 du Pont echelle −18.4 ± 1 −31.9 ± 3 53955.53 2006-08-08 MIKE −18.6 ± 1 −32.3 ± 3 54210.82 2007-04-20 FEROS −18.3 ± 3 −33.8 ± 4 54220.798 2007-04-30 CASLEO −10.2 ± 3 −28.1 ± 4 54252.711 2007-06-01 CASLEO −4.6 ± 3 −29.4 ± 4 54286.644 2007-07-05 CASLEO −8.0 ± 3 −33.7 ± 4 54511.873 2008-02-15 CASLEO −11.1 ± 3 −35.7 ± 4 54582.734 2008-04-26 CASLEO −16.3 ± 3 −30.1 ± 4 54608.737 2008-05-22 CASLEO −13.3 ± 3 −38.4 ± 4 54642.735 2008-06-25 CASLEO −17.4 ± 3 −28.1 ± 4 54659.564 2008-07-12 CASLEO −17.6 ± 3 −34.3 ± 4 54904.882 2009-03-14 FEROS −17.8 ± 2 −25.8 ± 3 54914.909 2009-03-24 FEROS −18.5 ± 2 −23.5 ± 3 54955.047 2009-05-03 ESPaDOnS −17.2 ± 1 −24.3 ± 3 55078.728 2009-09-04 ESPaDOnS −18.9 ± 1 −22.7 ± 3 55342.751 2010-05-26 du Pont echelle −17.5 ± 1 −32.0 ± 3 55400.771 2010-07-23 ESPaDOnS −17.6 ± 1 −25.3 ± 2 55403.778 2010-07-26 ESPaDOnS −16.1 ± 1 −23.7 ± 2 56436.738 2013-05-24 du Pont echelle −26.1 ± 1 −22.8 ± 3 56813.69 2014-06-05 du Pont echelle −50.9 ± 2 −6.3 ± 3 57251.589 2015-08-17 UVES −55.1 ± 1 −0.8 ± 2 57644.548 2016-09-13 UVES −39.1 ± 1 57867.755 2017-04-24 UVES −34.0 ± 1 −18.5 ± 2 57890.906 2017-05-17 UVES −35.9 ± 1 57924.5 2017-06-20 UVES −34.0 ± 1 57933.636 2017-06-29 du Pont echelle −31.6 ± 1 −15.1 ± 3 57934.654 2017-06-30 du Pont echelle −31.3 ± 1 −17.7 ± 3 57935.654 2017-07-01 du Pont echelle −31.1 ± 1 −17.1 ± 3 57936.666 2017-07-02 du Pont echelle −31.8 ± 1 −16.2 ± 3 57980.614 2017-08-15 du Pont echelle −31.7 ± 1 −13.1 ± 3 57981.621 2017-08-16 du Pont echelle −32.6 ± 1 −15.1 ± 3 57983.574 2017-08-18 du Pont echelle −31.8 ± 1 −15.2 ± 3
Table 1. Visible spectroscopy of HD 148937 employed in this investigation and measurements of the heliocentric radial velocities of the N iii/C iii emis-sion line complex at ∼ 4640 Å and the C iv absorption lines at 5801/11 Å. The single UCLES observation (marked with a∗), first reduced and ana-lyzed byNaz´e et al.(2008), has been re-reduced and re-measured for this study.
good general agreement with the 7.03 d rotational variability mea-sured in past studies.
As shown in the right panel of Fig.1, the 2015 UVES
spec-trum revealed a stark change in the λ5876 profile; the initiation of this change can be traced back to at least 2013, and the profiles ap-pear to be returning to normal in 2017 (see Fig.1and below). Our principal aim in this paper is to understand this phenomenon via a deeper examination of the spectroscopy.
4630 4635 4640 4645 4650 Wavelength (Å) 1 1.1 1.2 1.3 Flux EDIBLES 2015 EDIBLES 2016 EDIBLES 2017 ESPaDOnS max ESPaDOnS min 4680 4685 4690 Wavelength (Å) 1 1.1 1.2 Flux 4850 4860 4870 Wavelength (Å) 0.85 0.9 0.95 1 Flux 4915 4920 4925 Wavelength (Å) 0.96 0.98 1 1.02 1.04 Flux 5196 5200 5204 5208 Wavelength (Å) 0.96 0.97 0.98 0.99 1 1.01 Flux 5400 5410 5420 Wavelength (Å) 0.85 0.9 0.95 1 Flux 5795 5800 5805 5810 5815 Wavelength (Å) 0.88 0.92 0.96 1 Flux 5865 5870 5875 5880 5885 Wavelength (Å) 0.85 0.9 0.95 1 1.05 Flux 6550 6560 6570 Wavelength (Å) 0.9 1 1.1 1.2 1.3 Flux
Figure 2. The black (solid and dashed) profiles show the range of variability of each spectral line in the ESPaDOnS dataset of Wade et al. (2012). The red, green and blue profiles show the EDIBLES observations obtained in 2015 (JD 2457251), 2016 (JD 2457644) and 2017 (JD 2457867), respectively. Spectra are in the heliocentric reference frame and have not been corrected for telluric absorption.
the 2015 spectrum, shown in red. As the 2015 observation included only the ’346’ (3042-3872 Å) and the ’564’ (4616-6653 Å) settings of UVES, we employ the 2016 UVES observation (JD 2457644, obtained in the ’437’ setting, yielding wavelength coverage from 3752-4988 Å) for the He ii λ4686 line, which was located at the edge of an order in the 2015 spectrum. These data are shown in green. For comparison, we also show the April 2017 UVES spec-trum (JD 2457867) for all lines (except Hα, because this line was
saturated) and the two ESPaDOnS spectra (Wade et al. 2012)
se-lected to characterize the full range of short-term (rotational)
vari-ability of the spectrum observed in 2009/10. These are shown in
black.
A significant change of both line position and shape is ob-served in essentially all lines in 2015-16, including both emission and absorption lines. In particular, we note that emission lines sen-sitive to the magnetosphere (i.e. those observed byNaz´e et al. 2008
andWade et al. 2012to vary significantly according to the 7.03 d rotational period: Balmer lines, He i λ5876, He ii λ4686), emission lines insensitive to the magnetosphere (exhibiting weak to no de-tectable 7.03 d variability: the λ4640 complex of C iii and N iii lines,
He i λ4921), and photospheric absorption lines (N iv λ5200/04, He ii λ5411, C iv λ5801/11) show significantly different morpholo-gies in the 2015-16 spectra relative to the historical record as illus-trated by the ESPaDOnS spectra. Moreover, the 2017 spectra show profiles that are generally more similar to those observed histori-cally, supporting our impression that 2015 represented the extreme of the event, after which the spectrum has been gradually returning to normal.
In the remainder of this report, we focus our attention on one notable feature of the variability of HD 148937: the apparent wholesale shifts of the C iii and N iii λ4630−50 emission peaks, and the λ5801/11 absorption cores, in the profiles illustrated in Fig.2. We note in particular the fact that the absorption lines appear to shift in the direction opposite to that of the emission lines.
4 RADIAL VELOCITIES OF THE C III/N III λ4634 − 47 EMISSION LINES AND THE C IV λ5801/11
ABSORPTION LINES
We have determined the radial velocities (RVs) of the
N iii λλ4634.140, 4640.640 and C iii λ4647.418 lines by measuring the wavelengths of the sharp peaks of the emission of these three lines in each spectrum. Due to blending, we did not measure the C iii λ4650 line RV. We computed the simple mean RV of the emission lines. These values are reported in the fourth column
of Table 1. Similarly, we determined the radial velocities of the
C iv λλ5801.310, 5811.970 lines by measuring the wavelengths of the absorption cores of these two lines. Again, we computed the simple mean RV of these absorption lines. These values are
reported in the fifth column of Table 1. Note that some spectra
didn’t cover one or the other of these regions, explaining blank entries in Table1.
Conti et al.(1977) reported radial velocities of a number of lines in the spectrum of HD 148937 with typical uncertainties of or-der 5 km s−1. While line-to-line velocity differences were reported,
no significant velocity variations were reported by those authors, nor did they report RVs for the λ4640 or λ5800 lines. Similar re-sults were reported byNaz´e et al.(2008).
We re-measured the RVs of the UCLES spectrum and FEROS spectra discussed byNaz´e et al.(2008), finding velocities in rea-sonable agreement with the values reported in those papers.
Finally, we also considered the SMARTS RVs discussed by
Naz´e et al.(2008). However, since these measurements are of lower precision, they didn’t add significantly to our analysis. Therefore we will not discuss them any further here.
We checked for systematic errors in the RVs by verifying the absence of any detectable shifts of the strong, sharp Na i interstellar features located close to the C iv absorption lines. Random uncer-tainties were estimated for each line from the dispersion of mea-surements from independent spectra obtained close in time (when available), or from multiple measurements of individual spectra (when they were not). These values, typically ∼ 1−2 km s−1 for the
λ4640 emission lines and ∼ 2 − 4 km s−1 for the λ5800 absorption
lines, are reported in Table1.
Both the λ4640 and λ5800 RVs exhibit significant changes between 1995 and 2017. These changes are much larger than the ∼ 2 km s−1 scatter of the RVs of these lines measured from the full
collection of ESPaDOnS spectra ofWade et al.(2012). We note
in particular that (i) in accordance with our initial impression, the λ4640 and λ5800 RVs vary in opposition to one another, and (ii) the largest difference in RV between the λ4640 and λ5800 lines (ap-proximately 54 km s−1) occurred in 2015, at the time of the largest
distortion of the He i λ5876 line.
5 HD 148937 APPEARS TO BE A MASSIVE SB2
The character of the RV measurements is highly suggestive of bi-nary motion, in which the λ4640 emission lines diagnose the RV of one stellar component, and the λ5800 absorption lines diagnose the other component.
To test this hypothesis, we employed the IDL orbital fitting code Xorbit (Tokovinin 1992) to model the orbit. This code deter-mines the best-fitting orbital period Porb, Julian date of periastron
passage (T ), eccentricity (e), longitude of the periastron (ω), semi-amplitudes of each component’s radial velocities (K1and K2), and
the radial velocities of the centre of mass (γ1,2 for both
compo-Figure 3. Solid curve - Residuals from best-fit orbital solutions for a range of fixed period. Dashed curve - Implied projected mass of the primary star versus period.
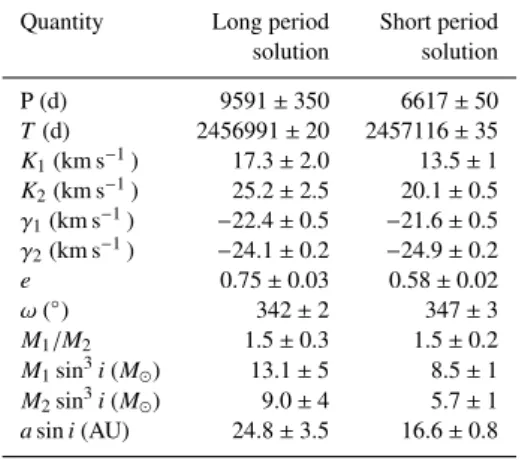
Quantity Long period Short period solution solution P (d) 9591 ± 350 6617 ± 50 T(d) 2456991 ± 20 2457116 ± 35 K1(km s−1) 17.3 ± 2.0 13.5 ± 1 K2(km s−1) 25.2 ± 2.5 20.1 ± 0.5 γ1(km s−1) −22.4 ± 0.5 −21.6 ± 0.5 γ2(km s−1) −24.1 ± 0.2 −24.9 ± 0.2 e 0.75 ± 0.03 0.58 ± 0.02 ω (◦) 342 ± 2 347 ± 3 M1/M2 1.5 ± 0.3 1.5 ± 0.2 M1sin3i(M ) 13.1 ± 5 8.5 ± 1 M2sin3i(M ) 9.0 ± 4 5.7 ± 1 asin i (AU) 24.8 ± 3.5 16.6 ± 0.8
Table 2. Orbital solution computed from the λ4640 and λ5800 RVs.
nents), performing least-squares fits to the measured radial veloci-ties.
An acceptable fit to the data is achieved with the orbital hy-pothesis. The spectroscopic data appear to cover only slightly more than one orbital period, and with only sparse sampling of the phase of periastron passage. As a consequence, the RVs allow two dis-tinct periods to fit the data more or less equally well. As illustrated in Fig.3, the residuals from the best-fit orbital solutions for a range of fixed period (from 2000 to 20000 d at 20 d steps) confirm that there are reasonable solutions for periods around 6500 d (formally 6617 ± 50 d) and ∼> 9000 d (with a formal best fit at 9591 ± 350 d), with this longer period actually giving marginally better residuals. The ambiguity in P arises essentially because we are as yet unable to determine if the first (UCLES) observation falls before or after the previous periastron passage. Nevertheless, the two periods yield similar orbital geometries, with roughly the same RV amplitude ra-tios and zero points. The eccentricity derived for the longer period is somewhat higher (0.75 versus 0.58). While periods larger than 9000 d are relatively unconstrained by the existing data, we note that the implied projected mass of the primary star becomes rapidly unphysical for periods longer than 10,000-11,000 days. This is also illustrated in Fig.3.
Nota et al.(1996) reported acquiring an ESO EMMI spectrum of HD 148937 between 17-20 September, 1991. While the origi-nal data no longer appear to be available, illustrations of line
pro-Figure 4. Model orbits fit to the RVs. Left - RV showing models versus JD corresponding to P= 9591 d (the “long-period solution”, solid curve), P = 6617 d (the “short-period solution”, dashed curve), and an arbitrary model with P= 13000 d (a “very-long period” solution, dot-dashed curve). Right - RVs phased and folded according to the P= 9591 d period. In both plots the blue symbols are the λ5800 measurements, corresponding to the primary component. The red symbols are the λ4640 measurements, corresponding to the secondary star. The vertical dashed line in the left panel represents the date of the EMMI observation by Nota et al.
files provided in their paper suggest that the λ5876 line was likely experiencing distortions at that time similar to those exhibited in 2015/2017. In particular, the λ5876 profile illustrated in their pa-per bears a strong similarity to those obtained in May 2013 and
April/August 2017 (See Fig. 1). These observations bracket the
epoch of strongest distortion of the line. Since the observation ob-tained byNota et al.(1996) was obtained roughly 8500 d prior to the most recent periastron passage, if we suppose that the spectro-scopic variability is associated with orbital phase (noting that the appearance of line-profile anomalies in 2014/15 coincided closely with periastron passage, regardless of the adopted orbital period) this would a imply period of ∼ 8000 d (if the EMMI spectrum was obtained before the previous periastron passage) or ∼ 9500 (if it was obtained after the previous periastron passage). The lat-ter timescale is consistent with the long-period model, which we tentatively adopt as our reference model.
Using Xorbit we were able to achieve a reasonable simulta-neous fit to the measured RVs of both sets of lines, for both orbital
periods described above. Fig. 4illustrates the RVs of both stars
versus JD and phased assuming the longer period. The RV
semi-amplitudes imply a mass ratio M1/M2 = 1.5, with an uncertainty
of 15-20%. The orbital parameters derived from the SB2 solution adopting the longer and shorter periods are summarised in Table2. Given the limited quality and coverage of the data, we focus on the general characteristics of the solution rather than the details.
6 DISCUSSION
We have reported a remarkable change of the spectrum of the mag-netic Of?p star HD 148937 that departs qualitatively from the long historical record of the star’s periodic 7.03 d variability.
Our measurements of the λ4640 (the N iii λλ4634, 4640 and C iii λ4647 emission lines) and λ5800 (the λλ5801, 5811 absorp-tion lines) RVs show convincingly that the spectrum variaabsorp-tion is significantly influenced by binary motion of two stellar compo-nents. If our orbital interpretation is correct, then it appears that the λ4640 RVs are principally sensitive to the motion of one star
(the lower-mass secondary), while the λ5800 RVs trace the motion of the higher-mass primary star. Examination of the variations of
the Hα and He ii λ4686 profiles shown in Fig.2– lines observed
byNaz´e et al.(2008);Wade et al.(2012) to vary strongly accord-ing to the 7.03 d period – reveals that they also show bulk RV shifts qualitatively consistent with the λ4640 lines. Since we expect that these emission lines arise principally in the magnetosphere, we ten-tatively interpret this to imply that the lower-mass secondary star is also the magnetic star.
6.1 Astrometric considerations
As noted in Sect. 1, long baseline interferometric observations of
HD 148937 obtained with VLTI/PIONIER by Sana et al.(2014)
revealed two equally bright components in the H-band (∆H = 0.00 ± 0.02). Those authors assumed the Hipparcos distance to de-rive the instantaneous projected separation. However, the Hippar-cos parallax they used is only significant at 3σ confidence. Given
V = 6.7 and E(B − V) = 0.61 (Mahy et al. 2017), adopting the
Hipparcos distance the implied absolute magnitude of the system
is MV = −3.3, which is somewhat faint for an O star (and another
0.75 mag fainter if we correct for a roughly equal-brightness com-panion).
As discussed in the introduction, the recent Gaia DR2 par-allax re-evaluation (Lindegren et al. 2018) implies a distance of 1.14 ± 0.06 kpc. However,Lindegren et al.(2018) explicitly discuss DR2 results for unresolved/partially resolved multiple systems. In particular, they note: “In this release, all sources beyond the solar system are still treated as single stars, that is, as point objects whose motions can be described by the basic five-parameter model. For unresolved binaries (separation ∼< 100 mas), the photocentre is con-sistently observed and the astrometric parameters thus refer to the position and motion of the photocentre in the wavelength band of the G magnitude. Orbital motion and photometric variability may bias the astrometric parameters for such sources.” Given the results ofSana et al.(2014) reporting the detection of a companion of
sim-ilar H-band magnitude at a separation of about 21 mas, we interpret the DR2 results with a degree of skepticism.
Given the weak constraints from the Hipparcos parallax, and our concerns about the reliability of the Gaia parallax, it may well be more secure to adopt a distance based on assumed membership
of Ara OB1 (e.g. Humphreys 1978, which lists m − M = 10.7,
implying d= 1.4 kpc). We note that Mahy et al. quote a distance of 1.3 kpc, whileMel’Nik & Dambis(2009) give 1.1 and 2.8 kpc for Ara “OB1A” and “OB1B”, respectively. Distances of order 1 kpc are more consistent with the fluxes expected of typical O stars, and also more consistent with the Gaia parallax (notwithstanding the caveat noted above). It therefore seems plausible that the distance to HD 148937 is similar to that implied by the Gaia parallax, and considerably larger than implied by the Hipparcos parallax (i.e. 1.0-1.4 kpc, rather than 425 pc). This conclusion is also supported by the interstellar Ca ii column density reported byHunter et al.(2006) interpreted using the relationships ofSmoker et al.(2015).
Gaia DR2 also reports a G=12.1 (as compared to G=6.6 for HD 148937) source located at an angular separation of 3.3
arc-sec. This source certainly corresponds to the ∆H=5.4 neighbour
observed bySana et al.(2014). The parallax of this source yields a distance somewhat smaller than (but within 2σ of) the brighter source. However, given the caveat discussed above, it is not clear that we can draw any significant conclusions regarding its physical association with the main system. Certainly the formal parallaxes are not very different from one another.
Knowing the spectroscopic orbit, we can in principle calculate the projection of the orbit onto the plane of the sky, given two ad-ditional angles: the position angle of the ascending node, and the orbital inclination (e.g.Harries & Howarth 1996). The former is of no particular interest (it merely defines the orientation of the pro-jected orbit), but we can readily plot the propro-jected linear separation of the components as a function of orbital phase for any given in-clination.
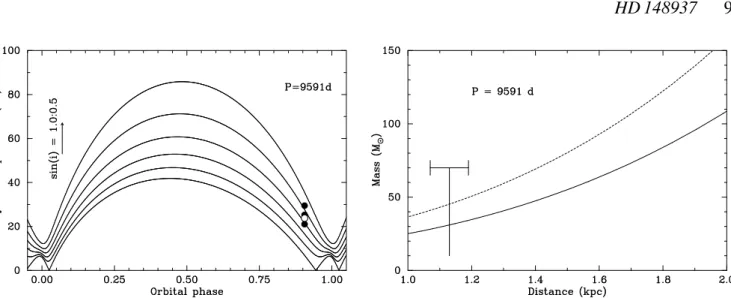
Fig.5(left panel) presents such plots for the longer orbital period; the curves are for sin(i)= 1.0, 0.9, 0.8... (from the bottom up). At the moment, we only have one direct measurement of the angular separation from SMASH+; we take ρ = 21.05 mas at JD 2456088. Converting the date to phase assuming the longer period, and the angular measure to linear measure, we can add this observa-tion to the plots – shown as dots for assumed distances of 1.0, 1.2, and 1.4 kpc (bottom to top). Because the curves in these plots are not parallel, additional astrometric observations can, in principle, constrain distance and inclination separately. But even this single observation has some utility, as it constrains sin i to 0.65 ± 0.1 for this plausible range of distance.
Adopting sin i = 0.65 ± 0.1 (or i = 40 ± 8◦
), the implied
masses of the components are 49 M and 34 M for the primary
and secondary. As illustrated in Fig.5(right panel), the full range of permitted masses - given the uncertainty on both distance and period - for the secondary is rather large. (We note that Wade et al. (2012) reported a mass of HD 148937 of 60 M , but without benefit
of knowledge of the system’s multiplicity.) The other known Of?p
stars have masses ranging from 30 − 45 M (e.g.Wade & MiMeS
Collaboration 2015), in agreement with the result for the secondary, but consistent with the mass of either star given the uncertainties.
6.2 Spectrum formation and composition
Why do the λ4640 and λ5800 features seem to distinguish the mo-tion of the stars so clearly? It is known that the N iii λλ4634/40/42 and C iii λλ4647/50/52 emissions are strongly peaked at
spec-tral type O5 in Ofc stars (Walborn et al. 2010). This spectral type seems too early given the secondary’s mass, but strong and vari-able C iii λλ4647/50/52 emission is also a defining characteristic of the magnetic Of?p stars. Moreover, examining spectra in our possession reveals that the N iii and C iii emission line intensi-ties of HD 148937 are the strongest of any of the Galactic Of?p stars, and stronger than those of HD 191612 (which has the next-strongest emission in this region) by about 80%. It therefore seems reasonable to assume that the magnetic secondary’s emission lines dominate in the λ4640 region.
EWs of the C iv λλ5801/11 lines as a function of spectral type (Fullerton et al. 1996) peak at O6-O7.5 for all luminosity classes. The combination of a mid-O star (strong C iv) plus a late-O star (weak C iv) of similar continuum brightness is roughly consistent with the observed EW of the λ5801 line. Such a scenario could po-tentially explain the sensitivity of the C iv lines to the primary’s motion. We note that this necessarily implies that the more massive primary star is hotter than the magnetic secondary star. As a con-sequence, the identical H-band magnitudes of the two stars need to be understood. Non-rotating evolutionary tracks ofEkstr¨om et al.
(2012) for 35 and 50 M stars differ by somewhat less than a factor
of ∼ 2 (i.e. 0.3 dex) in bolometric luminosity through most of the main sequence, but knowledge of the effective temperatures of the two stars and their relative radii would be necessary to evaluate the expected H-band flux ratio. This puzzling characteristic of the sys-tem should be investigated further once additional constraints on the masses, radii, and temperatures of the stars have been obtained. Given that the details of the formation of the spectrum are poorly understood, it is worth evaluating if all of the observed vari-ability could potentially be explained by the intrinsic varivari-ability of a single star. While the evidence presented above leading us to in-terpret the change in the spectrum of HD 148937 as a consequence of the mutual orbital motion of two massive O-type stars is com-pelling, it might be argued that other phenomena, e.g. asymmetric infilling of spectral lines results in the appearance of RV variations. However, we underscore that photospheric absorption lines (high ions of C and N with weak sensitivity to the magnetosphere and circumstellar environment), emission lines that are clearly sensi-tive to the magnetosphere (showing strong modulation according to the 7.03 d rotational period of the magnetic star), as well as emission lines that are not modulated by the rotational period, are all impacted by this episode. Qualitatively, this seems hard to ex-plain by, e.g. variable emission resulting from enhanced mass loss. Moreover, careful examination of the C iv λ5801 line (in particular) shown in Fig. 2 shows that its variability does not seem to be con-sistent with infilling by emission; the observed RV variation repre-sents a wholesale shift of the entire line. Similarly, the λ4640 lines experience no significant change in shape, but are rather moved (fully and in tandem) to the blue in Fig. 2. Finally, the independent interferometric observation provides clear corroborating evidence of binarity in the detection of a companion of similar magnitude. We therefore conclude that a model invoking intrinsic line profile variations of a single star to explain these diverse phenomena is far less simple, and therefore less preferable, than the adopted ec-centric binary interpretation, which provides a straightforward in-terpretation of the data, yields physical parameters that are broadly consistent with the expected properties of the components, and is quantitatively falsifiable. As a consequence, while the detailed for-mation of the system’s spectrum clearly deserves further investiga-tion, we conclude that the binary origin of the apparent RV varia-tions is currently the best interpretation of the observed variability.
Figure 5. Left - Projected separation of the components of HD 148937 assuming the longer-period (P= 9591 d) orbital solution. The curves correspond to inclinations sin i= 1.0, 0.9, 0.8... (from the bottom up). Filled circles are the separation for assumed distances of 1.0, 1.2, and 1.4 kpc (bottom to top). The open circle represents the Gaia DR2 distance, for reference. Right - Constraint that the single SMASH+ observation provides on masses as a function of distance. The two curves correspond to M1and M2. The Gaia DR2 distance is indicated by the vertical line. We remind the reader that the Gaia distance may be systematically affected by the presence of the close interferometric companion.
6.3 X-rays
The new ray observations were acquired to investigate if the X-ray emission of HD 148937 has been impacted by the phenomena responsible for the recent spectroscopic changes.
To avoid cross-correlation problems, we compare the fitting results described in Sect. 2.2 to those derived from fits to the previ-ous Chandra datasets (Naz´e et al. 2012b). The spectral parameters are very similar, except for a slight increase in normalization fac-tors (e.g. for the “cool” solution, the first normalization remains constant but the second one is 20% larger). The observed flux is consequently larger, by ∼20%, and this flux difference appears sig-nificant (6σ). Compared to the flux derived from older XMM data (Naz´e et al. 2008), the change is even smaller (∼ 5%).
No large change in the X-ray flux of HD 148937 is expected in the context of magnetically-confined wind shocks, since the small inferred inclination angle of the star leads to the magnetosphere be-ing viewed from a similar perspective at all phases, yieldbe-ing weak rotational modulation. Hence the 20% increase in flux compared to the previous Chandra observations likely requires a different expla-nation. In massive binaries, X-rays are sometimes emitted due to a strong collision between the stellar winds. In the case of long peri-ods, as is the case here, such collisions are adiabatic in nature, and the X-ray luminosity varies as 1/separation with absorption effects only playing a role close to the periastron passage (for a review, seeRauw & Naz´e 2016). The three X-ray datasets were taken at
JD= 2451966.2 (XMM,Naz´e et al. 2008), 2455353.6 (Chandra;
Naz´e et al. 2012b), and 2458286.8 (new Chandra data), which cor-respond to relative separations of 1.7, 1.2, and 1.1, respectively, for the long-period solution. If colliding winds alone were responsible for the X-ray emission of HD 148937, then the largest flux would have been expected for the new observation and the lowest (35% lower flux) for the XMM observation, with little change between the two Chandra observations, but the observations indicate other-wise.
For the short-period solution, relative separations would be 1.2, 1.3, and 1.1 for the three datasets, respectively, with expected increases in flux of ∼8% and ∼15% for the new dataset compared to the XMM and old Chandra observations, respectively. At first
sight, the observed X-ray properties may thus appear very compat-ible with the short-period scenario. However, the good agreement in amplitude changes must be considered in the context that the colliding wind contribution is small far from periastron (see e.g.
Naz´e et al. 2012a). For the first Chandra observation, the X-ray flux should be close to the canonical relation log(LX/LBOL) ∼ −7
natu-rally expected for massive stars, whereas log(LX/LBOL) ∼ −6.25 is
derived from data. This suggests that the bulk of the X-ray emission does not come from colliding winds. Indeed, the emission level ob-served previously is fully compatible with predictions of confined winds models (Naz´e et al. 2014). This implies that any colliding wind contribution will be diluted, leading to lower variability lev-els. Considering this fact, the X-ray variability of HD 148937 is thus not fully explained, but is likely not incompatible with a con-tribution from colliding winds in a binary system.
6.4 Other outstanding issues, and future observations
Spectral variability of Of?p stars is often accompanied by
photo-metric changes (e.g.Walborn et al. 2004). However, photometry
is scarce for HD 148937.Naz´e et al.(2008) reviewed published
analyses of photometric observations of HD 148937, summariz-ing evidence for long-term variability and performsummariz-ing an analy-sis of the Hipparcos and Tycho photometry. They concluded that no significant change or periodicity is present (see as well
fig-ure 13 ofWade et al. 2012). In addition to the photometry
dis-cussed by those authors, ASAS-3 photometry of HD 148937 was obtained between 2000-2008. However, the star is in the saturation regime of the survey, and the measurements show clear evidence of saturation-related systematics. Another existing source of
pho-tometric measurements is the AAVSO4database, with 2550 points
since February 1988 reported by the Royal Astronomical Society
of New Zealand (RASNZ, Fig.6). Unfortunately, except for five
points, all values are only pre-validated; in addition, there is a gap in measurements between mid-2011 and mid-2014, an epoch of great interest in the context of this paper. Nevertheless, even if scatter is
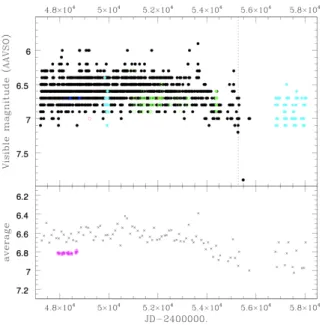
quite large, there seems to be a decline in brightness, by ∼0.2 mag, since the end of 2006 (JD=2454000). The data were obtained by 8 different observers: a single one (“JA”) is responsible for 85% of them, but another one (“WPX”) obtained all recent ones. However, the decline is also seen in the sole “JA” dataset. Given the limited quality of the existing photometry, it is clear that little can be con-cluded apart from the fact that the star has exhibited no large pho-tometric variations (i.e. greater than a few tenths of magnitudes) between 1988 and 2014. The AAVSO photometry of HD 148937 (along with the Hipparcos photometry) as a function of Julian date are illustrated in Fig.6.
In the Introduction, we speculated that the unexpected vari-ability may have its origin in the probable binarity reported bySana et al.(2014). Based on our spectroscopic monitoring, we tentatively conclude that an important component of the change in the spec-trum of HD 148937 is associated with variable distortion by a com-panion comparable in mass and luminosity to the magnetic star, in an eccentric, long-period (26 year) orbit. For the longer-period so-lution, the inferred semi-major axis and eccentricity imply a closest approach (around JD 2456991, the beginning of December 2014) of the two stars of about 9.7 AU, equal to roughly 140 times the ra-dius of a typical Of?p star. This would suggest that tidal interactions between the two components are unlikely, even at periastron. Nev-ertheless, both spectroscopy and unpublished interferometry (Sana, priv. comm.) agree that the greatest distortion of the spectrum oc-curs when the stars are physically closest to one another. We also point out that the eccentricity could potentially be larger, given that the values obtained from our fits are derived from relatively few RV points somewhat removed from the exact date of periastron pas-sage.
As pointed out byMahy et al.(2017), HD 148937 is the only
magnetic O-type star known to be surrounded by a nebula that can
be attributed to mass loss. θ1 Ori C and NGC 1624-2 have
sur-rounding nebulosities, but they are H ii regions associated with the star-forming environments of these stars. The exact formation pro-cess of this nebula raises many questions. Mahy et al. suggest that multiple epochs of nebular ejection have occurred, 1.2 − 1.3 Myr ago, and a more recent event 0.6 Myr ago. They estimate the mass of the ionized gas in the nebula to be ∼ 12.4 M , but this
esti-mate is uncertain. They discuss evolutionary scenarios in detail, but only from the perspective of a single star: a giant eruption (an LBV-like event?) triggered by the stellar wind and the mag-netic field, or a merger event between two massive stars in a binary configuration. The merger scenario focuses on explaining the mag-netic field of the secondary star, but arguments against it work for both secondary and primary. Such a merger would require that one of the two existing O-type stars would have previously been two lower-mass stars in a tight orbit, and then through subsequent stel-lar and/or dynamical evolution the stars would have merged. Given that the pre-merger masses of these stars would have been substan-tially smaller than that of the current secondary or primary, they should have been less evolved. So the mechanism by which such a merger would have occurred is unclear.
Wade et al.(2012) report that, compared to other lines of sim-ilar strength and Land´e factor, the He i λ5876 line exhibits an anomalously strong Stokes V signature. In addition, the star ap-pears to show a Stokes V profile given the star’s relatively weak magnetic field. The V profile appears to be somewhat wider than the sharper principal component of its Stokes I LSD profile (see Fig. 7 ofWade et al. 2012). It seems plausible that both of these charac-teristics could be a result of the SB2 nature of the system, with the Zeeman signature contributed by one component, but the Stokes I
profile defined by contributions of both stars. Alternatively, emis-sion might infill the blue wing of the profile. Since these spectra were obtained before the recent episode of spectral evolution be-gan, such emission would most likely be of magnetospheric origin. It will be very interesting to eventually determine the orienta-tion of the binary orbit and its relaorienta-tionship to the nebular geometry. This will help to clarify if the binary system governs the nebular geometry, and if/to what event the magnetic field may also con-tribute. We note that the derived orbital inclination is in reasonable agreement with the spectroscopic constraint that the rotational axis inclination of the magnetic star be less than about 30◦
. As a con-sequence, aligned spin and orbital axes cannot be ruled out. And it may well be that both binarity and magnetism contribute to the ob-served nebular characteristics, e.g. binarity as the origin, with the
magnetic field sculpting the “figure 8” shape described byMahy
et al.(2017). Moreover, wide-field imagery of the ISM and nebulos-ity adjacent to HD 148937 (see apod.nasa.gov/apod/ap160330.html and the analysis byRomero 2006) may be indicative of larger-scale and longer-timescale interactions of the system.
Could the (likely important) contribution of the presumably non-magnetic primary star to the spectrum be related to the sur-prising cycle-to-cycle scatter in the 7.03 d EW curves reported by
Wade et al.(2012)? If the primary star exhibits episodic mass ejec-tions (as might be inferred from the presence of the nebula), it may be stochastically variable on shorter timescales as well. More gen-erally, the presence of a bright second star similar in spectral type to the magnetic star has implications for the quantitative interpre-tation of the stellar spectrum, and of the magnetic measurements. Another, more exotic possibility is that the variability of the tospheric lines really does probe intrinsic variations of the magne-tospheric structure. In that case, ascribing the recent variability to a significant reconfiguration of the Of?p star’s magnetosphere might be plausible.However, all of this is speculation, and more detailed investigation of the spectral contributions of the two stars - before and during the 2015 event - will help to answer these questions and understand the detailed origins of the spectral evolution.
The discovery of the likely binary nature of HD 148937 is sig-nificant, as it contributes to the ongoing discussion about the rela-tionship of binarity to massive-star magnetism (e.g.Alecian et al. 2015). Nevertheless, our binary solution is not unique, and it is sub-ject to the limitations of incomplete phase coverage and limited data quality. Dedicated spectroscopic monitoring should be con-tinued, with a view to eventually observing the next periastron in either December, 2032 (shorter period) or February, 2039 (longer period). Continued interferometry should ultimately provide an in-dependent test of the orbital model proposed here, and ultimately combining interferometry and RVs should securely determine the orbital geometry and stellar masses. In addition, future spectro-scopic or spectropolarimetric monitoring covering the 7.03 d period will test if the magnetospheric configuration (and potentially more remarkably the rotational period) of the Of?p star has changed.
Simultaneously, a detailed analysis of the spectra of the com-ponents must be performed, including a fine determination of the stellar properties. This should allow evaluation if simple shifting of two spectra in velocity is sufficient to explain the observed varia-tion, or if intrinsic variability must be invoked. The magnetic and magnetospheric properties of the Of?p star should be re-evaluated taking into account the spectral contamination of the companion. Additionally, monitoring on the rotational timescale could serve as an immediate check if there has been any change in magnetospheric variability.
Figure 6. Visual magnitude measurements made by the RASNZ, with dif-ferent observers coded by different symbols. The vertical dotted line in-dicates when comparison stars were changed. The lower frame shows the same data binned in 100-day averages (in grey), along with the Hipparcos photometry (in purple).
ACKNOWLEDGMENTS
We dedicate this work to our friend and colleague Nolan R. Wal-born, who passed away during the final stages of this investigation. We thank the anonymous referee for their careful review and thoughtful comments.
This work has made use of data from the European Space
Agency (ESA) mission Gaia (https://www.cosmos.esa.int/
gaia), processed by the Gaia Data Processing and
Analy-sis Consortium (DPAC, https://www.cosmos.esa.int/web/
gaia/dpac/consortium). Funding for the DPAC has been pro-vided by national institutions, in particular the institutions partici-pating in the Gaia Multilateral Agreement.
GAW acknowledges Discovery Grant support from the Nat-ural Sciences and Engineering Research Council of Canada. YN acknowledges support from the Fonds National de la Recherche Scientifique (Belgium), the Communaut´e Franc¸aise de Belgique, and the PRODEX XMM contract. RG is Visiting Astronomer, Complejo Astron´omico de la Rep´ublica Argentina and the Na-tional Universities of La Plata, C´ordoba and San Juan. RB and JA thank the DIDULS projects PR18143 and PR16142, respec-tively. JC and AF acknowledge support from an NSERC Discov-ery Grant and a SERB Accelerator Award from Western Univer-sity. UCLES data from April 1995 was provided by Simon O Toole at AAT. We exploited data from ESO programs 075.D-0369(A), 077.D-0705(A) , 082.C-0446(B), 082.D-0136(A), 194.C-0833(D), 194.C-0833, 266.D-5655(A). The authors acknowledge the contri-bution of H. Sana, who provided helpful discussion and comments, access to unpublished interferometric results, and kind support to GAW during a research visit to KU Leuven.
REFERENCES
Alecian E., et al., 2015, in Meynet G., Georgy C., Groh J., Stee P., eds, IAU Symposium Vol. 307, New Windows on Massive Stars. pp 330–335 (arXiv:1409.1094),doi:10.1017/S1743921314007030
Bagnulo S., Jehin E., Ledoux C., Cabanac R., Melo C., Gilmozzi R., ESO Paranal Science Operations Team 2003, The Messenger,114, 10 Barb´a R. H., Gamen R., Arias J. I., Morrell N., Ma´ız Apell´aniz J., Alfaro
E., Walborn N., Sota A., 2010, in Revista Mexicana de Astronomia y Astrofisica Conference Series. pp 30–32
Barb´a R. H., Gamen R., Arias J. I., Morrell N. I., 2017, in Eldridge J. J., Bray J. C., McClelland L. A. S., Xiao L., eds, IAU Symposium Vol. 329, The Lives and Death-Throes of Massive Stars. pp 89–96, doi:10.1017/S1743921317003258
Bernstein R., Shectman S. A., Gunnels S. M., Mochnacki S., Athey A. E., 2003, in Iye M., Moorwood A. F. M., eds, Proc. SPIEVol. 4841, In-strument Design and Performance for Optical/Infrared Ground-based Telescopes. pp 1694–1704,doi:10.1117/12.461502
Conti P. S., Garmany C. D., Hutchings J. B., 1977,ApJ,215, 561 Cox N. L. J., et al., 2017,A&A,606, A76
Dekker H., D’Odorico S., Kaufer A., Delabre B., Kotzlowski H., 2000, in Iye M., Moorwood A. F., eds, Proc. SPIEVol. 4008, Optical and IR Telescope Instrumentation and Detectors. p. 534
Donati J.-F., Babel J., Harries T. J., Howarth I. D., Petit P., Semel M., 2002, MNRAS,333, 55
Ekstr¨om S., et al., 2012,A&A,537, A146
Fullerton A. W., Gies D. R., Bolton C. T., 1996,ApJS,103, 475
Georgy C., Meynet G., Ekstr¨om S., Wade G. A., Petit V., Keszthelyi Z., Hirschi R., 2017,A&A,599, L5
Grunhut J. H., et al., 2017,MNRAS,465, 2432 Harries T. J., Howarth I. D., 1996, A&A,310, 235 Hubrig S., et al., 2011,A&A,528, A151 Humphreys R. M., 1978,ApJS,38, 309
Hunter I., Smoker J. V., Keenan F. P., Ledoux C., Jehin E., Cabanac R., Melo C., Bagnulo S., 2006,MNRAS,367, 1478
Langer N., 2012,ARA&A,50, 107
Lindegren L., Hernandez J., Bombrun A., Klioner S., Bastian U., Ramos-Lerate M., de Torres A., Steidelmuller H. e. a., 2018, preprint, (arXiv:1804.09366)
Mahy L., Hutsem´ekers D., Naz´e Y., Royer P., Lebouteiller V., Waelkens C., 2017,A&A,599, A61
Mel’Nik A. M., Dambis A. K., 2009,MNRAS,400, 518
Morel T., et al., 2015, in Meynet G., Georgy C., Groh J., Stee P., eds, IAU Symposium Vol. 307, New Windows on Massive Stars. pp 342–347 (arXiv:1408.2100),doi:10.1017/S1743921314007054
Naz´e Y., Walborn N. R., Rauw G., Martins F., Pollock A. M. T., Bond H. E., 2008,AJ,135, 1946
Naz´e Y., ud-Doula A., Spano M., Rauw G., De Becker M., Walborn N. R., 2010,A&A,520, A59
Naz´e Y., Mahy L., Damerdji Y., Kobulnicky H. A., Pittard J. M., Parkin E. R., Absil O., Blomme R., 2012a,A&A,546, A37
Naz´e Y., Zhekov S. A., Walborn N. R., 2012b,ApJ,746, 142
Naz´e Y., Petit V., Rinbrand M., Cohen D., Owocki S., ud-Doula A., Wade G. A., 2014,ApJS,215, 10
Nota A., Pasquali A., Drissen L., Leitherer C., Robert C., Moffat A. F. J., Schmutz W., 1996,ApJS,102, 383
Petit V., et al., 2013,MNRAS,429, 398 Petit V., et al., 2017,MNRAS,466, 1052
Rauw G., Naz´e Y., 2016,Advances in Space Research,58, 761
Romero G. A., 2006, PhD thesis, Universidad Nacional de La Plata (Ar-gentina)
Sana H., et al., 2014,ApJS,215, 15
Silvester J., Wade G. A., Kochukhov O., Bagnulo S., Folsom C. P., Hanes D., 2012,MNRAS,426, 1003
Smoker J. V., Keenan F. P., Fox A. J., 2015,A&A,582, A59 Stibbs D. W. N., 1950, MNRAS,110, 395
Tokovinin A., 1992, in McAlister H. A., Hartkopf W. I., eds, Astronomi-cal Society of the Pacific Conference Series Vol. 32, IAU Colloq. 135: Complementary Approaches to Double and Multiple Star Research. p. 573
Wade G. A., MiMeS Collaboration 2015, in Balega Y. Y., Romanyuk I. I., Kudryavtsev D. O., eds, Astronomical Society of the Pacific
Confer-ence Series Vol. 494, Physics and Evolution of Magnetic and Related Stars. p. 30 (arXiv:1411.3604)
Wade G. A., et al., 2012,MNRAS,419, 2459 Wade G. A., et al., 2016,MNRAS,456, 2 Walborn N. R., 1972,AJ,77, 312 Walborn N. R., 1973,AJ,78, 1067 Walborn N. R., et al., 2004,ApJ,617, L61
Walborn N. R., Sota A., Ma´ız Apell´aniz J., Alfaro E. J., Morrell N. I., Barb´a R. H., Arias J. I., Gamen R. C., 2010,ApJ,711, L143
Weisskopf M. C., O’dell S. L., van Speybroeck L. P., 1996, in Hoover R. B., Walker A. B., eds, Proc. SPIEVol. 2805, Multilayer and Grazing Inci-dence X-Ray/EUV Optics III. pp 2–7,doi:10.1117/12.245079