Utilisation du nitrate, de l’acide silicique et du
phosphate pour l’estimation de la production primaire
nette et la contribution des diatomées dans l’Arctique
canadien (1997-2011)
Mémoire
Myriam Bergeron
Maîtrise en biologie
Maître ès sciences (M.Sc.)
Québec, Canada
© Myriam Bergeron, 2013
iii
Résumé
L’objectif principal de ce mémoire était d’évaluer et d’interpréter les changements interannuels dans la production primaire nette du phytoplancton et des diatomées en particulier, à partir d’un suivi temporel de la distribution verticale et de l’inventaire des nutriments dans le sud-est de la mer de Beaufort (2003-2011) et le nord de la baie de Baffin (1997-1999; 2005-2011). En mer de Beaufort, une augmentation de la consommation de nitrate était cohérente avec l’approfondissement de la nitracline par le phytoplancton du maximum sub-superficiel de chlorophylle. Pour la baie de Baffin, les résultats suggèrent une baisse de la productivité associée à une augmentation de la stratification et un mélange réduit. L’analyse des rapports de consommation pour les différents nutriments ainsi que ceux de la composition élémentaire de la matière organique particulaire indique que ces changements sont causés principalement par les diatomées en réponse aux récentes perturbations environnementales subies par l’océan Arctique.
v
Avant-propos
Le corps de mon mémoire a été écrit en anglais sous la forme d’un article scientifique. J’ai participé à l’échantillonnage et à l’analyse des nutriments en mer à l’automne 2009 et l’été 2010, le reste de la base de données m’ayant été fourni par mon directeur, Jean-Éric Tremblay. J’ai également participé à la collecte et l’analyse des échantillons de la matière organique particulaire (carbone organique particulaire (POC), azote particulaire total (TPN), silice biogénique (BioSi) et phosphore particulaire total (TPP)) et la composition taxinomique. J’ai effectué toutes les analyses et rédigé le manuscrit en entier avec les conseils de mon directeur.
Je tiens tout d’abord à remercier Jean-Éric Tremblay pour m’avoir soutenu dans la réalisation de ce projet et permis d’acquérir cette expérience inestimable, je t’en remercie énormément. Je veux aussi remercier mon codirecteur, Michel Poulin, pour son aide et ses recommandations. Je tiens à souligner la précieuse aide de mes collègues Jonathan Gagnon, Johannie Martin, Amandine Lapoussière, Mathieu Ardyna et Émilie Champagne à différentes parties du processus. Mes remerciements vont aussi à Dominique Boisvert et aux membres de l’équipage du NGCC Amundsen sans qui l’échantillonnage n’aurait pas été possible. Merci spécial à Simon Pineault pour son aide et son appui sur le terrain et tout au long du périple de ma maîtrise (une chance que j’t’ai!).
Je tiens à souligner le soutien immense et inconditionnel de mes parents, tout spécialement de ma mère, qui m’ont permis de passer à travers toutes ces étapes et m’épanouir professionnellement et personnellement. Un gros merci à mon frère et à mes ami(e)s qui m’ont épaulé et encouragé pendant tout ce temps. Finalement, je remercie Québec-Océan et ArcticNet pour leur soutien financier et logistique.
vii
Table des matières
RÉSUMÉ ... III AVANT-PROPOS ... V TABLE DES MATIÈRES ... VII LISTE DES TABLEAUX ... IX LISTE DES FIGURES ... XI
1. INTRODUCTION GÉNÉRALE ... 1
1.1.CONTEXTE DE L’ÉTUDE ... 1
1.2.CYCLE ANNUEL DE LA PRODUCTION PRIMAIRE ET IMPORTANCE DES DIATOMÉES ... 3
1.3.NUTRIMENTS ET PRODUCTION PRIMAIRE ... 4
1.4.PROBLÉMATIQUE ... 7
1.5.HYPOTHÈSES ... 9
1.5.1 Hypothèses de l’étude ... 9
1.5.2. Objectif ... 10
CHAPITRE 1. IMPACT OF BIOLOGICAL DRAWDOWN ON HORIZONTAL AND VERTICAL CHANGES IN NUTRIENT DISTRIBUTION IN THE CANADIAN ARCTIC ... 11
2.1.ABSTRACT ... 11
2.2.RÉSUMÉ ... 12
2.3.INTRODUCTION ... 13
2.4.METHODOLOGY ... 16
2.4.1. Study area and sampling... 16
2.4.2. Nutrients ... 18
2.4.3. Other measurements ... 18
2.4.4. Phytoplankton abundance and taxonomic composition ... 19
2.4.5. Data transformations and analyses ... 19
2.4.5.1. Nitrate deficit and nitracline depth ... 19
2.4.5.2 Nutrient drawdown ratios ... 21
2.4.5.3 Statistical analyses ... 21
2.5.RESULTS ... 22
2.5.1. General ... 22
2.5.2. Nitrate drawdown and nitracline depth... 22
viii
2.5.4. Taxonomic composition and POM elemental ratios ... 31
2.6.DISCUSSION ... 35
2.6.1. Interpreting estimates of nutrient drawdown: caveats and possibilities ... 36
2.6.2. Biological drawdown in the Beaufort Sea ... 38
2.6.3. Biological drawdown in Baffin Bay ... 40
2.6.4. Nutrient drawdown ratios ... 41
2.6.5. Taxonomic composition and particulate elemental ratios ... 43
2.6.6. Ecological consequences of changing new production ... 44
2.7.CONCLUSION ... 45
3. CONCLUSIONS GÉNÉRALES ... 46
4. RÉFÉRENCES BIBLIOGRAHIQUES ... 49
ix
Liste des Tableaux
Table 1.
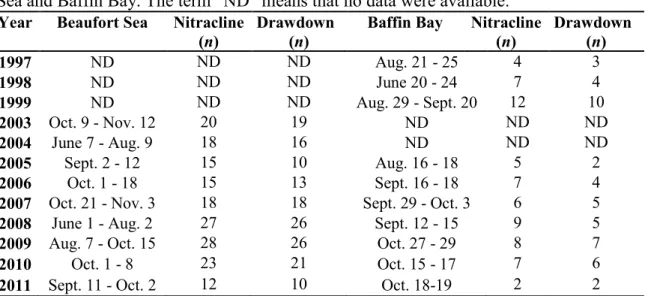
Sampling period and number of stations analyzed for nitracline depth (also salinity and halocline depth) and nitrate drawdown for Beaufort Sea and Baffin Bay. The term ―ND‖ means that no data were available………..………..………...………...17 Table 2.
Average silicate:nitrate (Si:NO3-) and nitrate:phosphate (NO3-:PO4-) consumption ratios in
the Beaufort Sea, as estimated by the residual (r) and deficit (∆) methods (see section 2.4.5.b). Standard deviation (parenthesis) indicate station variability for a specific year and inter-annual variability for the overall period...………..………29 Table 3.
Average silicate:nitrate (Si:NO3-) and nitrate:phosphate (NO3-:PO4-) consumption ratios in
Baffin Bay, as estimated by the residual (r) and deficit (∆) methods (see section 2.4.5.b). Standard deviations (parenthesis) indicate inter-station variability for a specific year and inter-annual variability for the overall period. The term ―NA‖ indicates that the estimation could not be performed reliably on a given dataset………...………..30 .
Table 4.
Relative abundance (% of total diatoms) of dominant species of the main diatom groups for the Beaufort Sea and Baffin Bay.………...……….33 Table 5.
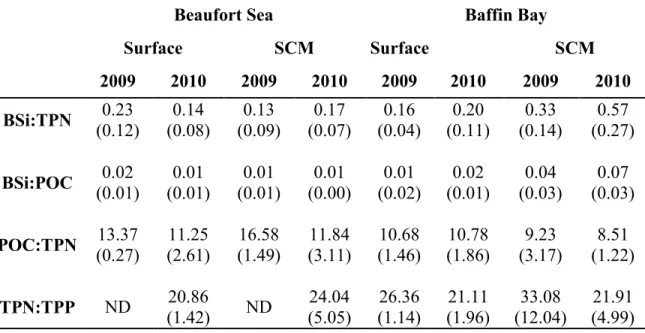
Annual mean elemental ratios biosilica:total particulate nitrate (BSi:TPN), biosilica:particulate organic carbon (BSi:POC), particulate organic carbon:total particulate nitrogen (POC:TPN) and total particulate nitrogen:total particulate phosphorus (TPN:TPP) for Beaufort Sea and Baffin Bay for stations sampled in October 2009 and August 2010 at surface and subsurface chlorophyll maximum (SCM) depths. The term ―ND‖ means that no data were available. Standard deviations (parenthesis) indicate inter-station variability for a specific year and inter-annual variability for the overall period……….……….34 Table A1.
Nutrient concentrations and salinity for the Atlantic end-member water column. Data from late winter 1998 in the West Greenland current were used………..………..58
xi
Liste des figures
Figure 1.
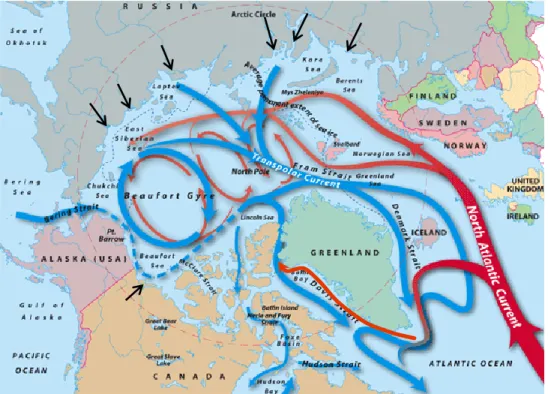
Circulation à grande échelle dans l'océan Arctique. Les courants de surface en bleu sont constitués d’eau dérivée du Pacifique et les courants en rouge d’eau dérivée de l’Atlantique. Les flèches noires indiquent les grands fleuves qui se déversent dans l’Arctique (Tirée de Jack Cook, WHOI, www.whoi.edu...2
Figure 2.
(A) Étendue moyenne annuelle d’eau libre dans l’Arctique entre 2003 et 2007 et augmentation de la production annuelle estimée de l’Arctique. (B) Production primaire par secteurs géographiques de 2007 comparée aux valeurs moyennes de 1998-2002 (Tirée d’Arrigo et al. 2008)……….………..…………...8 Figure 3.
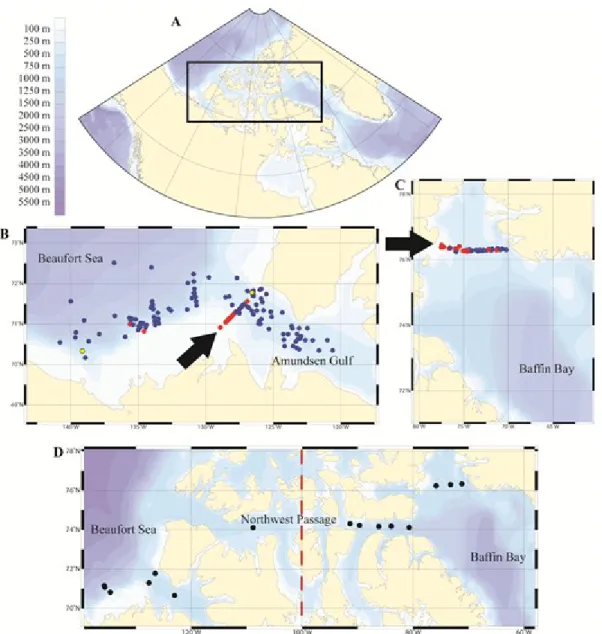
(A) Location of the study area in the Canadian Arctic. Stations of (B) the southeast Beaufort Sea and Amundsen Gulf (BS) and (C) northern Baffin Bay (BB) where detailed vertical profiles of nutrients (nitrate (NO3-), silicic acid (Si(OH)4) and phosphate (PO4-)), chlorophyll
a, temperature and salinity were obtained. Blue circles are stations where nitracline depth,
salinity, halocline depth and nitrate drawdown were calculated. Red circles are stations where nitracline depth, salinity and halocline depth only were calculated. Yellow circles are stations were only nitrate drawdown was calculated. Arrows shows the location of transects used for vertical profile maps in the results section (see Fig. 4 and 5). (D) Stations analyzed for taxonomy, chlorophyll a and particulate organic matter in 2009 and 2010 (black circles). The dashed line indicates the Beaufort Sea sector (< 100°W) and the Baffin Bay sector (> 100°W) used in the results section (see 2.5.4. section)………...6 Figure 4.
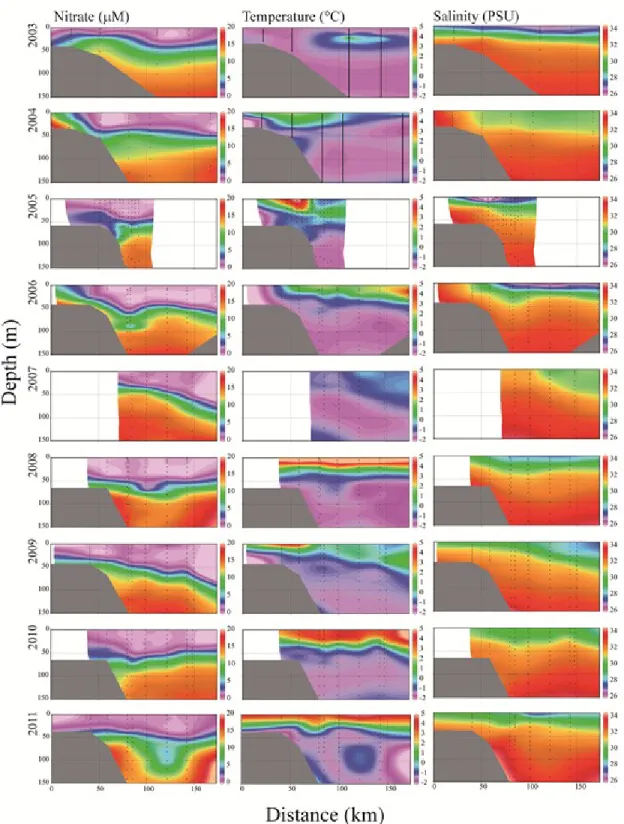
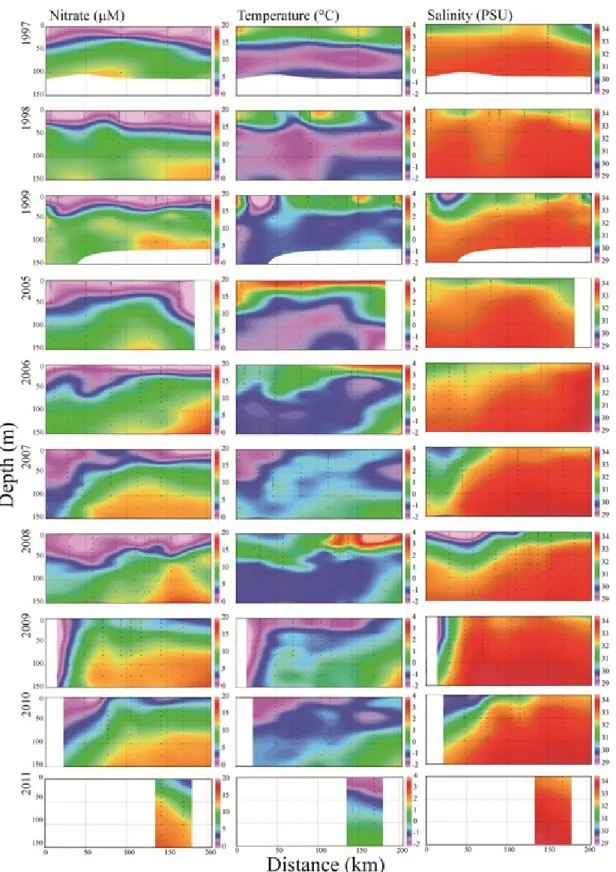
Vertical sections of nitrate concentration (M), temperature (°C) and salinity (PSU) for the Beaufort Sea transect (Fig. 3) between 2003 and 2011. Drawn with Ocean Data View 4.3.5.……….………...23 Figure 5.
Vertical sections of nitrate concentration (M), temperature (°C) and salinity (PSU) along the Baffin Bay transect (Fig. 3) for the period 1997-1999 and 2005-2011. Drawn with Ocean Data View 4.3.5………..………24 Figure 6.
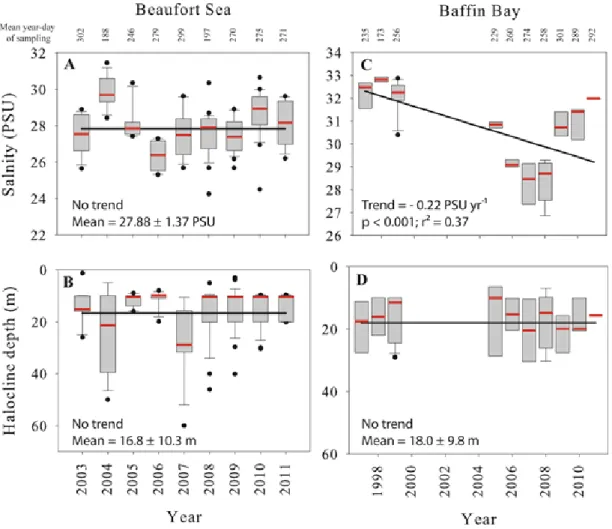
Box plots of the weighted mean salinity in the first 50 m of the water column (A and C) and the vertical position of the halocline (B and D) for the Beaufort Sea and Baffin Bay. Each box represents 50% of the observations and the dividing horizontal mark gives the median value (in red). Whiskers provide ranges for the upper and lower quartiles and circles indicate extreme values. The linear regression lines (trends) were fitted using all individual data points (not shown). Note the different vertical scales. The mean annual day of sampling is noted on the upper axis……….………..………...25
xii Figure 7.
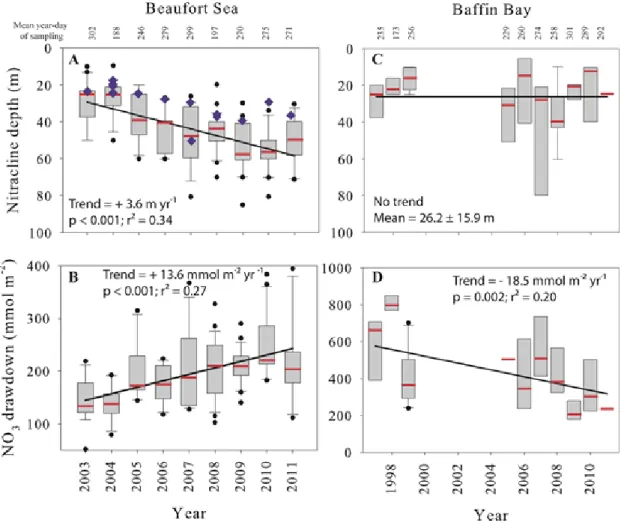
Box plots of nitracline depth (A and C) and seasonal nitrate (NO3-) drawdown (B and D) for
the Beaufort Sea and Baffin Bay. Nitracline deepening for the Amundsen Gulf polynya stations only (A; blue diamonds; + 2.5 m yr-1, p = 0.004, r2 = 0.48). Each box represents 50% of the observations and the dividing horizontal mark gives the median value (in red). Whiskers provide ranges for the upper and lower quartiles and circles indicate outliers. The linear regression lines (trends) were fitted using all individual data points (not shown). Note the different vertical scales……….……….27 Figure 8.
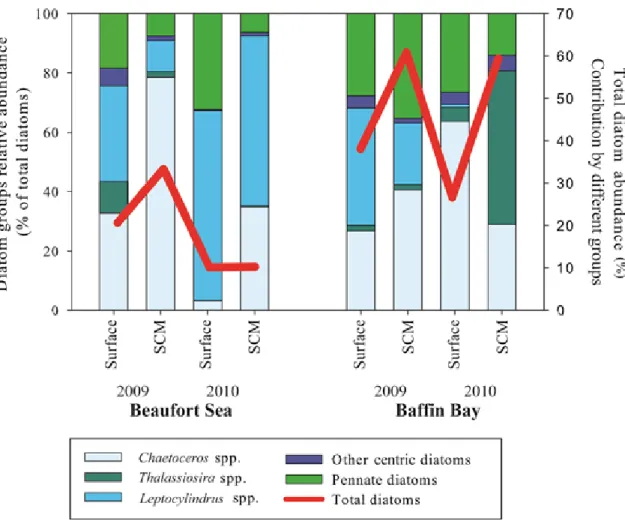
Relative abundance of dominant diatom groups (bars diagram); Chaetoceros, Thalassiosira,
Leptocylindrus, other centric diatoms (see table 4 for dominant species) and pennate diatoms
recorded at in surface waters and at the subsurface chlorophyll maximum (SCM). The relative contribution of diatoms to total cells counts is given by the solid red line.……….………...………...32 Figure 9.
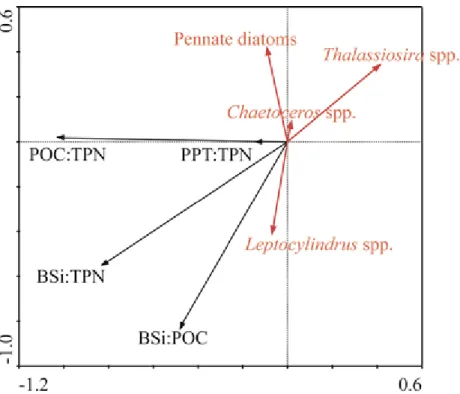
Principal component analysis of 16 stations sampled in 2009 and 2010 in the Beaufort Sea and Baffin Bay. Particular organic matter ratios (particulate organic carbon:total particulate nitrogen (POC:TPN), total particulate nitrogen:total particulate phosphorus (TPN:TPP), bioilica:total particulate nitrogen (BSi:TPN) and biosilica:particulate organic carbon (BSi:POC)) were associated with dominant diatoms groups, Thalassiosira (and/or Porosira),
Leptocylindrus, Chaetoceros and pennate diatoms.……….……….…………35
Figure A1.
Nutrient-salinity relationships in the Beaufort Sea for (A) nitrate, (B) silicic acid and (C) phosphate. The different colors are related to different salinity ranges identified and separated with dashed lines and associated with their coefficient of determination (r2) by color. Late-winter data from 2004 (Franklin Bay, CASES project) and 2008 (Amundsen Gulf, CFL project) were used………...……….………..………...57 Figure A2.
Nutrient-salinity relationships and their associated coefficient of determination (r2) and p-value (p) in northwest Baffin Bay (Pacific end-member) for (A) nitrate, (B) silicate and (C) phosphate. The dashed lines indicate the lowest winter salinity (32.56 for the three nutrients). Data from late winter 1998 (NOW project) were used……….……….…...59 Figure A3.
Nitrate:phosphate (NO3- - PO43-) relationships and their associated p-value (p) at the southern
tip of Greenland (Atlantic member, red symbols) and northwest Baffin Bay (Pacific end-member, blue symbols). Black dots represent all of our observations across different sectors of Baffin Bay ……….………...….60
1
1. Introduction générale
1.1. Contexte de l’étude
Les modélisations récentes placent l’océan Arctique parmi les régions de la planète les plus sensibles au réchauffement climatique (IPCC, 2007). La diminution de l’étendue de la glace de mer, principalement des types les plus âgés, ainsi que l’amincissement de la glace pluriannuelle ont été maintes fois démontrés (e.g. Kwok et al. 2009; Maslanik et al. 2011). Dans plusieurs régions, l’eau qui était auparavant recouverte en permanence de glace de mer est donc maintenant exposée annuellement. La saison d’eau libre s’allonge, à cause de la fonte hâtive au printemps et de la formation retardée du couvert de glace en automne (Maslanik et al. 2011), modifiant ainsi la quantité de lumière disponible pour le système (Tremblay et Gagnon, 2009). L’accroissement des températures atmosphériques entraîne aussi une augmentation substantielle des apports en eau douce due à la fonte des glaces pluriannuelles, à l’augmentation du débit des fleuves et des précipitations (Peterson et al. 2006; Rabe et al. 2011). De plus, les observations révèlent une recrudescence de l’intensité et de la fréquence des épisodes de forts vents dans l’Atlantique Nord (IPCC, 2007) et plusieurs régions de l’Arctique (Zhang et al. 2004, Wang et al. 2006).
Ces perturbations environnementales en cours dans l’Arctique auront indéniablement des effets sur les producteurs primaires, mais leur réponse demeure incertaine. La fonte de la glace de mer, l’allongement de la période de croissance et l’accroissement subséquent de la lumière disponible devraient vraisemblablement avoir un effet positif sur la photosynthèse du phytoplancton marin. Toutefois, l’augmentation des températures de surface et des apports en eau douce devraient amplifier la stratification verticale de la colonne d’eau, réduisant ainsi le flux ascendant moyen de nutriments vers la zone euphotique. Par ailleurs, l’intensification des épisodes de tempêtes et de vents forts, surtout tôt au printemps et tard à l’automne, pourrait y favoriser des apports épisodiques en nutriments (Carmack et al. 2004; Tremblay et al. 2011). Puisque la production primaire (PP) annuelle dans l’Arctique est historiquement liée à la disponibilité en nitrate dans les eaux à couvert de glace saisonnier, une augmentation durable de la PP ne pourra
2
se produire que si l’éclairement accru s’accompagne d’apports additionnels en nutriments dans la zone euphotique (Tremblay et Gagnon, 2009). Ceux-ci dépendront fortement de la façon dont les changements physiques de l’océan, de la glace et de l’atmosphère interagiront.
La circulation à grande échelle dans l’Arctique (Fig. 1) montre aussi des signes de changement. La position du front entre les eaux dérivées du Pacifique et celles de l’Atlantique subit déjà des modifications en relation avec les oscillations climatiques et le réchauffement (McLaughlin et al. 1996, 2002). La masse d’eau d’origine Atlantique, relativement chaude et salée, a pris de l’ampleur sur le plateau sibérien. L’eau dérivée du Pacifique occupe donc vraisemblablement un espace plus restreint dans le sud-ouest de l’Arctique, emportant une quantité plus importante d’eau relativement froide et peu salée vers le sud à travers l’Archipel canadien. Puisque les signatures en nutriments des deux masses d’eau sont différentes, la circulation changeante pourrait modifier le milieu de croissance des producteurs primaires.
Figure 1. Circulation à grande échelle dans l'océan Arctique. Les courants de surface en bleu sont constitués d’eau dérivée du Pacifique et les courants en rouge d’eau dérivée de l’Atlantique. Les flèches noires indiquent les grands fleuves qui se déversent dans l’Arctique (Tirée de Jack Cook, WHOI,
3
1.2. Cycle annuel de la production primaire et importance des
diatomées
La production primaire annuelle en Arctique prend place à l’intérieur d’une période relativement courte à cause des conditions polaires extrêmes. En hiver, l’absence de lumière contraint le phytoplancton à des quantités minimales et le mélange profond permet un retour important des nutriments en surface. Ainsi, l’augmentation de la lumière, le réchauffement de la couche de surface et la fonte de la glace au printemps réunissent des conditions propices à une floraison (ou bloom) phytoplanctonique très importante. L’épuisement des nutriments au début de l’été limite la production primaire près de la surface. La biomasse de phytoplancton est alors relativement basse, mais variable, entre autres à cause d’injections occasionnelles de nutriments par des tempêtes ou par des zones de remontées d’eau profonde (upwelling). L’automne peut être propice à une seconde floraison, quoique de moindre ampleur, puisque la lumière est encore suffisante et le mélange vertical est alors favorisé par les vents forts saisonniers et que la quantité de brouteurs diminue. Le moment des floraisons ainsi que leur durée et leur intensité sont variables d’une année à l’autre ainsi qu’entre les différentes régions de l’Arctique, dépendamment des caractéristiques locales et des conditions climatiques annuelles (Miller, 2004). De plus, la distribution verticale du phytoplancton marin montre très souvent un maximum sub-superficiel de chlorophylle (SCM) tout au long de la période de croissance, ce qui serait un compromis entre la limitation en nutriments à la surface et le manque de lumière en profondeur (Martin et al. 2010).
La composition taxinomique affiche une variation saisonnière et spatiale, mais les groupes dominants sont assez bien connus. Les diatomées planctoniques (Bacillariophyceae) sont très importantes pour la chaîne alimentaire herbivore des mers australes (Arrigo et al. 1999) et de l’océan Arctique (Tremblay et al. 2006), contribuant jusqu’à 94% de la chlorophylle a totale (un indice de biomasse) dans la polynie des eaux du Nord (polynie NOW) (Vidussi et al. 2004). Dans les eaux côtières de l’Arctique canadien, les diatomées constituent le plus important groupe du phytoplancton marin en période de bloom, avec une prépondérance des genres Chaetoceros Ehrenberg et
4
s’expliquerait par des taux de croissance rapides lorsque les concentrations en nutriments sont élevées au printemps. Elles sont aussi capables de se diviser à basse luminosité et d’entreposer des nutriments pour soutenir une croissance ultérieure (Miller, 2004). Plusieurs espèces de flagellés et de dinoflagellés de genres variés composent également la communauté phytoplanctonique arctique et tendent à dominer numériquement après le
bloom ou dans les eaux du large (Tremblay et al. 2009). Les flagellés dominent parfois au
début ou à la fin de la saison de croissance dans certaines régions, telles que l’ouest de la polynie NOW (Vidussi et al. 2004) ou la mer de Beaufort (Sukhanova et al. 2009). Ils tendent cependant à être associés davantage à la microhétérotrophie et à la minéralisation des éléments en surface (Michaels et Silver, 1988). Ces groupes participent donc peu à la production nette par rapport aux diatomées qui assurent un rôle principal à la base de la chaîne alimentaire arctique.
Les changements du climat Arctique auront des effets sur la composition taxinomique et la structure de la communauté phytoplanctonique marine. La température, la salinité, la disponibilité de la lumière et des nutriments peuvent avantager des espèces au détriment d’autres, ce qui pourrait modifier l’abondance relative des espèces, supprimer certaines espèces et/ou permettre l’établissement de nouvelles. Li et ses collaborateurs (2009) ont démontré que la hausse de température couplée à l’augmentation des apports en eau douce et une stratification plus importante favorisaient le picophytoplancton (˂ 2m) plutôt que le nanophytoplancton (2 à 20 m), puisque les espèces plus petites ont un net avantage lors de la présence de faibles concentrations en nutriments dû à leur rapport surface:volume plus élevé. Ces changements environnementaux pourraient donc affecter la production primaire en surface et l’exportation du carbone vers les eaux profondes.
1.3. Nutriments et production primaire
La disponibilité des nutriments dans la couche de surface est un enjeu primordial dans la réponse des producteurs primaires au réchauffement climatique. Les principaux nutriments essentiels à la croissance du phytoplancton, ou macronutriments, sont l’azote (N) et le phosphore (P), surtout présents sous la forme de nitrate (NO3-) et de phosphate
5 (PO43-). Ils sont, entre autres, des constituants essentiels des protéines et de l’ADN. Par
contre, certains nutriments vont combler les besoins spécifiques d’un groupe plus restreint d’organismes. Par exemple, le silicium (Si), retrouvé essentiellement sous la forme d’acide silicique ou silicate (Si(OH)4), est nécessaire à la synthèse des structures
siliceuses de la plupart des diatomées. Celles-ci ont alors un besoin absolu de silicium qui n’est que rarement partagé avec d’autres microalgues marines (Brzezinski, 1985), contrairement à l’azote et au phosphore. Il existe aussi une grande variabilité interspécifique quant aux besoins des diatomées en silicium, ce qui peut conduire à des différences d’un facteur 2 à 3 dans les rapports de consommation Si:N en conditions de croissance optimale (Brzezinski, 1985). Contrairement aux macronutriments, les métaux traces, principalement le fer, sont présents en concentration moins abondante dans le milieu et sont tout aussi essentiels pour le phytoplancton (Sarmiento et Gruber, 2006), mais moins susceptibles de limiter la production primaire dans l’Arctique canadien, où les apports terrigènes sont importants (Moore et al. 2004). On considère que dans la majeure partie de l’océan Arctique, incluant l’Arctique canadien, la production primaire est limitée en nitrate puisque ce nutriment est le premier à être épuisé lors des blooms (Tremblay et al. 2008; Mundy et al. 2009).
La répartition des nutriments dans l’Arctique canadien est influencée par plusieurs phénomènes physiques opérant dans un large cadre spatio-temporel. Leur répartition horizontale est principalement modulée par les apports des cours d’eau et les courants marins des océans Atlantique et Pacifique (voir circulation de surface à grande échelle, Figure 1). Leur répartition verticale est quant à elle influencée par les vents, le mélange par convection et les zones d’upwelling. Ces facteurs modifieront la stratification verticale de manière intermittente ou sur une base annuelle, permettant ainsi d’enrichir les eaux de surface en nutriments (Sarmiento et Gruber, 2006).
La production primaire totale est composée de la production nouvelle, ou nette, et de la production régénérée. La PP nouvelle représente la portion de la production primaire totale qui dépend des apports de nutriments allochtones, principalement sous la forme de nitrate. Les apports proviennent surtout de la circulation à grande échelle et des
6
remontées des profondeurs. La PP nette, laquelle est égale à la PP nouvelle, est la quantité d’énergie accumulée par le phytoplancton qui peut être transférée aux niveaux trophiques supérieurs. La PP régénérée, quant à elle, dépend du recyclage in situ de l’azote principalement sous forme d’ammonium (NH4+), mais aussi d’urée et d’acides
aminées. La PP régénérée ne stimule donc pas la productivité nette; il est par conséquent important de suivre la PP nouvelle pour suivre la réponse des producteurs primaires aux changements climatiques.
Les diatomées sont les principales espèces responsables de la PP nouvelle en plus d’être un vecteur capital de l’exportation verticale du carbone (C) dans l’Arctique (Tremblay et al. 2006). Il est possible d’utiliser des mesures de silice biogénique dans des trappes à sédiments afin d’estimer la production saisonnière des diatomées (Tremblay et al. 2006), puisque les structures siliceuses sont peu susceptibles à la dégradation en surface. La consommation d’azote, de phosphore et de carbone est liée à tous les groupes du phytoplancton et aux conditions du milieu (e.g. disponibilité en azote, lumière, photopériode, température; Brzezinski, 1985; Tremblay et Smith, 2007), étant donné que leur métabolisme est étroitement lié à la photosynthèse (Martin-Jézéquel et al. 2000). La consommation d’acide silicique par les diatomées requiert quant à elle de l’énergie provenant de la respiration (Claquin et al. 2002), impliquant un découplage entre ce métabolisme et celui des nutriments métabolisés dans le processus de la photosynthèse.
Les nutriments peuvent alors être utilisés comme outil pour évaluer et suivre la PP nouvelle et la contribution des diatomées à cette production durant la saison de croissance, pourvu qu’on connaisse les rapports de consommation Si:N et Si:C des communautés phytoplanctoniques dans la zone d’étude. Les rapports particulaires des diatomées Si:N et Si:P seront différents des rapports de consommation du phytoplancton total à cause de la ségrégation partielle entre le métabolisme de l’acide silicique et des autres nutriments essentiels. Le couplage incomplet entre le métabolisme des éléments nutritifs et celui du carbone conduit aussi à des rapports de composition Si:C, N:C et P:C variables et différents chez les diatomées (Brzezinski, 1985; Martin-Jézéquel et al. 2000). La production primaire totale devrait donc répondre aux variations de l’intensité
7 lumineuse et des apports en azote, tandis que la contribution des diatomées à cette production et les rapports de consommation devraient répondre aux facteurs qui affectent les diatomées en particulier (ex. : apports en silicium).
1.4. Problématique
La réponse des producteurs primaires aux récents changements dans l’Arctique demeure incertaine et les connaissances actuelles reposent surtout sur des estimations basées sur la télédétection lesquelles contiennent des incertitudes importantes. Des effets positifs à court terme du réchauffement dans l’Arctique et de la diminution du couvert de glace sur la production primaire ont été mis en évidence par la télédétection. Arrigo et ses collaborateurs (2008) ont observé une augmentation de 30% de la PP en moyenne sur l’ensemble de l’Arctique (Figure 2A). À l’échelle régionale, la réponse est variable, souvent positive et parfois négative (mer de Beaufort, Groenland) (Figure 2B). La télédétection est la seule approche qui permette d’évaluer les changements à grande échelle et de manière synoptique pour les différentes régions. Toutefois, elle ne permet pas de quantifier la production primaire pélagique qui survient au printemps sous la glace (Arrigo et al. 2012) et les algorithmes actuels ne prennent pas en compte le SCM (Martin et al. 2010) qui peut contribuer jusqu’à 70% de la production primaire en mer de Beaufort (Arrigo and van Dijken, 2011). Cette approche ne peut pas non plus faire de distinction entre la PP nouvelle et la PP régénérée, ni quantifier la contribution des diatomées. Enfin, la télédétection ne permet pas d’identifier les causes exactes des changements observés en surface qui pourraient être reliés aux apports nutritifs ou à l’éclairement. Dans ce contexte, la véracité et la portée des changements observés en surface par la télédétection doivent être évaluées au moyen d’une approche in situ permettant d’intégrer la PP nouvelle saisonnière et la contribution des diatomées à cette production au fil des ans.
Les connaissances actuelles sur les fluctuations spatio-temporelles des rapports de consommation et la stœchiométrie de la matière organique en suspension (rapports C:N:P:Si) sont limitées en Arctique. Elles sont cependant essentielles pour le suivi de la
8
PP nette et de la contribution des diatomées en utilisant les déficits saisonniers en nutriments.
Figure 2. (A) Étendue moyenne annuelle d’eau libre dans l’Arctique entre 2003 et 2007 et augmentation de la production annuelle estimée de l’Arctique. (B) Production primaire par secteurs géographiques de 2007 comparée aux valeurs moyennes de 1998-2002 (Tirée d’Arrigo et al. 2008).
Afin d’étudier ces questions, deux régions contrastées ont été ciblées, soit la mer de Beaufort et la baie de Baffin. À l’ouest de l’Arctique canadien, les eaux de surface de la mer de Beaufort sont approvisionnées par les eaux du Pacifique, riches en phosphate et en silicate, circulant par le détroit de Béring (Simpson et al. 2008). Le fleuve Mackenzie approvisionne aussi cette région en nutriments inorganiques, principalement en silicate, mais les nutriments sont majoritairement consommés en surface et en périphérie de l’estuaire (Emmerton et al. 2008; Tremblay et Gagnon, 2009). Les eaux douces
9 transportées par le fleuve se mélangent cependant dans la couche de surface de la mer de Beaufort, provoquant ainsi une dilution des nutriments et une salinité plus faible (Simpson et al. 2008) relativement à l’eau Pacifique. La mer de Beaufort montre donc une stratification de la colonne d’eau très prononcée et des rapports Si:N dissous élevés (autour de 2) avant la saison de croissance (Tremblay et al. 2002b). À l’est de l’Arctique canadien dans la baie de Baffin, la distribution des nutriments est surtout influencée par la circulation océanique. Les eaux riches en PO43- et en Si(OH)4 du Pacifique traversent
en partie l’Archipel canadien et demeurent du côté ouest de la baie de Baffin, alors que les eaux Atlantiques, relativement plus salées, pauvres en PO43- et en Si(OH)4 mais riches
en NO3- (Garneau et al. 2007) remontent à l’est le long du Groenland. La répartition du
silicate et du phosphate dissous comporte ainsi un fort gradient décroissant d’ouest en est, alors que la répartition du nitrate demeure semblable, montrant un épuisement complet en surface durant l’été (Tremblay et al. 2002a). La baie de Baffin offre donc un gradient de conditions, en plus d’être un environnement beaucoup moins stratifié et ayant un rapport Si:N dissous faible (près de 1) avant la saison de croissance (Tremblay et al. 2002b). De plus, les rapports de consommation saisonniers n’ont été calculés que pour 1998 en baie de Baffin (~1; Tremblay et al. 2002a) et que pour 2004 en mer de Beaufort (~1.75; Simpson et al. 2008).
L’approche générale de cette étude consistera en l’exploitation d’une base de données in
situ couvrant la période 1997-2011 ainsi que l’utilisation de mesures expérimentales et
d’analyses taxinomiques afin d’étudier la présence de changements dans la répartition et l’utilisation des nutriments par le phytoplancton marin.
1.5. Hypothèses
1.5.1 Hypothèses de l’étude
Les hypothèses suivantes ont été suggérées pour guider ce projet :
1. La consommation saisonnière de nitrate en baie de Baffin est plus importante qu’en mer de Beaufort. Puisque cette dernière est très stratifiée, le mélange
10
vertical qui ramène les nutriments à la surface est beaucoup plus limité qu’en mer de Baffin.
2. La consommation totale de nitrate pendant la saison de croissance augmente au fil des ans dans toutes les régions étudiées de l’Arctique, tel que suggéré par les études de télédétection.
3. Le rapport de consommation Si:NO3 demeure constant au fil des ans dans les
deux régions étudiées, impliquant une contribution constante des diatomées à la PP et à la matière organique particulaire (POM). Les calculs de la présente étude permettront de vérifier si les valeurs sont constantes dans le temps et si elles sont systématiquement différentes entre les deux régions. Pour tenter de mieux comprendre les variations spatiales de la stœchiométrie de la matière particulaire, les rapports Si:N de la matière particulaire et la composition taxinomique des diatomées ont été analysés en 2009 et en 2010.
1.5.2. Objectif
L’objectif de ce projet consiste d’abord à prolonger (2009-2010) et exploiter la base de données existantes de nutriments afin d’examiner les changements dans leur répartition à la fin de l’été et au début de l’automne, leur consommation par le phytoplancton ainsi que dans les rapports de consommation Si:N et N:P pour les deux régions visées, de 1997 à 2011 pour la baie de Baffin et de 2003 à 2011 pour la mer de Beaufort. La partie de la colonne d’eau où se situe la croissance des producteurs primaires (0 à 150 m) est principalement ciblée pour les analyses. Les résultats seront alors mis en relation avec les paramètres physiques du milieu, tels que la stratification, la salinité, la température de l’eau, les épisodes d’upwelling, la couverture de glace ainsi que la longueur de la saison de croissance pour tenter d’expliquer les changements dans la répartition et la consommation des nutriments, tout en comparant la mer de Beaufort et la baie de Baffin. Les données physiques ont été obtenues par de proches collaborateurs, notamment les professeurs Yves Gratton de l’Institut national de la recherche scientifique (INRS) et David Barber de l’Université du Manitoba. Les rapports Si:C:N:P de la matière particulaire en surface et au maximum sub-superficiel de chlorophylle seront également
11 examinés pour déterminer si ceux-ci varient en fonction de la composition taxinomique et de la région.
Chapitre 1. Impact of biological drawdown on horizontal
and vertical changes in nutrient distribution in the Canadian
Arctic
2.1. Abstract
The response of primary producers to recent environmental changes in the Arctic Ocean remains unclear since current knowledge is based mostly on remote-sensing estimates that contain large uncertainties with respect to the contribution of the subsurface chlorophyll maximum (SCM) and under-ice algal blooms to primary production (PP). Here the distribution, stoichiometry and seasonal drawdown of nitrate (NO3-), silicic acid
(Si(OH)4) and phosphate (PO43-) were studied in relation with biological and physical
parameters (taxonomic composition, salinity, temperature) in two contrasted regions of the Canadian Arctic: the Amundsen Gulf in the southeastern Beaufort Sea (2003-2011) and northern Baffin Bay (1997-1999; 2005-2011). A significant deepening of the nitracline of 3.6 m yr-1 and an increase in seasonal nitrate drawdown of 13.6 mmol m-2 yr
-1 are observed in the Beaufort Sea. The lack of concomitant changes in surface salinity
and halocline depth implies that SCM consumed nutrients over a larger extent of the water column, presumably due to greater light availability. Nutrient consumption ratios and their relative stability over time (mean Si:NO3- = 1.68 ± 0.30 and NO3-:PO43- = 10.57
± 2.77) indicate that diatoms dominate new production during the bloom period and account for the increased net productivity. For Baffin Bay, the results imply a downward shift of new and diatom PP, suggesting that the region is becoming oligotrophic due to increasing stratification and reduced vertical mixing. Nitracline depth showed no significant trends, but exceptionally deep values were observed in 2007, which was the record-low of sea-ice extent in the high Arctic. The depth of the halocline did not change appreciably, but a decrease in surface salinity of 0.22 PSU yr-1 was observed. Nitrate drawdown decreased by 18.5 mmol m-2 yr-1, with very low values for 2009-2011, while
12
consumption ratios showed no trend (Si:NO3- = 1.11 ± 0.40 and NO3-:PO43- = 14.62 ±
4.45). The taxonomic composition and abundance of diatoms had an impact on the elemental composition of particulate organic matter in the two contrasted Arctic regions.
2.2. Résumé
La réponse des producteurs primaires aux récents changements environnementaux de l’océan Arctique demeure incertaine puisque les estimations actuelles sont principalement basées sur des données satellitaires lesquelles contiennent des incertitudes importantes quant à la contribution à la production primaire (PP) du maximum sub-superficiel de chlorophylle (SCM) et des floraisons d’algues sous la glace au printemps. Ici, la distribution, la stœchiométrie et la consommation biologique du nitrate (NO3-), de
l’acide silicique (Si(OH)4) et du phosphate (PO43-) ont été étudiées et mises en relation
avec des paramètres biologiques (composition taxinomique) et physiques (salinité, température) de deux régions contrastées de l’Arctique canadien : le golfe d’Amundsen dans le sud-est de la mer de Beaufort (2003-2011) et le nord de la baie de Baffin (1997-1999; 2005-2011). Un approfondissement de la nitracline de 3.6 m an-1 et une augmentation de la consommation biologique du NO3- de 13.6 mmol m-2 an-1 ont été
observés en mer de Beaufort. L’absence de changement concomitant de la salinité de surface et de la profondeur de l’halocline implique que les algues du SCM ont consommé les nutriments sur une plus grande part de la colonne d’eau, probablement dû à une disponibilité accrue en lumière. Les rapports de consommation et leur stabilité relative sur la période (Si:NO3- = 1.68 ± 0.30 et NO3-:PO43- = 10.57 ± 2.77) indiquent que les
diatomées dominent la production nouvelle pendant la floraison et sont importantes dans l’accroissement de la productivité. Pour la baie de Baffin, les résultats montrent un déclin de la production nouvelle et de la PP des diatomées, ce qui suggère que la région deviendrait oligotrophe avec une stratification plus prononcée et un mélange vertical réduit. La profondeur de la nitracline n’a montré aucune tendance, mais des valeurs exceptionnellement profondes ont été observées en 2007, correspondant à l’année record de faible étendue de glace de mer en Arctique. La profondeur de l’halocline n’a pas subi de changements appréciables, mais une diminution de la salinité de surface de 0,22 PSU
13 an-1 a été observée. La consommation de NO3- a diminué de 18,5 mmol m-2 an-1, avec des
valeurs très basses pour 2009-2011, et les rapports de consommation n’ont montré aucune tendance (Si:NO3- = 1.11 ± 0.40 et NO3-:PO43- = 14.62 ± 4.45). La composition
taxinomique et l’abondance des diatomées ont influencé les rapports élémentaires de la matière organique particulaire dans les deux régions contrastées de l’Arctique.
2.3. Introduction
The recent physical changes experienced by the Arctic Ocean are susceptible to affect primary production (PP) through changes in the availability of light and nutrients. On the one hand, the declining extent and thickness of sea-ice, particularly for oldest types (Kwok et al. 2009; Maslanik et al. 2011) and the lengthening of the ice-free season caused by early melt and late freeze-up (Markus et al. 2009; Maslanik et al. 2011) augment the penetration of light into the water column, which is expected to stimulate primary production. On the other hand, recent warming led to a substantial increase in the freshwater content of the upper ocean, through multi-year ice melt and enhanced river discharge and precipitations (Peterson et al. 2006, Rabe et al. 2011), strengthening vertical stratification and reducing the upward flux of essential algal nutrients. While this change is likely to constrain PP on average, the increasing strength and frequency of cyclonic wind activity over the North Atlantic (IPCC, 2007) and several regions of the Arctic (Zhang et al. 2004; Wang et al. 2006) could increase the nutrient supply and augment PP in specific regions (Carmack et al. 2004; Tremblay et al. 2011).
Current assessments of the PP response to those physical changes are based on remote-sensing approaches. Using these techniques, Arrigo and van Dijken (2011) estimated an increase of 20% in overall Arctic PP between 1998 and 2009 (+ 8.1 Tg C yr-1). Regional estimates vary widely on an areal basis (range = 71.3-121 g C m-2 y-1), ranging from a possible decline in the Greenland Sea to an increase in the Laptev and Siberian seas (Arrigo et al. 2008; Arrigo and van Dijken, 2011). However, the uncertainties attached to these estimates are presumably as large as the trends due to undetected PP under the ice as well as errors in the estimation of chlorophyll a and its vertical distribution in open
14
waters (Martin et al. 2010). Massive phytoplankton blooms have been observed under first-year sea ice in the Canadian Arctic and the Chukchi Sea (Fortier et al. 2002; Arrigo et al. 2012), causing serious underestimates of PP that may reach an order of magnitude on the Chukchi Sea continental shelf (Arrigo et al. 2012). The importance of the subsurface chlorophyll maximum (SCM) in several regions of the Arctic also causes underestimates of PP, whose amplitude depends on season, region and estimation method (Hill et al. 2013; Arrigo and van Dijken, 2011).
The validation of PP trends reported by remote sensing is hindered by the paucity of annual PP estimates based on in situ data. In this regard, comparison of vertical nutrient distributions between the winter and the end of the growth period can provide time-integrated estimates of new or net PP that include the components of PP taking place under the ice and in the SCM (e.g. Tremblay et al. 2008, Codispoti et al., in press). New production is the portion of total PP depending on allochtonous nutrient supply, mainly under the form of nitrate (NO3-) supplied from deep waters (Dugdale and Goering, 1967).
NO3- has a particular importance because it limits overall primary production in the
Arctic (Tremblay and Gagnon 2009). By addressing changes in new PP, nutrient-based estimates of PP also estimate the fraction of PP which can accumulate in the biomass of consumers or be exported to the deep ocean (Eppley and Peterson, 1979) thereby contributing to the biological CO2 pump.
Diatoms are known to be major contributors of phytoplankton production and biomass (Vidussi et al. 2004; Arrigo et al. 2011) and new production (Tremblay et al. 2006; 2008). Silicic acid, or silicate (Si(OH)4; hereafter referred as Si) is an essential nutrient
for diatoms (Brzezinski, 1985). Nitrate and phosphate (PO43-) consumption is related to
all phytoplankton groups implying that Si:NO3-:PO43- elemental consumption ratios can
provide information on the relative contribution of diatoms to total seasonal new production. Diatom assemblage composition could also influence these ratios, since under optimal growth conditions diatoms exhibit interspecific differences of 2-3 fold in silicium:nitrogen (Si:N) (Brzezinski, 1985). Flagellates are also known to dominate the phytoplankton in the North Water (NOW) polynya (Vidussi et al. 2004) and the Beaufort
15 Sea (Sukhanova et al. 2009) in the beginning or the end of the growth season, but they are prevalently associated with microheterotrophy and mineralization (Michaels and Silver, 1988).
To consider the response of PP to recent physical changes in the Arctic, we selected two contrasted regions of the Canadian Arctic, i.e. the southeast Beaufort Sea and Amundsen Gulf (BS) and northern Baffin Bay (BB). The offshore BS is considered to be oligotrophic (Ardyna et al. 2011). Surface waters are derived from the Pacific Ocean and are relatively fresh and rich in phosphate and silicate. Near the coast, the Mackenzie River supplies nutrients and freshwater. Recent studies have shown that river nutrients are used very close to shore, but that the freshwater propagates off the shelf where it contributes to the strong vertical stratification (Simpson et al. 2008; Emmerton et al. 2008; Yamamoto-Kawai et al. 2009). By contrast, BB is considered as eutrophic (Ardyna et al. 2011) with strong gradients in the contribution of Atlantic- vs. Pacific-derived water. In western BB, the surface layer contains Pacific-derived water that passed through the Canadian Archipelago and/or the central Arctic and has characteristics similar to those of the BS. Eastern BB comprises a large fraction of Atlantic-derived water (i.e. Baffin Bay Water), relatively rich in NO3-, salty and warm (Tremblay et al.
2002a). The Si:N ratio prior to the growth season is relatively low in Baffin Bay Water (~ 1; Tremblay et al. 2002a) relative to Pacific-derived waters in eastern BB and the BS (~ 2; Simpson et al. 2008; Tremblay et al. 2002b).
We hypothesized that (1) total nitrate drawdown is higher in BB because of its relatively low stratification relative to BS, (2) NO3- consumption increased with time in the two
regions, consistent with remote-sensing estimates, and (3) consumption ratios stayed constant over the period studied, reflecting a stable contribution of diatoms to PP and particulate organic matter. In order to interpret consumption ratios we also assessed the taxonomic composition of phytoplankton communities and the elemental composition of particulate organic matter (POM). The main objective was to report on the vertical distributions and inventories of nitrate during autumn and infer the presence/absence of inter-annual changes in new PP and nutrient consumption ratios in those two regions.
16
2.4. Methodology
2.4.1. Study area and sampling
Figure 3. (A) Location of the study area in the Canadian Arctic. Stations of (B) the southeast Beaufort Sea and Amundsen Gulf (BS) and (C) northern Baffin Bay (BB) where detailed vertical profiles of nutrients (nitrate (NO3-), silicic acid (Si(OH)4) and phosphate (PO4-)), chlorophyll a, temperature and salinity were
obtained. Blue circles are stations where nitracline depth, salinity, halocline depth and nitrate drawdown were calculated. Red circles are stations where nitracline depth, salinity and halocline depth only were calculated. Yellow circles are stations were only nitrate drawdown was calculated. Arrows shows the location of transects used for vertical profile maps in the results section (see Fig. 4 and 5). (D) Stations analyzed for taxonomy, chlorophyll a and particulate organic matter in 2009 and 2010 (black circles). The
17
dashed line indicates the Beaufort Sea sector (< 100°W) and the Baffin Bay sector (> 100°W) used in the results section (see 2.5.4. section).
The database used includes different projects for the period 2003-2011 in the Beaufort Sea (Canadian Arctic Shelf Study CASES, Circumpolar Flaw Lead System Study CFL, ArcticNet) and 1997-1999 (International North Water Study NOW), and 2005-2011 (ArcticNet) in Baffin Bay. Sampling generally targeted the end of the growth period (Table 1) but logistical constraints made it impractical to visit the same locations on the same date each year. Stations located near rivers were excluded, however, we analyzed 15 shallow stations (less than 75 m deep), which showed vertical profiles of nutrients and salinity similar to deeper stations.
Table 1. Sampling period and number of stations analyzed for nitracline depth, salinity
and halocline depth (Nitracline (n)) and nitrate drawdown (Drawdown (n)) for Beaufort Sea and Baffin Bay. The term ―ND‖ means that no data were available.
Year Beaufort Sea Nitracline
(n)
Drawdown (n)
Baffin Bay Nitracline
(n) Drawdown (n) 1997 ND ND ND Aug. 21 - 25 4 3 1998 ND ND ND June 20 - 24 7 4 1999 ND ND ND Aug. 29 - Sept. 20 12 10 2003 Oct. 9 - Nov. 12 20 19 ND ND ND 2004 June 7 - Aug. 9 18 16 ND ND ND 2005 Sept. 2 - 12 15 10 Aug. 16 - 18 5 2 2006 Oct. 1 - 18 15 13 Sept. 16 - 18 7 4
2007 Oct. 21 - Nov. 3 18 18 Sept. 29 - Oct. 3 6 5
2008 June 1 - Aug. 2 27 26 Sept. 12 - 15 9 5
2009 Aug. 7 - Oct. 15 28 26 Oct. 27 - 29 8 7
2010 Oct. 1 - 8 23 21 Oct. 15 - 17 7 6
2011 Sept. 11 - Oct. 2 12 10 Oct. 18-19 2 2
Vertical profiles were obtained with a rosette equipped with 24 12-L Niskin bottles (10-L bottles for 1997-1999 sampling), a CTD (Sea-Bird SBE-911 plus) and a chlorophyll fluorometer (Sea-Point). Water samples for nutrient concentration determination (NO3-,
Si(OH)4 and PO4-) were collected at different standard depth (1997-1999, Tremblay et al.
2002a; 2003-2004, Tremblay et al. 2008; 2005-2010, Martin et al. 2010) covering the entire water column, with a higher resolution in the surface layer (~0-100 m). Chlorophyll a (chl a) measurements were obtained with the fluorometric method (Parsons et al. 1984) and used a posteriori to calibrate the Sea-Point fluorometer.
18
During the October 2009 and August 2010 expeditions, additional samples from the surface (~ 5 m) and the SCM were taken at 15 stations (Fig. 3, red circles; 9 stations in 2009 and 6 in 2010) to assess the taxonomic composition of phytoplankton communities and the elemental composition of the particulate organic matter (POM), including biogenic silica (BioSi), particulate organic carbon (POC) as well as total particulate phosphorus (TPP) and nitrogen (TPN). Even with the large study area and the few stations available, two phytoplankton community types were determined, separated in the Beaufort Sea sector (< 100°W) and the Baffin Bay sector (> 100°W).
2.4.2. Nutrients
Samples for nutrient determination were collected into acid-washed 15-mL polyethylene tubes after a filtration through a GF/F filter inserted in a filter holder to remove large particles (1997-1999 and 2003-2008 samples were filtered on 5.0 m polycarbonate filters). Samples were stored at 4ºC in the dark and analyzed within a few hours using standard colorimetric methods (Grasshoff et al. 1999) adapted for the Autoanalyzer3 (Bran+Luebbe) after 2002 (Tremblay et al. 2008). For the period 1997-1999, nutrient analyses were performed on an ALPKEM analyzer (Tremblay et al. 2002a).
2.4.3. Other measurements
Samples for BioSi determination were collected on 0.8-m polycarbonate filters and frozen at -20ºC. Filters were thawed in the laboratory and submitted to the alkaline hydrolysis method of Paashe (1980). The hydrolyzate was analyzed for Si(OH)4 with the
Autoanalyzer3 (see above). Samples for POC and TPN were collected on pre-combusted Whatman GF/F filters, desiccated at 60ºC and analyzed simultaneously with a mass spectrometer (Thermo Finnigan Delta Plus Advantage) coupled to a CHN elemental analyzer (Costech ECS-4010). Samples for TPP determination were filtered on pre-combusted Whatman filters, desiccated and oxidized using the method of Solorzano and Sharp (1980). Oxydized phosphorus (as PO43-) was analyzed with the Autoanalyser 3 (see
19
2.4.4. Phytoplankton abundance and taxonomic composition
Samples for the identification and enumeration of phytoplankton were preserved with acidic Lugol’s solution (Parsons et al. 1984). After a pre-concentration step in settling chambers, a minimum of 400 cells per sample were counted and identified to the lowest possible taxonomic rank using an inverted microscope (Axiovert 10 Zeiss) equipped with phase contrast optics (Lund et al. 1958). The main references used for identification were Thomas (1997) and Bérard-Therriault et al. (1999).
2.4.5. Data transformations and analyses
2.4.5.1. Nitrate deficit and nitracline depth
The NO3- drawdown was estimated by calculating the difference between measured
nitrate concentrations and those expected in the absence of biological drawdown. Regional nutrient-salinity (N-S) relationships based on late winter data were used to generate expected nitrate concentrations from the observed salinity profile at the time of sampling (Tremblay et al. 2008) since this property is conservative (i.e. not modified by biological processes). The difference between the vertically-integrated observed and expected concentrations was estimated above the depth were the two profiles intersected to avoid deeper mineralization.
For the Beaufort Sea, N-S relationships were established with late winter data from 2004 (Franklin Bay, CASES project) and 2008 (Amundsen Gulf, CFL project) (Fig. A1). The relationships were consistent for the two years, implying no fundamental change in winter properties during this period. We observed different linear relationships related to three depth/salinity ranges, from 31.64 (the lowest observed winter salinity) to 33.02 PSU, followed by 33.02 - 34.50 PSU and the deep layer with salinities ˃ 34.50 PSU. For Si and PO43-, the salinity ranges were roughly the same (see Fig. A1). These N-S
relationships were used to reconstruct expected nutrient profiles from observed salinity data. In the upper layer, a correction for the effect of freshwater inputs (e.g. ice melt) was performed by assuming conservative dilution when salinity dropped below the minimum
20
winter value. We also excluded shallow stations of the Amundsen Gulf to exclude the effect of upwelling, which could ―mask‖ a part of the seasonal deficit.
In Baffin Bay, N-S relationships could not be used directly due to the mixing of Pacific-derived water and Atlantic-Pacific-derived water, whose end-members have different late-winter N-S relationships. The first step was to calculate two expected nutrient concentrations based on N-S relationships established during late winter 1998, one for the Atlantic end-member (data from West Greenland Current, Table A1 in appendix) and another for the Pacific end-member (data from northwest Baffin Bay, Fig. A2 in appendix) (see also Tremblay et al. 2002a). Late-winter data for the Atlantic end-member showed nearly constant nutrient concentrations with salinity instead of regressions, so that only one mean value was used as the expected concentration. Conservative dilution was also assumed when salinity dropped below the minimum winter value. The second step was to compute water mass fractions from the observed concentrations of NO3- and PO4
3-following the approach of Jones et al. (2003). The NO3--PO43- relationships were obtained
using winter data from Atlantic and Pacific end-members (see Fig. A3 in appendix). The Pacific water fraction was calculated for each sample with the following equation,
% Pacific water = 100 * (batl + (aatl*[PO43-]) - [NO3-] ___
(batl – bpac) + ([PO43-]*(aatl – apac))
where aatl and batl are the slope and the intercept for the Atlantic end-member NO3--PO4
3-relationship and apac and bpac are the slope and intercept for the Pacific end-member
relationship. [NO3-] and [PO43-] are the observed nitrate and phosphate concentration in
the Baffin Bay samples. With this approach, a unique solution is possible as long as the two end-member regression lines do not intersect.
A simple mixing model was then used to estimate expected concentrations. The expected nutrient profiles were validated with observed early spring profiles from the NOW project in 1998. The agreement was good for nitrate, but sometimes less strong for silicate and phosphate.
21 The vertical positions of the nitracline and of the halocline were determined as the depths where the vertical gradients in nitrate concentration (dNO3/dz) and salinity (dsalinity/dz)
were the highest, respectively. We used weighted averages (i.e. vertical integral divided by depth) of salinity in the 0 – 50 m layer to compare this property between years.
2.4.5.2 Nutrient drawdown ratios
Two different methods were used to estimate nutrient consumption ratios at each station. In the first method, the seasonal silicate and phosphate drawdowns were estimated separately (following the same procedures used for nitrate drawdown) prior to the calculation of so-called ―deficit‖ ratios (hereafter labeled ∆Si:∆NO3- and ∆NO3-:∆PO43-).
In the second method, so-called ―residual‖ ratios (hereafter labeled rSi:NO3- and rNO3
-:PO43-) were estimated directly from the regression slope of observed nutrient-nutrient
relationships at the time of sampling (0-100 m; see Tremblay et al. 2002a). The rationale for comparing these semi-independent methods is that neither is perfect; the ―deficit‖ method is susceptible to errors in estimated late-winter concentrations, mostly for silicate and phosphate in BB, while the ―residual‖ method is partly pre-conditioned by leftover nutrients from the previous winter at the deepest depths.
2.4.5.3 Statistical analyses
Prior to statistical analyses, all variables were tested for normality and homoscedasticity, using Shapiro-Wilk test and residual diagrams, respectively. The linear (model 1) least-square regressions were used to determine predictive relationship, and were carried out using SigmaPlot 11. Type 3 analyses of variance (ANOVA mixed models) were used to assess the difference between years, geographic regions (e.g., eastern and western Baffin Bay) and to test the effect of sampling date using SAS 9.2 software. A principal component analysis (PCA) was conducted to explore interactions between major diatoms groups and particulate organic matter ratios with CANOCO v4.5 software.
22
2.5. Results
2.5.1. General
In the Beaufort Sea, temperature and salinity were relatively stable horizontally and showed strong vertical stratification. Temperature also showed a considerable inter-annual variability (Fig. 4). Surface concentrations of nitrate were generally very low, ranging from 0 to 0.9 M during all surveys. Moreover, the depletion of NO3- ran deeper
into the halocline in recent years (2008-2010). The water column was generally less stratified in Baffin Bay, where the vertical and horizontal distributions of nitrate, temperature and salinity exhibited strong east-west gradient and inter-annual differences (Fig. 5). Surface NO3- concentrations ranged from 0 to 7.2 M and western BB (Arctic
outflow) showed particularly deep and severe NO3- deficits in 2007, 2009 and 2010.
These deficits were associated with an influx of particularly cold and fresh water, with indications of strong vertical mixing in 2009. Silicate and phosphate data are not shown but they qualitatively followed the distribution of nitrate in the two regions.
2.5.2. Nitrate drawdown and nitracline depth
Figure 6 shows integrated salinities in the first 50 m of the water column as well as the depth of the halocline. In the Beaufort Sea, only the stations deeper than 100 m were considered in order to avoid bottom effects and possible inputs of river water. Results showed no significant trend in salinity over the study period (Fig. 6a), which is coherent with the nearly constant vertical position of the halocline near 17 m (Fig. 6b). In Baffin Bay, however, salinity decreased significantly in the upper 50 m (Fig. 6c) and reached record lows during 2007 and 2008. The mixed ANOVA showed that the surface freshening between 1997 and 2011 (p = 0.002) is strongly influenced by the day of sampling (p = 0.027) when their combined effect is considered. No temporal trend was discerned in the depth of the halocline (Fig. 6d).
23
Figure 4. Vertical sections of nitrate concentration (M), temperature (°C) and salinity (PSU) for the Beaufort Sea transect (Fig. 3) between 2003 and 2011. Drawn with Ocean Data View 4.3.5.
24
Figure 5. Vertical sections of nitrate concentration (M), temperature (°C) and salinity (PSU) along the Baffin Bay transect (Fig. 3) for the period 1997-1999 and 2005-2011. Drawn with Ocean Data View 4.3.5.
25
Figure 6. Box plots of the weighted mean salinity in the first 50 m of the water column (A and C) and the vertical position of the halocline (B and D) for the Beaufort Sea and Baffin Bay. Each box represents 50% of the observations and the dividing horizontal mark gives the median value (in red). Whiskers provide ranges for the upper and lower quartiles and circles indicate extreme values. The linear regression lines (trends) were fitted using all individual data points (not shown). Note the different vertical scales. The mean annual day of sampling is noted on the upper axis.
Seasonal nitrate drawdown was significantly higher in Baffin Bay than in the Beaufort Sea (p ˂ 0.001), with values ranging from 52.1 to 394.2 mmol m-2 (mean of 195.5 ± 60.9 mmol m-2) for BS and from 112.7 to 941.1 mmol m-2 (mean of 433.3 ± 206.7 mmol m-2) for BB (Fig. 7b and d).
In the Beaufort Sea, the nitracline depth increased by 3.6 m yr-1 (p ˂ 0.001; r2 = 0.34; n = 178; Fig. 7a), starting at 28.6 ± 12.3 m in 2003 and reaching 49.1 ± 12.7 m in 2011. Maximum values were attained in 2009 (54.8 ± 12.6 m) and 2010 (54.9 ± 12.1 m). Shallow stations (less than 75 m deep) were included in the analyses only before 2006
26
because the nitracline nearly reached the bottom by this year and did not continue its deepening in the following years. The clines for silicate and phosphate showed the same pattern (not shown), with a deepening of 3.8 m yr-1 (p ˂ 0.001; r2 = 0.38) and 4.2 m yr-1 (p ˂ 0.001; r2 = 0.36), respectively. We calculated linear trends to quantify the deepening of nitracline, but we can consider a shift of regime around 2007-2008 where seasonal deficits stabilize for subsequent years (Fig. 7a, b). We observed the same trend when considering deep stations of the Amundsen Gulf polynya separately (+ 2.5 m yr-1, p = 0.004, r2 = 0.48; Fig. 7a) and no difference was found when isolating other regions of the BS (not shown; i.e. coastal stations (< 100 m), deep stations in the Amundsen Gulf (> 100 m) and deep stations in the Beaufort Sea (> 100 m)). The SCM also deepened by 2.5 m yr-1 in the BS (p = 0.005; r2 = 0.09). In Baffin Bay, no consistent trend was found in the nitracline depth (mean = 26.2 ± 16.0 m; Fig. 7c) although unusually deep ones were observed in 2007 (43.0 ± 29.1 m) and 2008 (35.4 ± 14.3 m) at western stations. The SCM depth did not vary during the study period (p = 0.931).
Nitrate drawdown in the BS increased significantly at the rate of 13.6 mmol NO3- m-2 yr-1
(p ˂ 0.001; r2 = 0.27) (Fig. 7b). The highest drawdown (mean of 247.2 ± 58.1 mmol m-2) occurred in 2010. In Baffin Bay, the seasonal NO3- drawdown decreased (p = 0.002; r2 =
0.20) at the mean rate of 18.5 mmol m-2 yr-1 (Fig. 7d) with unusual low values occurring in 2009 (230.2 ± 86.1), 2010 (360.1 ± 182.7) and 2011 (235.9 ± 20.7 mmol m-2). Considering all regions, neither the trends in nor the unusual values of nitrate drawdown and nitracline depth were explained by sampling date (all p values ˃ 0.7 for nitracline depth and ˃ 0.07 for nitrate drawdown).
27
Figure 7. Box plots of nitracline depth (A and C) and seasonal nitrate (NO3-) drawdown (B and D) for the
Beaufort Sea and Baffin Bay. Nitracline deepening for the Amundsen Gulf polynya stations only (A; blue diamonds; + 2.5 m yr-1, p = 0.004, r2 = 0.48). Each box represents 50% of the observations and the dividing horizontal mark gives the median value (in red). Whiskers provide ranges for the upper and lower quartiles and circles indicate outliers. The linear regression lines (trends) were fitted using all individual data points (not shown). Note the different vertical scales.
2.5.3. Nutrient consumption ratios
In the BS, no significant difference (p = 0.386) was found between the ―deficit‖ and the ―residual‖ methods for estimating Si:NO3- ratios, which was 1.68 on average (Table 2).
For NO3-:PO43- ratios, the estimate obtained with the ―residual‖ method (11.64 ± 1.91)
was higher than the one provided by the ―deficit‖ method (9.50 ± 3.07), with a mean value of 10.57 for the two methods. No temporal trends in Si:NO3- and NO3-:PO43- ratios
were discernible using either method (all p values ˃ 0.3). In BB, the mean Si:NO3
28
methods (rSi:NO3- = 1.02 ± 0.32 and ∆Si:∆NO3- = 1.19 ± 0.45; p = 0.079) and showed no
temporal trends (p = 0.734 and 0.961). A small significant difference between western and eastern Baffin Bay was observed with the ―residual‖ method (west = 1.17 ± 0.26; east = 0.93 ± 0.26; p = 0.002; n = 49). A similar analysis could not be done with ∆Si:∆NO3-since several stations had to be rejected following the validation of expected
winter vertical profile of Si. Up to 22 expected profiles failed to reproduce realistic concentrations below the euphotic zone, which can be caused by small errors in the estimation of Pacific and Atlantic water mass fractions, especially in western BB. Since the same issues apply to PO43- data we did not calculate ∆NO3-:∆PO43-. The rNO3-:PO4
3-consumption ratio was 14.62 ± 4.45 and did not show any temporal trend (p = 0.775). The problem does not affect nitrate-based estimates of new production, whose winter concentrations are relatively similar in the two water masses.
29
Table 2. Average silicate:nitrate (Si:NO3-) and nitrate:phosphate (NO3-:PO4-) consumption ratios in the Beaufort Sea, as estimated by
the residual (r) and deficit (∆) methods (see section 2.4.5.b). Standard deviations (parenthesis) indicate inter-station variability for a specific year and inter-annual variability for the overall period.
2003 2004 2005 2006 2007 2008 2009 2010 2011 Overall rSi:NO3- (0.25) 1.70 (0.26) 1.71 (0.22) 1.72 (0.18) 1.53 (0.14) 1.69 (0.25) 1.56 (0.13) 1.92 (0.22) 1.76 (0.16) 1.71 1.70 (0.22) ∆Si:∆NO3- 1.97 (0.60) 1.47 (0.35) 1.59 (0.10) 1.42 (0.09) 1.73 (0.23) 1.60 (0.30) 1.45 (0.16) 1.90 (0.33) 1.81 (0.21) 1.66 (0.36) rNO3-:PO4- 12.58 (1.57) 12.07 (0.91) 10.65 (1.50) 11.63 (1.33) 12.55 (2.93) 12.23 (2.43) 11.18 (1.41) 10.38 (1.42) 11.51 (1.37) 11.64 (1.91) ∆NO3-:∆PO4- 12.35 (6.37) 9.51 (3.62) 9.81 (2.03) 8.00 (0.77) 10.17 (2.60) 8.35 (1.15) 8.60 (0.69) 9.41 (1.97) 9.33 (0.99) 9.50 (3.07)
30
Table 3. Average silicate:nitrate (Si:NO3-) and nitrate:phosphate (NO3-:PO4-) consumption ratios in Baffin Bay, as estimated by the
residual (r) and deficit (∆) methods (see section 2.4.5.b). Standard deviations (parenthesis) indicate inter-station variability for a specific year and inter-annual variability for the overall period. The term ―NA‖ indicates that the estimation could not be performed reliably on a given dataset. There is only one value for ∆Si:∆NO3 in 2008 (identified with an asterisk (*)).
1997 1998 1999 2005 2006 2007 2008 2009 2010 2011 Overall (west only) Overall (east only) Overall (all) rSi:NO3 1.05 (0.25) 0.91 (0.25) 0.87 (0.29) 1.17 (0.36) 1.19 (0.24) 1.41 (0.09) 1.05 (0.33) 0.97 (0.11) 0.75 (0.08) 0.80 (0.28) 1.17 (0.26) 0.93 (0.26) 1.02 (0.32) ∆Si:∆NO3 1.12 (0.14) 1.28 (0.05) 1.18 (0.54) NA 1.39 (0.23) 1.31 (0.48) 0.96* 0.90 (0.53) 1.36 (0.68) NA NA NA 1.19 (0.45) rNO3:PO4 13.50 (4.58) 11.41 (1.04) 17.49 (4.58) 12.86 (0.06) 12.38 (1.88) 11.24 (0.87) 11.45 (4.62) 16.64 (2.62) 17.17 (2.62) 22.07 (0.47) 13.86 (4.73) 14.46 (3.69) 14.62 (4.45)