HAL Id: hal-02457198
https://hal.archives-ouvertes.fr/hal-02457198
Submitted on 27 Jan 2020HAL is a multi-disciplinary open access archive for the deposit and dissemination of sci-entific research documents, whether they are pub-lished or not. The documents may come from teaching and research institutions in France or abroad, or from public or private research centers.
L’archive ouverte pluridisciplinaire HAL, est destinée au dépôt et à la diffusion de documents scientifiques de niveau recherche, publiés ou non, émanant des établissements d’enseignement et de recherche français ou étrangers, des laboratoires publics ou privés.
Distributed under a Creative Commons Attribution| 4.0 International License
dates of the apple trees in mountainous and plain
regions of Algeria
Aicha Abed, Marc Bonhomme, André Lacointe, G. Bourgeois, D. Baali-Cherif
To cite this version:
Aicha Abed, Marc Bonhomme, André Lacointe, G. Bourgeois, D. Baali-Cherif. Climate change effect on the bud break and flowering dates of the apple trees in mountainous and plain regions of Algeria. Advances in Horticultural Science, Firenze University Press, 2019, 33 (3), pp.417-431. �10.13128/ahs-24618�. �hal-02457198�
Climate change effect on the bud break
and flowering dates of the apple trees
in mountainous and plain regions of
Algeria
A. Abed 1, 2 (*), M. Bonhomme 3, A. Lacointe 3, G. Bourgeois 4, D. Baali-Cherif 1
1 National School of Agronomic Sciences, Algiers, Algeria.
2 Laboratory Water‐ Rock ‐Plant, Khemis‐Miliana University, Algeria. 3 Clermont Auvergne University, INRA, PIAF, F‐63000 Clermont‐Ferrand,
France.
4 Agriculture and Agri‐Food Canada, Saint‐Jean‐sur‐Richelieu Research
and Development Centre, Saint‐Jean‐sur‐Richelieu (QC), Canada.
Key words: budburst, flowering, Golden delicious, modelling, temperature.
Abstract: Global warming is a strongly felt reality in recent years in Algeria. The fruit trees crop is particularly exposed to the impact of this warming, especially apple trees. A comparative study has been realized between a chronological daily temperature series from 1980 to 2016, and phenological data series (bud-burst and flowering) from 2000 to 2016, regarding the apple tree variety of Golden Delicious in two zones of Northern Algeria, Sidi Lakhdar (town of Ain Defla, in an altitude of 211 m) and Benchicao (town of Médéa, in an altitude of 1133 m). Some contrasting tendencies according to sites and periods have been demonstrated: very significant warming at Sidi Lakhdar site in autumn and spring, in particular in October and April, disturbing thus the entrance of the buds in the endodormancy and ecodormancy. The result is a late action of the cold until February, which proved to be insufficient. However, no average warming has been demonstrated at the Benchicao site, where the tempera-tures between November and January were cold enough to satisfy the need of cold units and raise the endodormancy. It seems that the failure to fulfill the need of cold units at Sidi Lakhdar site has strongly affected the goodness of fit of the classic phenological models, confirming indirectly the existence of more complex physiological processes (not taken in consideration by models), which manifest themselves in limited zones such as Sidi Lakhdar site.
1. Introduction
According to the experts of the Intergovernmental Group of the Climate Evolution (IGCE), from now on to the end of the 21st century, the
average temperature will be raising from 2 to 6°C in Europe following the regions, the climatic models and the socio-economic scenario. The sum-mer droughts will be more intense as well (Giannakopoulos et al., 2005;
(*)Corresponding author:
abedlila24@yahoo.fr
Citation:
ABED A., BONHOMME M., LACOINTE A., BOUR-GEOIS G., BAALI-CHERIF D., 2019 - Climate chan‐
ge effect on the bud break and flowering dates of the apple trees in mountainous and plain regions of Algeria. - Adv. Hort. Sci., 33(3): 417-431
Copyright:
© 2019 Abed A., Bonhomme M., Lacointe A., Bourgeois G., Baali-Cherif D. This is an open access, peer reviewed article published by Firenze University Press
(http://www.fupress.net/index.php/ahs/) and distributed under the terms of the Creative Commons Attribution License, which permits unrestricted use, distribution, and reproduction in any medium, provided the original author and source are credited.
Data Availability Statement:
All relevant data are within the paper and its Supporting Information files.
Competing Interests:
The authors declare no competing interests.
Received for publication 15 January 2019 Accepted for publication 3 September 2019
AHS
Advances in Horticultural ScienceGleizer et al., 2007).
According to Legave (2009), a worrying accelera-tion of the global warming has appeared during the 1990 decade and much more during 2000 decade. In occidental Europe and the Mediterranean Basin, on a recent period of 30 years (1973-2002), we can esti-mate the average increase of the annual tempera-ture at about 1°C since the end of 1980’s. Regional differences are noticed though, with a warming rela-tively marked in the region of Meknes in Morocco (2.3°C) (Balaghi, 2017), definitely higher than the one marked in the South-West of France (+1.3°C in Nimes)(Legave, 2009).
The global warming will affect, and has already notably done, a wide range of physical/biological sys-tems and human activity sectors, among which agri-culture (including livestock) and its principal function of producing and nutrition (Seguin, 2010). For Algeria, the 21st century shall be characterized by
temperatures increase, in the order of 1.0 to 1.5°C at the horizon of 2020 (Fourth report of the IGCE in Bourchef, 2013) and precipitations decrease in the order of 15 to 20%. Extreme climatic phenomena are already affecting the region, like the rain and thun-derstorms of November 2001 in Algiers and October 2008 in Ghardaia, and the cold waves in January 2005 and February 2001 in all Algeria. All these events can be qualified as historic at least regionally. Some simu-lations realized for two types of agricultural years in terms of pluviometry (normal and dry), show at the horizon of 2020 a decrease in the yield of winter cereals from 6% to 14% according to the geographi-cal regions and the year type in Algeria (Tabet-Aoul, 2000; Tabet-Aoul and Bessaoud, 2009).
Phenology is the study of the occurrence of peri-odic events in animal and plant life in relation with the climate variations. Those are characters that interpret the organisms’ adaptation to the climatic variation (Chuine, 2005). The task of plant-phenology is to observe and record the periodically recurring growth stages. Leaf unfolding, flowering of plants in spring, fruit ripening, colour changing and leaf fall in autumn are all examples of phenological events (Koch et al., 2006).
It has been designated as a key point to evaluate the global warming impact on the agricultural cultiva-tions (Moriondo and Bindi, 2008). Many studies have pointed an agreement which many species advanced the spring phenology events (budburst and blooming dates) particularly (Doi and Katano, 2008; Gordo and Sanz, 2010; Malagi, 2014). Since distinct phenological stages were defined decades ago (Baggiolini, 1952;
Lichou et al., 1990; Meier et al., 1994), a comparison of available definitions of phenological stages in cher-ry used independently throughout Europe showed overlaps and shortcomings; hence, harmonisation was reached in this respect in the COST Cherry FA 1104 working group 2 (cherry phenology and climate change) based largely on the acceptance of the BBCH scale and agreed standard cultivars for phenology monitoring. Cultivars were selected on the basis of early, medium and late flowering and most widely grown throughout Europe. This contribution presents the agreed phenology stages in both visual and word-ing evidence. Similarly, this contribution presents the agreed cultivars to be monitored in future for phe-nology and climate change effects for harmonization (Wenden et al., 2017).
In this context, the fruit arboriculture seems rela-tively vulnerable from the fact of some of its charac-teristics, rather biological (eg: the fruit trees sustain-ability and their need to many years of growth before fruiting) than economic. Compared to other produc-tions (annual cultivaproduc-tions), the fruit arboriculture is particularly exposed to unfavorable climatic impacts from the fact of multiannual consequences (alterna-tion of produc(alterna-tion after ceasing) and accumulative (repeated impacts on the tree architecture). On the socio-economic level, strong links have been woven during the time between the product and its produc-tion place (eg: Provence almonds, Roussillon apri-cots…etc). This characteristic developed in France, for commercial valorization reasons, in a regulatory form of origin and quality naming (eg: Agen prunes, Lorraine plums…etc.). From this fact, the substitution of varieties and much more species for long-term cli-matic adaptation reasons seems relatively difficult to be implemented, probably risking to encounter regu-latory and human obstacles (Legave, 2009).
These characteristics constitute an obstacle to the fast changes, not only to the variety range but also to the cultivation systems to cope with rising tempera-tures or other constraints from climate change. This climate vulnerability has already been expressed in the 2000s by strong production irregularities. Unprecedented accumulations of unfavorable climat-ic conditions (frost, high temperatures, excessive rainfall) have been observed during key phases of the annual cycle of trees, from flowering to fruiting. Thus, in southern France, very significant production losses were provoked, especially in 2007 for cherry trees following stormy episodes in May and June, which strongly penalized the French production, and in 2008 for apricot following episodes of excessive
heat as blooming approached. Sensitive varieties have had abortion rates that strongly penalize the national production.
Phenological notes on flower buds of fruit trees, collected under contrasting temperature (time and place) conditions in Europe, showed a significant advance of the different phenological stages, espe-cially the flowering dates, for all the places. Modeling work on spring phenology strongly suggests that warming has two opposite effects: (1) in autumn and early winter, a slowdown in the satisfaction of cold unit needs, delaying endodormancy; (2) at the end of winter and in spring, an acceleration of the satisfac-tion of the heat needs during the ecodormancy phase. The more pronounced intensity of this latter effect, consistent with the more pronounced increas-es in temperature at the end of winter-early spring than in autumn, largely explains the advances in flowering (Legave et al., 2009).
The analysis of flowering dates over long periods in Western Europe for the Golden Delicious apple variety reveals more significant progress in the North of the continent (10 days) than in the oceanic west (6-7 days) and a shortening of flowering time in con-tinental regions (Legave et al., 2012). These regional differences across Western Europe led to a decrease in spatial variability, that is to say, smaller differences between the flowering dates in the contrasting regions (decrease of 8-10 days for complete flower-ing between the Mediterranean and continental regions). Modeling studies, based in particular on the correlations between the average temperature of the period of ecodormancy and the observed flowering dates, confirm the notion that flowering advances and shortenings are mainly due to a faster satisfac-tion of the demand for heat units (Legave et al., 2015).
However, delayed endodormancy has also been noted in the oceanic and Mediterranean regions, which may explain the shorter advances in these areas despite similar or greater warming and ulti-mately lead to delayed flowering. The joint statistical analysis of flowering date series for the Golden
Delicious variety and temperature dynamics reveals a
geographical diversity of responses to warming from autumn to spring. Temperate climates in Europe are characterized by flowering progress, while soft cli-mates are characterized by flowering progress or sta-tionary flowering dates (eg. Morocco and Brazil), (Legave et al., 2015). At the same time, Legave et al. (2015) and El Yaacoubi et al. (2016) have shown in mild winter conditions, a longer flowering time
asso-ciated with the high average temperature of the endodormancy period.
In the same context, a comparison of dormancy dynamics of vegetative and floral buds of apple and almond trees was recently conducted between southern France, southern Brazil, and northern Morocco. Differences in dormancy intensity and kinetics have been identified in relation to regional differences in the satisfaction of cold needs and dif-ferent levels of requirements of the genotypes stud-ied. The observed diversity of dormancy patterns suggests that genotypes adapted to mild climates (eg, almond trees, apple trees with low cold needs) are characterized by the ability of vegetative buds to remain in a state of low dormancy and ability of flower blanks to grow rapidly, guaranteeing the absence of phenological anomalies subsequent to foliage and flowering (El Yaacoubi et al., 2015).
The apple tree is currently an important fruit species in Algeria. Production is the most important fruit production, but it does not sufficiently cover the demand. The central region (Medea - Blida - Ain Defla) totals about 7400 ha or about a quarter of the total area. Apple cultivation has grown considerably, from 30,000 ha in 2003 to 41,000 ha in 2013, with a production reaching 400,000 tons (F.A.O 2013, men-tioned by Meradi, 2015). Due to the levels of yield and quality obtained, the Golden Delicious variety is one of the three varieties that dominate the Algerian market, particularly in the region of Medea (Golden
Delicious 70%, Starkrimson 20% and Granny Smith
5%) (Hadj Sahraoui, 2014). The apple “hanna”, of its real name “anna”, is a new variety of apple trees introduced in Algeria. It is planted in less cold areas, in the center of Algeria on the perimeter of high chel-lif in Ain Defla, in the west on the Sebaou valley of Telemcen and in the east to Khenchela and M’sila. They are among the varieties less demanding in cold and generally give apples of lesser quality, hardly storable (Hamdani et al., 2016).
However, apart from regionalized studies aimed at predicting climate change through time series of temperature and rainfall and estimating its impact on crops through the increase of yields in all regions of Algeria including Constantine region in the east of the country (Kherief Nacereddine and Alatou, 2004; Tabet, 2008; Zekri et al., 2009) and Oran region in the west (Benabadji and Bouazza, 2000; Labani et al., 2006), no study on phenological development as a key element to characterize the impact of climate change has been undertaken. We therefore wanted to begin to fill this gap with this study aiming at first,
the characterization of climate change via tempera-ture series and the search for a possible impact on the phenology of the apple tree and, in a second step, the determination of the critical periods with regard to the accumulation of cold units and units of heat, by the implementation of the classical pheno-logical models. For this, we analyzed the time series of phenological data of the Golden Delicious variety in two contrasting zones from the climatic point of view: a zone of plain with a rather warm climate, Sidi Lakhdar (town of Ain Defla) and a cooler zone in alti-tude, Benchicao (town of Medea).
2. Materials and Methods
Sites and climatic data
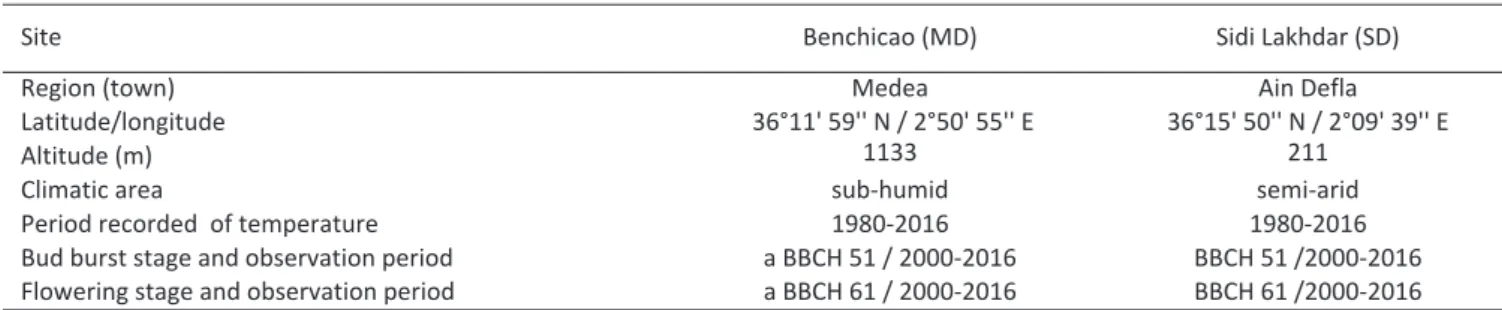
The temperature data recorded for each site are shown in Table 1. The two zones selected in this study are: Sidi Lakhdar (town of Ain Defla, latitude: 36° 15 ‘50’’ N, longitude: 2° 09’ 39’’ E, altitude 211 m, located in the center of Algeria 145 km south-west of Algiers) known for its semi-arid climate with a mild winter and a very hot summer, and Benchicao (town of Médea, latitude: 36° 11 ‘59’’ N, longitude: 2° 50’ 55’’ E, altitude 1133 m, located 80 km south-west of Algiers) in a mountainous area with a warm temper-ate climtemper-ate.
Daily maximum and minimum temperature data obtained over a period of 37 years (1980 to 2016) were collected at weather stations near selected sites belonging to the National Office of meteorology. Average temperatures were calculated using maxi-mum and minimaxi-mum temperatures. Missing daily data were estimated using two methods:
A linear interpolation for some values over 1 to 3 days (means to fill the missing values of Tmax and Tmin were carried out): Correlations with another
site for the longest periods namely; between the sta-tion of Sidi Lakhdar and the stasta-tion of Chlef (latitude 36° 10’ N, longitude 1° 20’ E, altitude 116 m) for the month of May of the year 2005, and between the station of Benchicao (Médéa) and the station of Bordj Bou Arreridj (latitude 36° 04 ‘23’’ N, longitude 4° 45’ 39’’ E, altitude 930 m) for the months of January, February, March and April of the year 1980 and the month of May of the year 2001.
Similarly, a correlation was made between the Médéa site and the Sétif meteorological station (lati-tude 36° 11 ‘28’’ N, longi(lati-tude 5° 24’ 49’’ E, alti(lati-tude 1038 m) for the months of September, October and November of the year 1981, and February and December of the year 1990.
Phenological data
Data collected from 2000 to 2012 were provided by specialized state agencies. These are average dates that represent all the orchards visited. Those from 2013 to 2016 were collected directly from the same orchards, which were among the most apple orchards planted at both sites. Phenological monitor-ing 3 to 4 times a week was carried out on adult trees, the number of which sufficiently covered the total area of a given orchard (50%), respecting the two orientations (North-South and West-East). These orchards have not undergone any chemical treat-ment to break endodormancy or accelerate flower-ing. Phenological stages were described according to the BBCH scale (Meier et al., 1997, 2001). The pheno-logical stages of bud break (bud burst, Baggiolini stage C and stage 51 of the BBCH scale) and early flowering (10% open flowers, Baggiolini F1 stage and 61 BBCH scale) were observed from 2000 to 2016 on the two apple orchards maintained according to con-ventional horticultural practices. Both stages were reported affected when 60% of the trees in the orchard had reached the given stage.
Table 1 - Phenological and temperature data collected in climate-contrasting sites for ‘Golden delicious’ apple trees
Site Benchicao (MD) Sidi Lakhdar (SD)
Region (town) Medea Ain Defla
Latitude/longitude 36°11' 59'' N / 2°50' 55'' E 36°15' 50'' N / 2°09' 39'' E
Altitude (m) 1133 211
Climatic area sub-humid semi-arid
Period recorded of temperature 1980-2016 1980-2016
Bud burst stage and observation period a BBCH 51 / 2000-2016 BBCH 51 /2000-2016
Flowering stage and observation period a BBCH 61 / 2000-2016 BBCH 61 /2000-2016
a: BBCH 51, 61; stages in phenological code BBCH (Meier, 1997), are respectively swelling buds of inflorescences and 10% of flowers open.
A, B and C. The parameter A determines the width of the window on which the function is not zero. The larger the value, the larger the temperature range over which the cold units are wide. Parameter B determines the sharpness of the response curve and its asymmetry. The more B differs from zero, the sharper the image (and more asymmetric). Parameter C determines the value of the average response when B is close to zero and represents a limit to the temperature range over which cold units accumulate, when B is significantly different from zero.
The Wang model was first defined by Wang and Engel (1998). It is characterized by an optimum and is not symmetrical. This concerns the family of the beta function. It is composed of three parameters, namely Tmin, Topt and Tmax (minimum, optimal and maxi-mum temperatures).
The Sigmoid model was introduced by Hänninen (1990). It consists of two parameters, D and E. The D parameter defines the sharpness of the response. Values far from zero induce a sharper response curve. The parameter E is the average response tem-perature.
Smooth Utah/ Wang and Smooth Utah/ Sigmoid
The Smooth Utah model was introduced by Bonhomme et al. (2010) and is a smoothed version of the Utah function proposed by Richardson et al. (1974). This function assumes that cooling can occur only over a range of temperatures and has four para-meters: Tm1, Topt, Tn2 and min. Negative cooling values can be accumulated on hot days, increasing the amount of cold to reach.
Tm1: This parameter defines the sharpness of the decrease of the cold effect on the endodormancy of the buds. The lower Tm1, the slower is the decrease.
Topt: This parameter corresponds to the optimum average daily temperature, for which a cooling unit is accumulated each day.
Tn2: This parameter defines the intermediate response, i.e. the temperature (above Topt) that has half of Topt’s effectiveness for inducing endodorman-cy.
Min: This parameter defines how much the impact of high temperatures can be negative.
When min = 0, high temperatures do not have a negative impact on endodormancy release. When min = -1, the negative impact of a day that is too hot is equivalent to the positive effect of a day in Topt.
Each model is characterized by efficiency (EFF), an estimated time (t0) and a quadratic error (RMSE: Root mean square error).
Modeling and data analyses
To better explain the phenological behavior of the
Golden Delicious variety in the two sites studied and
to highlight the effect of the temperatures on the lat-ter in lat-terms of satisfaction in cold units and heat units, statistical analyses were carried out under R (R Development Core Team 2008), concerning regres-sion curves between the different temperature com-ponents (minimum, average and maximum) and the year as well as the two phenological stages (bud burst and flowering). Similarly, parametric name cor-relation tests of Spearman were performed between two variables namely annual and monthly tempera-ture (minimum, average and maximum) and year on the one hand and phenological stages on the other hand. Calculation and establishment of cold unit accumulation curves were performed using the Utah model (Richardson et al., 1974).
Utah model
The Utah model was designed by Richardson et al. (1974). This model combines the cold units for tem-peratures between 0 and 16°C and associates a nega-tive value with temperatures higher than 16°C. This model is built to use fixed degree-days (independent of cold units) to predict bud break. The Utah model (Richardson et al., 1974) transforms the hourly tem-perature into a cold unit from -1 to 1. The cumulative number of Utah cold units at time t is expressed as follows:
UCUtot =
With (U= 0 for T≤1.4°C, U= 0.5 for 1.4°C <T≤2.4°C, U= 1 for 2.4°C <T≤9.1°C, U= 0.5 for 9.1°C <T≤ 12.4°C, U= 1 for 12.4°C <T≤15.9°C, U = -0.5 for 15.9°C <T≤18.0°C, U = -1 for T≥18.0°C) (Ricard, 2014).
Phenological modeling platform PMP5.5
The phenological models were adjusted using the Phenology Modeling Platform (PMP5.5) proposed by Chuine et al. (2013). PMP5.5 is an environmental-use interface aimed solely at managing the construction of a phenological model, fitting a phenological model to the data and simulating using a phenological model. The best results of the bud burst and flower-ing date prediction in the two studied sites are obtained by two-phase models (knowing that phase 1 corresponds to the accumulation of cold units and phase 2 corresponds to the accumulation of heat units ) quoted below.
Chuine/Wang and Chuine/Sigmoid
The Chuine model has been described in Chuine (2000) and is composed of three parameters, namely
Tu t
1
3. Results
General climatology. Annual tendencies
The annual average maximum, medium, and mini-mum temperatures for both sites are shown in figure 1. The linear regression of mean annual tempera-tures over the 36 available years revealed a signifi-cant warming (P = 0.004) at the Sidi Lakhdar (SD) site, with a significant increase in the mean annual mini-mum temperatures (P = 0.001), and less for the aver-age annual maximum temperatures (P = 0.04). There is rather a cooling tendency at mountain site of Benchicao, although not significant (P = 0.09), con-cerning the annual average and where the maximum temperatures experienced some significant regres-sion (P = 0.001). The hottest years were 1990, 2010 and 2007 at the site of Sidi Lakhdar and 2016, 1997 and 2000 at Benchicao site.
Tendencies for the autumn‐spring period
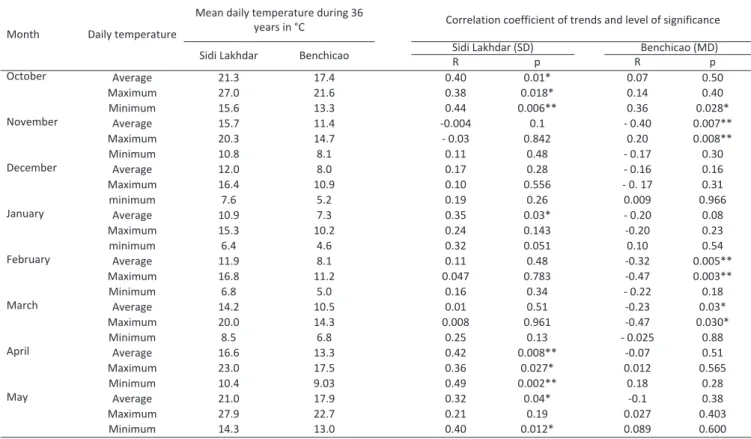
A seasonal analysis from the 36 years available shows marked differences between the two sites. The monthly average temperature tendencies for the months of October to May (minimum, mean and maximum daily temperatures) measured during the period 1980 to 2016 for the two sites (Sidi Lakhdar and Benchicao) are summarized in Table 2 and figure
Table 2 - Temperature data collected characteristics in the two studied sites in Algeria during 36 years
* p<0.05, ** p<0.01.
Fig. 1 -Average annual temperatures (minimum, average, maximum) for
the two sites, Sidi Lakhdar (SD) and Benchicao (MD) from 1980 to 2016. *, ** indicate the significance level of the correlation for P <0.05 and for P <0.01, respectively. Sidi Lakhdar: (SD) Tmin: y = 0.0403x - 66.906 (R² = 0.33**), Taverage : y = 0.0305x - 41.183 (R² = 0.21**), Tmax: y = 0.0234x - 21.077 (R² = 0.0864). Médéa:(MD) Tmin: y= 0.0122x - 12.479 (R² = 0.03), Taverage: y = -0.019x + 54.187 (R² = 0.090), Tmax: y = -0.0503x + 121.02 (R² = 0.31**).
Month Daily temperature
Mean daily temperature during 36
years in °C Correlation coefficient of trends and level of significance Sidi Lakhdar Benchicao Sidi Lakhdar (SD)R p RBenchicao (MD)p
October Average 21.3 17.4 0.40 0.01* 0.07 0.50 Maximum 27.0 21.6 0.38 0.018* 0.14 0.40 Minimum 15.6 13.3 0.44 0.006** 0.36 0.028* November Average 15.7 11.4 -0.004 0.1 - 0.40 0.007** Maximum 20.3 14.7 - 0.03 0.842 0.20 0.008** Minimum 10.8 8.1 0.11 0.48 - 0.17 0.30 December Average 12.0 8.0 0.17 0.28 - 0.16 0.16 Maximum 16.4 10.9 0.10 0.556 - 0. 17 0.31 minimum 7.6 5.2 0.19 0.26 0.009 0.966 January Average 10.9 7.3 0.35 0.03* - 0.20 0.08 Maximum 15.3 10.2 0.24 0.143 -0.20 0.23 minimum 6.4 4.6 0.32 0.051 0.10 0.54 February Average 11.9 8.1 0.11 0.48 -0.32 0.005** Maximum 16.8 11.2 0.047 0.783 -0.47 0.003** Minimum 6.8 5.0 0.16 0.34 - 0.22 0.18 March Average 14.2 10.5 0.01 0.51 -0.23 0.03* Maximum 20.0 14.3 0.008 0.961 -0.47 0.030* Minimum 8.5 6.8 0.25 0.13 - 0.025 0.88 April Average 16.6 13.3 0.42 0.008** -0.07 0.51 Maximum 23.0 17.5 0.36 0.027* 0.012 0.565 Minimum 10.4 9.03 0.49 0.002** 0.18 0.28 May Average 21.0 17.9 0.32 0.04* -0.1 0.38 Maximum 27.9 22.7 0.21 0.19 0.027 0.403 Minimum 14.3 13.0 0.40 0.012* 0.089 0.600
2. Table 2 generates Spearman parametric name cor-relation values between maximum, average and min-imum monthly temperatures and year, and where p is the level of significance and R is the correlation coefficient.
We focused on the period from October to May, which is the period that most affects the physiological processes associated with the spring phenology of flower buds of fruit trees in our region. Average October temperatures are high and increase signifi-cantly at Sidi Lakhdar site. The month of April is also warming significantly on this site (Table 2, Fig. 2). No significant tendency is recorded for the other months. Correlations on monthly temperature tendencies also clearly showed significant summer warming in July at Sidi Lakhdar site (data not shown). At mountain site of Benchicao, on the other hand, as already indicated above, during the 36 years, no significant warming is recorded in average temperature. On the contrary, average temperatures decreased in November and February (P = 0.007 ** and P = 0.005 *, respectively). Regarding average minimum temperatures, the lowest values were recorded during the month of January for both sites with 6.4 and 4.6°C. The highest
minimum temperature value of 12.1°C and the lowest value of 8.2°C were recorded by order in 2006 and 1991 at the site of Sidi Lakhdar for this month of January. At mountain site Benchicao, the highest value of 9.7°C is reported in 2000 compared to a lower value of 6.6°C in 1980. The site of Sidi Lakhdar experienced extreme maximum temperatures during the months of October and April which explains the significance of the increase in average temperatures during these two months (Fig. 2a). Significant regressions of maximum temperatures were recorded at the Benchicao site dur-ing the months of November, February and March.
Phenological development
Comparisons of the phenological tendencies of the apple tree (in terms of bud burst and flowering) in the two contrasting environments were made from the 16 years available. For budding dates of flower buds at Sidi Lakhdar site, some variation between years was revealed with marked tardiness during the years 2002, 2007, 2012, 2013 and 2016, when there was a bud break between the end of March and the first days of April and an early fruit maturity in 2000, 2003 and 2006, but the overall ten-dency for all years is not significant (P = 0.07). The tendency towards the advancement of flowering dates (Fig. 3) is also not significant (P = 0.24), the
ear-Fig. 2 - Evolution of average monthly temperatures, on both sites, for
months where the trend is significant at Sidi Lakhdar (October and April) and at Benchicao (November and February). *, ** indicate the significance level of the correlation for P <0.05 and for P <0.01, respectively. Sidi Lakhdar: (SD) Average April: y = 0.068x - 119.18 (R² = 0.2252**), Average October: y = 0.0742x - 126.9 (R² = 0.1909**). Médéa:(MD) Average February: y = 0,0799x + 167,72 (R² = 0, 1833), Average November: y = -0.0483x + 107.88 (R² = 0.1376).
Fig. 3 - Trends in bud burst and flowering dates at the Sidi Lakhdar (SD) and Benchicao (MD) sites. *, ** indicate the significance level of the correlation for P<0.05 and for P<0.01, respectively. Sidi Lakhdar: (SD) Bud burst/years: y = 0,1397x + 80, 86 (R² = 0, 0104), Flowering/years: y = -0.4412x + 105.03 (R² = 0.0872). Médéa: (MD) Bud burst/years: y = 0.7623x + 83.257 (R² = 0.2496), Flowering/years: y = 0.8971x + 100.4 (**R² = 0.3263).
liest years being 2003, 2009, 2010 and 2011, and the later years 2001, 2004 and 2005 At Benchicao site, a significant tendency (P = 0.010) at the late flowering dates of the apple tree is to be reported (Fig. 3b). On the other hand, differences in historical trends were shown in the bud break dates, oscillating between advancement during the years from 2000 to 2003, and a delay in the years 2004 to 2008.
Accumulation of chilling units in winter
The Utah cold unit (CU) accumulation curves reveal significant interannual differences at the Sidi Lakhdar site and show that for the years 2001, 2007, 2010 and 2016, this accumulation was insufficient because at below 600 CU, which is well below the estimated needs of the Golden Delicious variety (900 CU) (Fig. 4). On the other hand, at mountain site of Benchicao, the needs are always quickly satisfied.
In order to analyze the influence of the different months in terms of cold units, we calculated the cor-relations between the dates of bud burst or flowering and the monthly temperatures (minimum, average and maximum) (Table 3). Very schematically, the ten-dencies can be summed up as follows: At the Benchicao site, the month of January and the whole period from November to January and February have a strong influence on meeting the needs in cold units because the correlation is positive (the warmer it is, the more the budding/flowering is late), whereas it is not the case in November and December (October remains quite neutral with a negative correlation). The impact of January is preponderant because if we
look at the influence of the period from November to January, we find a negative effect of high tempera-tures on the precocity (R² = 0.40) while the months of November and December have an inverse effect.
At the site of Sidi Lakhdar, the balance sheet is
Fig. 4 - Cumulative cold unit according to the Utah model at the Sidi Lakhdar site. A) Years when cumulative cold is less than 500 hrs; B) Years when cumulative cold exceeds 800 hrs.
Table 3 - Spearman's correlation between bud burst and flowering for ‘Golden delicious’ apple tree and mean temperature from October to April
* P<0.05, **P<0.01.
Variable
Sidi Lakhdar (SD) Benchicao (MD)
Mean Temperature Minimum Temperature Maximum Temperature Mean Temperature Minimum Temperature Maximum Temperature
Bud burst Flowering Bud burst Flowering Bud burst Flowering Bud burst Flowering Bud burst Flowering Bud burst Flowering
October -0.031 0.11 -0.21 0.13 -0.20 0.033 0.015 0.019 -0.106 0.135 0.081 0.14 November -0.41 * -0.12 -0.55 * -0.21 -0.38 -0.036 -0.54 * -0.225 -0.57* -0.232 -0.47* 0.18 December -0.18 -0.43 * -0.11 -0.232 -0.2 -0.50 * -0.40 * 0.054 -0.52* -0.11 -0.322 0.18 January 0.31 * -0.002 0.006 -0.24 0.46 * 0.14 0.46 * 0.3 0.232 0.15 0.54* 0.41 February 0.10 0.01 -0.09 0. 12 0.01 0.13 0.063 0.073 0.021 -0.015 0.13 0.15 March -0.43 * -0.34 * -0.27 -0.147 -0.36 -0.36 * -0.60 * -0.65 * -0.60* -0.64* -0.55* -0.56* April -0.45 * -0.30 -0.41 * -0.145 -0.48 * -0.33 * 0.08 -0.072 -0.101 -0.30 0.12 0.041 November-January 0.30 * -0.26 0.14 -0.45 * 0.30* -0.30* 0.43 * 0.40 * 0.28 0.33 0.52* 0.53* November-February 0.06 -0.052 0.21 -0.14 0.18 -0.14 0.48 * 0.44* 0.233 0.212 0.30 0.21 November-March 0.041 -0.29 0.01 -0.20 0.132 -0.30 0.184 0.27 0.062 0.104 0.33 0.30 March-April -0.56 * -0.45 * 0.08 -0.025 -0.54 * -0.330 -0.26 -0.44* -0.304 -0.54* -0.133 -0.20
globally the same. The correlations between mean and maximum temperatures in January on the one hand, and bud break dates on the other, are signifi-cantly positive, indicating the importance of this month’s temperatures for the satisfaction of cold unit requirements, the month of October remains lit-tle determinant. A hot January is a delay in meeting cold needs and bud break. A negative tendency of the high temperatures of the period from November to January on the precocity (R2 = 0.30) was recorded
whereas the other months go rather in the direction of a gain of precocity. Significant and negative rela-tionships were observed between maximum temper-atures in December and flowering, with a correlation coefficient of -0.50.
Accumulation of forcing units in spring
March-April period (-0.44) show the link between the early flowering period and the average tempera-ture It is rather March that plays the main role for both sites. At the Benchicao site, only March temper-atures show a significant negative correlation with bud break and flowering dates. Negative correlations obtained between average temperatures of the peri-od, with a very high prevalence of March tempera-tures. At the site of Sidi Lakhdar, March and April strongly influence the precocity via maximum tem-peratures and average temtem-peratures.
Phenology modeling
For both sites, the best sequential models selected are given in Table 4. They were chosen on the basis of efficiency (EFF) and RMSE (RMSE), but also taking into account the physiological relevance of the tempera-ture response curves for the cold unit stacking phase and the heat unit stacking phase. RMSE may appear
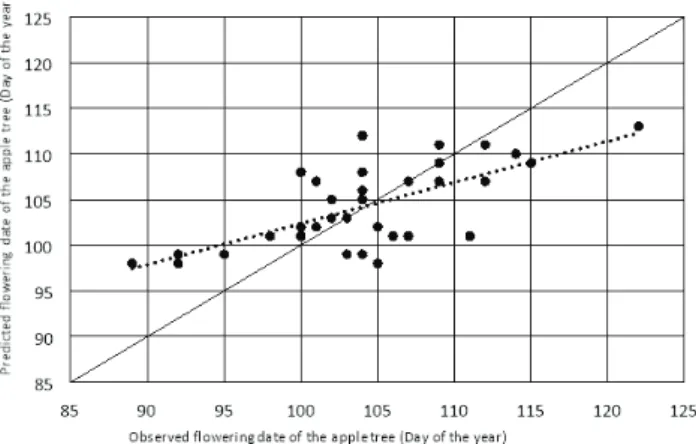
acceptable (~ 5 days) on a flowering date but the effi-ciencies are less good. The correlation between the observed values and the predicted values confirms this diagnosis (Fig. 5). The efficiency is very slightly improved (reaching a difference of 0.03 to 0.09) by eliminating the years when the cumulative cold units are not satisfactory at Sidi Lakhdar site.
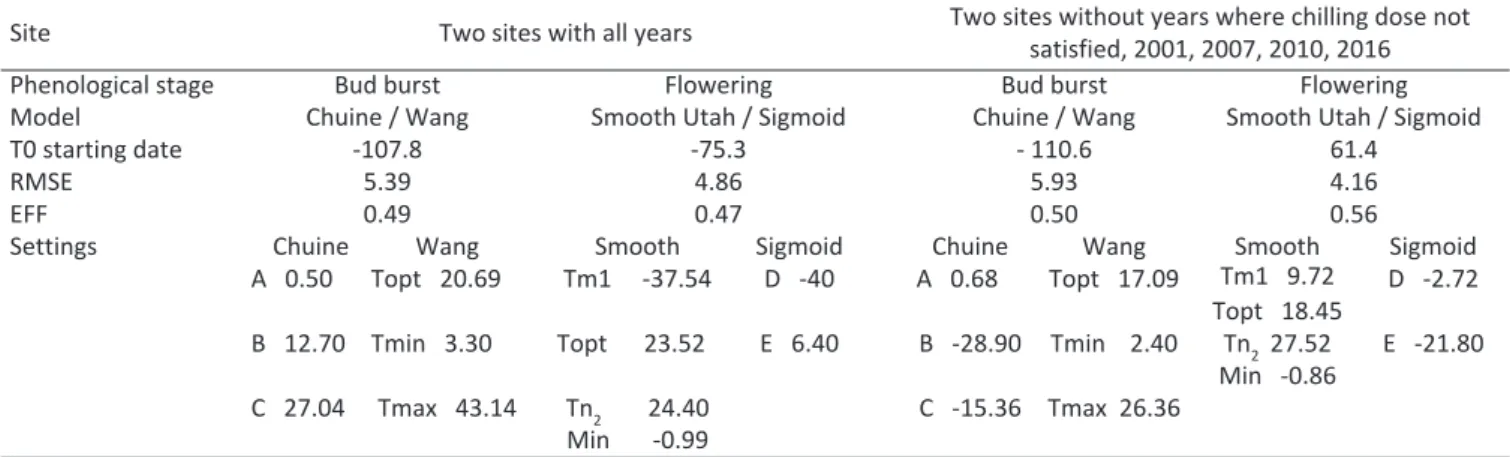
Table 4 - Modeling bud burst and flowering for ‘Golden delicious’ apple tree by Chuine/Wang and Smooth Utah/Sigmoid in the two stu-died sites with all years and without years where chilling does not satisfied
Site Two sites with all years Two sites without years where chilling dose not
satisfied, 2001, 2007, 2010, 2016
Phenological stage Bud burst Flowering Bud burst Flowering
Model Chuine / Wang Smooth Utah / Sigmoid Chuine / Wang Smooth Utah / Sigmoid
T0 starting date -107.8 -75.3 - 110.6 61.4
RMSE 5.39 4.86 5.93 4.16
EFF 0.49 0.47 0.50 0.56
Settings Chuine Wang Smooth Sigmoid Chuine Wang Smooth Sigmoid
A 0.50 Topt 20.69 Tm1 -37.54 D -40 A 0.68 Topt 17.09 Tm1 9.72 D -2.72
Topt 18.45
B 12.70 Tmin 3.30 Topt 23.52 E 6.40 B -28.90 Tmin 2.40 Tn2 27.52 E -21.80
Min -0.86
C 27.04 Tmax 43.14 Tn2 24.40 C -15.36 Tmax 26.36
Min -0.99
Fig. 5 - Comparison between the observed and the predicted flowering date of apple in two sites. A) for all years by the Smooth Utah/Sigmoid model. y = 0.5286x + 49.199; R² = 0.4796; B) without the years where the cumulative cold units are not satisfied by the Smooth Utah/Sigmoid model. y = 0.5041x + 51.647; R² = 0.5555.
By examining separately the two sites, and in par-ticular that of Sidi Lakhdar, which shows years when the accumulation of cold units is not satisfied (Fig. 6a), we see that the withdrawal of these years great-ly improves the results of modeling (Fig. 6b) and in particular for flowering. The relevance of the response curve obtained for the cold unit function is also greatly improved (Table 5).
At Benchicao site (Table 6), the efficiency of the two-phase model is medium and figure 7 shows that it is difficult to predict the early years. In fact, the two-phase model is not much better than a one-phase model on bud break and not better for flower-ing. The results of the one-phase model (only the heat-accumulation model: degree-day growth, Parabolic, Richarsdon, Wang, Sigmoid, Threshold and Smooth Utah) yielded non-significant results.
4. Discussion and Conclusions
The sensitivity of phenophases to temperature changes is a good indicator of the long-term biologi-cal impacts of climate change and terrestrial ecosys-tems (Richardson et al., 2013). Several studies have shown that the phenophases most sensitive to tem-perature variations are those occurring in spring or summer and that there is a relatively linear relation-ship between the occurrence of these phenophases
Site Sidi Lakhdar with all years Sidi Lakhdar without years where chilling dose not
satisfied, 2001, 2007, 2010, 2016
Phenological stage Bud burst Flowering Bud burst Flowering
Model Chuine/ Sigmoid Chuine/ Sigmoid Chuine/ Sigmoid Chuine/ Sigmoid
T0 -102.3 61 -119 -59.7
RMSE 3.79 5.02 3.30 2.10
EFF 0.72 0.44 0.80 0.90
Settings Chuine Sigmoid Chuine Sigmoid Chuine Sigmoid Chuine Sigmoid
A 1.61 D -32.51 A 2.95 D -11.93 A 0.96 D -2087 A 3.21 D -40
B - 5.67 E -21.66 B -25.47 E 0.50 B -29.7 E -25.47 B 12.47 E 14.93
C 19.42 C 8.60 C -6.72 C 16.93
Table 5 - Modeling bud burst and flowering for ‘Golden delicious’ apple tree in Sidi Lakhdar by Chuine/Sigmoid model with all years and without years where chilling does not satisfied
Table 6 - Modeling bud burst and flowering for ‘Golden deli-cious’ apple tree in Benchicao by Smooth Utah/Wang and Chuine / Sigmoid models with all years
Fig. 6 - Comparison between the observed and the predicted bud burst date of the apple tree at the Sidi Lakhdar site. A) for all years by the Chuine/Sigmoid model. y = 0.8316x + 13.544; R² = 0.7207; B) without the years when the cumulative cold units are not satisfied by the Chuine/Sigmoid model. y= 0.8165x + 15.548; R² = 0.8066.
Site Benchicao with all the years Phenological stage Bud Burst Flowering Model Smooth Utah / Wang Chuine / Sigmoid
T0 -104.9 -78.7
RMSE 5.43 4.91
EFF 0.48 0.46
Settings Smooth Utah Wang Chuine Sigmoid Tm1 -34.85 Topt 22.31 A 0.45 D -39.99 Topt 21.15 Tmin 3.60 B -10.58 E 6.39
Tn2 29.42 Tmax 49.9 C 1.03 Min -0.81
and temperature (Gordo and Sanz, 2010; Morin et
al., 2010; Beaubien and Hamann, 2011).
Our study is a first attempt to evaluate the impact of global warming on the bud break and flowering of the apple tree in northern Algeria. The study of the chronological series of temperatures (minimum, average and maximum) from 1980 to 2016 (36 years) in the two important apple production sites, namely: Sidi Lakhdar and Benchicao, showed a very significant warming in October and April at the site of Sidi Lakhdar (SD) likely to strongly disrupt the entry into endodormancy and ecodormancy. Strangely, the Benchicao (MD) site does not show global warming and even a cooling trend in November and February, which could lead to an endodormancy and a start of satisfaction in cold units and then an acceleration of the recovery of growth leading to greater precocity.
Establishing the time of endodormancy emer-gence is important (Guerriero et al., 2002), but is hampered by the complexity of the process, including the fact that, under natural conditions, cold and warm temperatures alternate, causing “Inversions” in the process of endodormancy emergence (Overcash and Campbell, 1955; Couvillon and Erez, 1985; Erez and Couvillon, 1987). Some results suggest that par-tial dissatisfaction with cold can be compensated by heat unit supplementation for bud break (Dantec, 2014).
To lift the endodormancy, the bud must accumu-late enough cold (Campoy et al., 2011). When the plant has reached its cold needs, the endodormancy is lifted and the buds can resume their growth as soon as the conditions become favorable, i.e. under certain (rather high) temperature conditions, soil moisture and nutrients, and for photosensitive
species, certain photoperiod conditions (Körner and Basler, 2010; Polgar and Primack, 2011). These favor-able conditions must last for a certain period of time for the bursting of the buds to appear.
For our case, the cold needs were always met to lift the endodormancy of the apple tree at the Benchicao site, and this as from the end of December or the first half of January (Fig. 4). Conversely, at the Sidi Lakhdar site, values below the threshold for sat-isfying cold needs estimated at 900CU for the Golden
Delicious apple tree were obtained for the years
2001, 2007, 2010 and 2016. When it takes place, the satisfaction of cold needs is later, around mid-February (Fig. 4) and does not really start until the end of November. Everything leads to a dominating importance of the month of January in the course of the endodormancy lifting process and it will be inter-esting to look at what the future climate scenarios give for this particular period for the choice of future apple varieties.
The months of November and December play a precocious role at the Benchicao site (negative corre-lation with the date of bud burst or flowering). This can only be understood if the organogenesis in the buds continues during these two months and there-fore there is no endodormancy at this time. The observed increase in average November and October minimum temperatures (Table 2) is consistent with this. At the site of Benchicao, the month of March is crucial for the precocity, it is the temperatures of this month which allow the growth after the satisfaction of the needs of cold towards the end of December and the beginning of January all the more so as the temperatures of the February remain rather low (and tend towards a cooling). The tendency to tardiness with the site of Benchicao is thus coherent with the cooling in the month of February. The October warm-ing at Sidi Lakhdar site may explain later entry into endodormancy. Gentle temperatures (12°C) in February can then accelerate bud burst and flower-ing, at least for years when cold needs are met. Otherwise endodormancy will be greatly delayed or disrupted. According to the study of Legave et al. (2015), carried out in three geographically contrast-ing countries of the Mediterranean region, in Morocco (Meknes), France (Nimes) and Italy (Forlì) over the last 40 years in order to understand the impact of climate change, especially the increase in temperature, on the Golden Delicious apple tree, the forcing period is shorter in Meknes. Legave et al. (2012) also found a marked trend towards shorter simulated duration of forcing period and late
Fig. 7 - Comparison between the observed and the predicted flowering date of the apple tree at the Benchicao site by the Chuine/Sigmoid model. y = 0.4501x + 57.365; R² = 0.4632.
endodormancy period. The physiological functioning of the Golden Delicious apple tree during the dor-mant and growing season may explain, in part, the regional differences observed in the flowering dates (Heide, 1993). In the same context, Kauffman and Blanke (2018) have reported after a study conducted on three cherry cultivars at different levels of cold needs (minimum, medium and high) that, in optimum chill, the optimum forcing was ca. 8.000 GDH (>12 °C), irrespective of variety, allowing up scaling of the results to possibly other varieties. Overall, the results have shown that diminishing chilling as a result of cli-mate change can be compensated for, in part up to 50%, by a larger amount of forcing to obtain natural flowering in the orchard. These results may explain the good progress of flowering on the site of Sidi Lakhdar, although the cold needs were not often sat-isfied. El Yaacoubi et al. (2014) also reported that spring temperatures appear to be essential for com-plete flowering in mild climates. In the latter case, early full flowering dates occurred when the average temperature during the forcing period rapidly exceeded 15°C provided adequate satisfaction of the cold requirements. Phenological models predicting the occurrence of different phenophases as a func-tion of environmental condifunc-tions (mainly tempera-ture and photoperiod), predict that the global increase in temperature during the winter will slow or even jeopardize the endodormancy emergence due to lack of cold (Chuine et al., 2016). The one-phase and two-one-phase models for all years do not give good results at the Sidi Lakhdar site. This is explained by the negative influence of years when cold unit needs have not been met. If these years are removed, the two-phase Chuine/Sigmoid model for bud burst and flowering gives good results. This may mean that in these cases of partial non-fulfillment of cold unit requirements, the physiological processes involved in bud break-up and flowering are different or that “something” in addition occurs. At Benchicao site, the efficiency of the two-phase models is aver-age, since the requirements in cold units are often met; only the forcing period can have an effect on the precocity.
This study aimed to show the effects of the antici-pated increase in temperature on two phenological phases of the apple tree (Golden Delicious) in two Algerian sites with contrasting climates. We high-lighted contrasting trends by site and by period. Warming at Sidi Lakhdar site in autumn and spring, however, the statistical data of temperatures did not raise any average warming at the Benchicao site.
Rather surprising and never described before, there has been a tendency to cool down some months at the Benchicao site. Critical periods for cold units were identified, concerning the period between November and January at Benchicao site, but January temperatures were more important in lifting endodormancy. At the site of Sidi Lakhdar, buds enter late into endodormancy and the result is a late action of cold that extends until February without always being sufficient. Forced side, it is the tempera-tures of the month of March that have a discriminat-ing effect on bud burst and flowerdiscriminat-ing at the site of Benchicao combined with those of April at the site of Sidi Lakhdar. On this site, despite the warming in April, we do not gain in precocity probably because of a satisfaction of cold needs “to the limits” as describe Legave et al. (2012) for the Nimes region. We have also highlighted, particularly at the site of Sidi Lakhdar that more complex physiological processes must be at work especially the years of low cumulative cold units. It is not excluded that other factors, not included in this work, could be involved in the budburst process such as photoperiod or pre-cipitation (Vitasse et al., 2009; Grab and Craparo, 2011; El Yaacoubi et al., 2014). Except for the two-phase Chuine/Sigmoid budburst and flowering model, which gave better results at Sidi Lakhdar site after the elimination of the years when the cold unit requirements were not met, all the models give rather weak efficiencies indirectly confirming the non-taking into account of a complexity of factors associated with physiological functioning for sites like Sidi Lakhdar’s.
The study of the impact of global warming on the apple tree requires a precise determination of the accumulations in cold units necessary for the emer-gence of endodormancy and budding in various envi-ronments. This involves highlighting these two phas-es by forcing techniquphas-es at the laboratory level and anatomical studies of meristematic bud tissues to see their ability to bud.
References
BAGGIOLINI M., 1952 - Les stades repères dans le dévelop‐
pement annuel de la vigne et leur utilisation pratique. -
Revue Romande d’Agriculture et d’Arboriculture, 8(1): 4-6.
BALAGHI R., 2017 - Le changement climatique dans la
région de Fés‐Meknés. Etat de l’art, vulnérabilité, impact sur les terres et les principales cultures. Résumé à l’attention des décideurs. - I.N.R.A., Rabat, Morrocco,
pp. 1-14.
BEAUBIEN E., HAMANN A., 2011 - Spring flowering
response to climate change between 1936 and 2006 in Alberta, Canada. - BioScience, 61: 514-524.
BENABADJI N., BOUAZZA M., 2000 - Quelques modifica‐
tions climatiques intervenues dans le sud‐ouest del’Oranie (Algérie Occidentale). - Rev. Energ. Ren., 3:
117-125.
BONHOMME M., RAGEAU R., LACOINTE A., 2010 -
Optimization of endodormancy release models using series of endodormancy release data collected in France. - Acta Horticulturae, 872: 51-60.
BOURCHEF M., 2013 - Axes stratégiques en matière de
changements climatiques sur le Nord de l’Algérie. ‐
Rapport sur l’élaboration de la stratégie nationale de GIZC pour l’Algérie, pp. 69.
CAMPOY J.A., RUIZ D., EGEA J., 2011 - Dormancy in tem‐
perate fruit trees in a global warming context : A review. - Sci. Hortic., 130: 357-372.
CHUINE I., 2000 - A unified model for the budburst of trees. - J. Theor. Biol., 207: 337-347.
CHUINE I., 2005 - Un reseau d’observations phenologiques
pour la gestion du changement climatique, pp. 49-58. -
In: LANDMANN G., and S. LANDEAU (eds.) De l’observa‐
tion des écosystèmes forestiers à l’information sur la forêt. Editions Quae, Paris, France, pp. 93.
CHUINE I., BONHOMME M., LEGAVE J.M., de CORTAZAR-ATAURI I.G., CHARRIER G., LACOINTE A., AMEGLIO T., 2016 - Can phenological models predict tree phenology
accurately in the future? The unrevealed hurdle of end dormancy break. ‐ Global Change Biology, 22:
3444-3460.
CHUINE I., de CORTAZAR-ATAURI I.G., KRAMER K., HÄNNI-NEN H., 2013 - Plant development models, pp. 275-293. - In: SCHWARZ M.D. (ed.). Phenology: An integrative
environmental science. Springer, Dordrecht,
Netherlands, pp. 610.
COUVILLON G.A., EREZ A., 1985 - Effect of level and dura‐
tion of high temperatures on rest completion in peach. ‐
J. Am. Soc. Hort. Sci., 110: 79-581.
DANTEC C., 2014 ‐ Caractérisation des contraintes bio‐
tiques et abiotiques sur la phénologie printanière du chêne: expliquer les patrons de diversité et prédire les changements futurs. - Ecologie, Environnement, INRA,
Campus Recherche & Innovation Forêt-Bois, Université de Bordeaux, France, pp. 184.
DOI H., KATANO I., 2008 - Phenological timings of leaf bud‐
burst with climate change in Japan. - Agric. For.
Meteorol., 148(3): 512-516.
EL YAACOUBI A., MALAGI G., OUKABLI A., CITADIN I., BON-HOMME M., HAFIDI M., LEGAVE J.M., 2015 -
Identification de différents modes de dormance chez un arbre fruitier quel enseignement en terme d’adapta‐ tion? - Colloque francophone Phénologie,
Clermont-Ferrand, France.
EL YAACOUBI A., MALAGI G., OUKABLI A., CITADIN I., HAFI-DI M., BONHOMME M., LEGAVE J.M., 2016 -
Differentiated dynamics of bud dormancy and growth intemperate fruit trees relating to bud phenology adap‐ tation, the case of apple and almond trees. - Int. J.
Biometeorol., 60: 1695-1710.
EL YAACOUBI A., MALAGI G., OUKABLI A., HAFIDIA M., LEGAVE J.M., 2014 - Global warming impact on floral
phenology of fruit trees species in Mediterranean region. ‐ Sci. Hortic., 180: 243-253.
EREZ A., COUVILLON G.A., 1987 - Characterization of the
influence of moderate temperatures on rest completion in peach. - J. Am. Soc. Hort. Sci., 112: 677-680.
GIANNAKOPOULOS C., BINDI M., MORIONDO M., Le SAGER P., TIN T., 2005 - Climate change impacts in the
Mediterranean resulting from a 2°C global temperature rise. ‐ WWF, the global conservation organization,
Gland, Switzerland, pp. 75.
GLEIZER B., LEGAVE J.M., BERTHOUMIEU J.F., MATHIEU V., 2007 - Les arboriculteurs face aux changements clima‐
tiques: évolution de la phénologie florale et du risque du gel printanier. - Infos-Ctifl, 235: 37-40.
GORDO O., SANZ J.J., 2010 - Impact of climate change on
plant phenology in Mediterranean ecosystems. - Global
Change Biology, 16(3): 1082-1106.
GRAB S., CRAPARO A., 2011 - Advances of apple and pear
tree full bloom dates in response to climate change in the Southwestern Cape, south Africa: 1973‐2009. -
Agric. For. Meteorol., 151(3): 406-413.
GUERRIERO R., VITI R., MONTELEONE P., GENTILI M., 2002 - Comparison of three different methods for the evalua‐
tion of dormancy in apricot. ‐ Frutticoltura, 3: 73-78.
HADJ SAHRAOUI K., 2014 - Etude sectorielle de l’arboricul‐
ture fruitière et de la viticulture en Algérie. Promotion de plants arboricoles et viticoles certifiables en Algérie, projet de coopération Algero‐Allemand. ‐ Realagro,
ETAF.
HAMDANI M., HAFFAF M., MERZOUGUI H., BENNIOU R., BENKHARBACH N., 2016 - Étude technico‐culturale de
la production du pommier dans les conditions semi‐ arides: cas de M’sila. ‐ Revue Agriculture, N.S., 1:
152-155.
HÄNNINEN H., 1990 - Modelling bud dormancy release in
trees from cool and temperate regions. - Acta For.
Fenn., 213: 1-47.
HEIDE O.M., 1993 - Day length and thermal time responses
of budburst during dormancy release in some northern deciduous trees. - Physiol. Plant., 88: 531-540.
KAUFMANN H., BLANKE M., 2018 - Substitution of winter
chilling by spring forcing for flowering using sweet cherry as model crop. - Sci. Hortic., 244: 75-81.
KHERIEF NACEREDDINE S., ALATOU D., 2004 - Étude du
changement climatique par la variation thermique et ses conséquences sur la pérennité de quelques espèces forestières urbaines dans une région semi‐aride. ‐
Laboratoire de développement et valorisation des res-sources phytogénétiques, Dépt. S.N.V, Université Mentouri Constantine, Algeria.
MENZEL A., 2006 - Guidelines for plant phenological
observations. ‐ WMO/TD, n. 1484, WMO, Geneva,
Switzerland, pp. 16.
KÖRNER C., BASLER D., 2010 - Phenology under global
warming. - Science, 327: 1461-1462.
LABANI A., BENABDELI K., KEFIFA A., 2006 - Climatic fluctu‐
ations and dynamics of land scape occupation in the district of Ain El Hadjar (Saïda, Algeria). ‐ Sécheresse,
17: 391-398.
LEGAVE J.M., 2009 - Comment faire face aux changements
climatiques en arboriculture fruitière? - Innov. Agron.,
7: 165-177.
LEGAVE J.M., BLANKE M., CHRISTEN D., GIOVANNINI D., MATHIEU V., OGER R., 2012 - A comprehensive
overview of the spatial and temporal variability of apple bud dormancy release and blooming phenology in Western Europe. - Int. J. Biometeorol., 57: 317-331.
LEGAVE J.M., CHRISTEN D., GIOVANNINI D, OGER R., 2009 -
Global warming in Europe and its impacts on floral bud phenology in fruit species. - Acta Horticulturae, 838:
21-26.
LEGAVE J.M., GUÉDONY., EL YAACOUBI A., MALAGI G., MATHIEU V., CHRISTEN D., FARRERA I., BONHOMME, M., 2015 - Diversité spatio‐temporelle des change‐
ments de dates de floraison chez le pommier: quel enseignement face à un réchauffement croissant? -
Colloque francophone Phénologie, Clermont-Ferrand, France.
LICHOU J., EDIN M., TRONEL C., SOUNER R., 1990 - Le ceri‐
sier. - CTIFL, Paris, France.
MALAGI G., 2014 - Flowering phenology and dormancy
dynamics of apple tree in contrasting climatic condi‐ tions: a case study of phenology modeling in the cli‐ mate warming context. - These Doctorat, Université de
Montpellier, France, pp. 160.
MEIER U., 1997 - Growth stages of Mono‐ and
Dicotyledons plants. - BBCH Monograph, Blackwell
Wissenschafts, Verlag, Berlin, Germany.
MEIER U., BLEIHOLDER H., BUHR L., FELLER C., HACK H., HESS M., LANCASHIRE P.D., SCHNOCK U., STAUSS R., VAN DEN BOOM T., WEBER E., ZWERGER P., 1997 -
BBCH‐Monograph. Growth stages of plants - Entwicklungs stadien von Pflanzen ‐ Estadios de las plantas ‐ Développement des Plantes. - Blackwell
Wissenschaftsverlag, Berlin, Germany, pp. 622.
MEIER U., BLEIHOLDER H., WEBER E., FELLER C., HESS M., WICKE AVENTIS H., VAN DEN BOOM T., LANCASHIRE P.D., BUHR L., HACK H., KLOSE R., STAUSS R., 2001 -
Stades phénologiques des mono‐et dicotylédones culti‐ vées. BBCHMonographie. 2nd ed. - Centre Fédéral de
Recherches Biologiques pour l`Agriculture et les Forêts. MEIER U., GRAF H., HACK H., HESS M., KENNEL W., KLOSE
R., MAPPES D., SEIPP D., STAUSS R., STREIF J., VAN DEN BOOM T., 1994 - Phänologische Entwicklungsstadien
des Kernobstes (Malus domestica Borkh. und Pyrus
communis L.), des Steinobstes (Prunus‐Arten), der
Johannisbeere (Ribes‐Arten) und der Erdbeere (Fragaria
x ananassa Duch.). - Nachrichtenbl. Deut. Pflanzen-schutzd, 46(7): 141-153.
MERADI R., 2015 - Utilisation des sucres et virus de la gra‐
nulose pour la lutte contre le carpocapse (Cydia
pomo-nella L.) (Lepidoptera, Tortricidae) en verger de pom‐
mier situé dans la région de Lambiridi (Wilaya de Batna). ‐ Thèse Magister, Institut des sciences
vétéri-naires et des sciences agronomiques, Université El Hadj Lakhdar, Batna, Algeria.
MORIN X., ROY J., SONIÉ L., CHUINE I., 2010 - Changes in
leaf phenology of three European oak species in response to experimental climate change. - New
Phytol., 186: 900-910.
MORIONDO M., BINDI M., 2008 - Impact of climate change
on the phenology of typical Mediterranean crops. - Ital.
J. Agrometeorol., Scientific Section, XXX(3): 5-12. OVERCASH J.P., CAMPBELL J.A., 1955 - The effect of inter‐
mittent warm and cold periods on breaking the rest period of peach buds. - Proc. Am. Soc. Hort. Sci., 66:
87-92.
POLGAR C.A., PRIMACK R.B., 2011 - Leaf‐out phenology of
temperate woody plants: from trees to ecosystems. ‐
New Phytol., 191: 926-941.
RICARD M.P., 2014 - Vérification de modèles phenolo‐
giques durant la dormance des bourgeons de pommier et analyse de l’expression de gènes possiblement reliés à la dormance. - Mémoire, Maîtrise en Biologie,
Université du Québec à Montréal, Canada, pp. 96 (in french language).
RICHARDSON A.D., KEENAN T.F., MIGLIAVACCA M., RYU, Y., SONNENTAG O., TOOMEY M., 2013 - Climat change
phenology, and phenological control of vegetation feedbacks to the climate system. - Agr. Forest
Meteorol. 169: 156-173.
RICHARDSON E.A., SEELEY S.D., WALKER D.R., 1974 - A
model for estimating the completion of rest for ‘Redhaven’ and ‘Elberta’ peach trees. - HortScience, 9:
331-332.
SEGUIN B., 2010 - Climate change and its impact on agri‐
cultural production, with a focus on the Mediterranean area, pp. 9-18. - In: LÓPEZ-FRANCOS A. (ed.) Economics of drought and drought preparedness in a climate change context. CIHEAM, Options Méditerranéennes,
Série A. Séminaires Méditerranéens, Zaragoza, Spain, n. 95.
TABET S., 2008 - Le Changement climatique en Algérie
orientale et ses conséquences sur la végétation fores‐ tières. - Ecologie végétale, Université Mentouri
Constantine, Algeria.
TABET-AOUL M., 2000 - Vulnérabilité et adaptation de
l’agriculture au changement climatique en Algérie à l’horizon 2020. ‐ ARCE. Association de recherche sur
l’environnement et le climat d’Oran, Projet RAB /94/G31.
TABET-AOUL M., BESSAOUD R., 2009 - Adapter les agricul‐
tures au changement climatique, pp.101-136. In: MediTERRA2009 Repenser le développement rural en
Méditerranée. ‐ CIHEAM et Plan Bleu, Presses de
Sciences Po, France, pp. 392.
VITASSE Y., DELPIERRE N., FRANÇOIS C., DUFRENE E., CHUINE I., KREMER A., DELZON S., 2009 - Évaluer et
prédire l’impact du changement climatique sur la phé‐ nologie des arbres le long d’un gradient altitudinal dans le Pyrénées. ‐ GDR Phénologie 2009, 21-22 Octobre,
Montpellier, France.
WANG E., ENGEL T., 1998 - Simulation of phenological
development of wheat crops. - Agr. Syst., 58: 1-24.
WENDEN B., BARRENECHE T., MELAND M., BLANKE M., 2017 - Harmonisation of phenology stages and selected
cherry cultivars as bioindicators for climate change. -
Acta Horticulture, 1162: 9-12.
ZEKRI D., LEHOUT A., SOUILAH N., ALATOU D., 2009 - Étude
des variations thermiques saisonnière dans les régions semi‐arides. - Laboratoire de Développement et
Valorisation des Ressources Phytogénétiques, Faculté des Sciences de la Nature et de la Vie. Université Mentouri Constantine, Algeria.