HAL Id: inria-00400684
https://hal.inria.fr/inria-00400684
Submitted on 1 Jul 2009
HAL is a multi-disciplinary open access
archive for the deposit and dissemination of
sci-entific research documents, whether they are
pub-lished or not. The documents may come from
teaching and research institutions in France or
abroad, or from public or private research centers.
L’archive ouverte pluridisciplinaire HAL, est
destinée au dépôt et à la diffusion de documents
scientifiques de niveau recherche, publiés ou non,
émanant des établissements d’enseignement et de
recherche français ou étrangers, des laboratoires
publics ou privés.
distributed system: usage of the Grid’5000 platform in
2007
Anne-Cécile Orgerie, Laurent Lefèvre
To cite this version:
Anne-Cécile Orgerie, Laurent Lefèvre. A year in the life of a large-scale experimental distributed
system: usage of the Grid’5000 platform in 2007. [Research Report] RR-6965, INRIA. 2009, pp.35.
�inria-00400684�
a p p o r t
d e r e c h e r c h e
INRIA/RR--6965--FR+ENG
Thème NUM
A year in the life of a large-scale experimental
distributed system: usage of the Grid’5000 platform
in 2007
Anne-Cécile Orgerie — Laurent Lefèvre
N° 6965
distributed system: usage of the Grid’5000
platform in 2007
Anne-C´
ecile Orgerie , Laurent Lef`
evre
Th`eme NUM — Syst`emes num´eriques Projet Reso
Rapport de recherche n➦ 6965 — April 2009 —32pages
Abstract: This report presents the usage results of Grid’5000 over year 2007. Usage of the main operationnal Grid’5000 sites (Bordeaux, Lille, Lyon, Nancy, Orsay, Rennes, Sophia-Antipolis, Toulouse) is presented and analyzed.
exp´
erimental `
a grande ´
echelle : l’utilisation de
la plate-forme Grid’5000 en 2007
R´esum´e : Ce rapport pr´esente les r´esultats d’utilisation de la plateforme exp´erimentale Grid’5000 pendant l’ann´ee 2007. L’usage des principaux sites op´erationnels de Grid’5000 (Bordeaux, Lille, Lyon, Nancy, Orsay, Rennes, Sophia-Antipolis, Toulouse) est pr´esent´e et analys´e.
Contents
1 Introduction 4
2 Definitions and Methodology 4
2.1 Grid’5000: a Large-Scale Experimental Distributed System . . . 4
2.2 Experiment Methodology . . . 5
3 Grid’5000’s usage per site 5 3.1 Overall statistics . . . 5
3.2 Results per Grid’5000 site . . . 6
3.2.1 Usage of Grid’5000’s Bordeaux site in 2007 . . . 7
3.2.2 Usage of Grid’5000’s Lille site in 2007 . . . 10
3.2.3 Usage of Grid’5000’s Lyon site in 2007 . . . 12
3.2.4 Usage of Grid’5000’s Nancy site in 2007 . . . 15
3.2.5 Usage of Grid’5000’s Orsay site in 2007 . . . 17
3.2.6 Usage of Grid’5000’s Rennes site in 2007. . . 20
3.2.7 Usage of Grid’5000’s Sophia site in 2007 . . . 22
3.2.8 Usage of Grid’5000’s Toulouse site in 2007. . . 25
3.2.9 Results summary . . . 27
4 A focus on Grid jobs 28
5 Conclusion 29
List of Figures 31
1
Introduction
Some previous work on operational Grids [IDE+06] show that grids are not utilized at their full capacity. We focus on the utilization of a large-scale exper-imental distributed system by relying on the case study of Grid’5000[Cea05]1, a French experimental Grid. We collected and analyzed the logs of the Grid’5000 platform for a full year of usage (2007). We present the main statistics observed for each site and some specific and representative computing nodes. A spe-cial analysis is dedicated to the grid usage of this experimental platform. This usage analysis has been used in some works on energy-efficient experimental distributed infrastructures [OLG08a,OLG08b].
This paper briefly presents the Grid’5000 experimental platform and the followed methodology in Section2. The usage statistics are then presented for each Grid’5000 site (Section3) and for grid jobs (Section4). A small conclusion in Section5 summarizes the main observed results.
2
Definitions and Methodology
2.1
Grid’5000: a Large-Scale Experimental Distributed
System
The Grid’5000 platform is an experimental testbed dedicated for research in computer science, made up of more than 3400 processors geographically dis-tributed on 9 sites in France (see Fig. 1). This platform can be defined as a highly reconfigurable, controllable, and monitorable experimental large-scale distributed system.
Figure 1: The Grid’5000 map
The utilization of Grid’5000 is very specific. Each user can reserve (in ad-vance) some computing nodes. During its reservation time, the user can be root on his reserved nodes and he can deploy his own system images, collect data,
1Some experiments of this article were performed on the Grid’5000 platform, an initiative
from the French Ministry of Research through the ACI GRID incentive action, INRIA, CNRS and RENATER and other contributing partners (http://www.grid5000.fr). This research is supported by the GREEN-NET INRIA Cooperative Research Action:http://www.ens-lyon. fr/LIP/RESO/Projects/GREEN-NET/
launch applciations, reboot, and so on. The nodes are entirely dedicated to the user during his reservation.
2.2
Experiment Methodology
The user gives the resource manager (at least) a start time, a duration, and the number of required resources. These characteristics define the job (a reserva-tion). The resource manager is in charge of the job’s acceptance. It verifies if that job is compatible with previously accepted jobs and, if it is, it gives a job id to the user.
When a resource is not available for the user, it can be in different states: ❼ dead: the resource is down (due to a component failure for example); ❼ suspected: the resource does not work properly;
❼ absent: the resource is not available for the user (not physically present, still in the box for example).
Moreover, the platform has changed between the beginning and the end of the measurements. For that reason, we present the results as percentages of the platform’s capacity at the time of measurement (100% at a given time does not represent the same number of resources as 100% at another time).
In order to obtain the utilization traces, we have used a history function provided by OAR2 [CCG+05] called oarstat. This function provides the user with all the events that occur during a time period. An event can be a job or a problem on a resource (it is dead, absent or suspected) for a given period. Our goal is to obtain a detailed overview of the usage of an experimental grid.
3
Grid’5000’s usage per site
3.1
Overall statistics
We have made some statistics per site and some more for grid jobs (the jobs which take place on several sites at the same time). The studied period starts on the 1st January 2007 (at 00:00:00) and finishes on the 6th January 2008 (at 23:59:59).
As the platform varies during time (node additions), the number of resources also varies depending on the time (see Figure2). We have taken this into account to calculate the different statistics. So the maximal number of resources refers to the number of resources at the end of the experiments.
Figure 2: Platform evolution in terms of number of resource (cores) over year 2007
3.2
Results per Grid’5000 site
For each site, we provide several values and figures which represent the global usage of the site. All the times are given in seconds. A resource is a core and a job is actually a reservation.
We have split the proposed statistics in three categories:
❼ the “platform and resources” part which lists the available number of resources and some statistics on the resources’ states. We also compute the real work time of the Grid’5000 site. The “real” percentage of work time is calculated without taking into account dead time or absent time (i.e. work time over total time minus dead time and absent time for all the resources).
❼ the “jobs” part proposes some statistics on the number of submitted jobs (reservations), the mean time and mean number of resources per job, and the maximal duration of a job on a site. We also list the number of reservations used for deploying system images (deploy jobs)
❼ the “users” section contains the number of users and the impact of users from other Grid’5000 sites. The percentage of users coming from other sites does not take into account any consideration of proportionality in terms of jobs. It is just the number of users coming from other sites over the total number of users (each user is counted once).
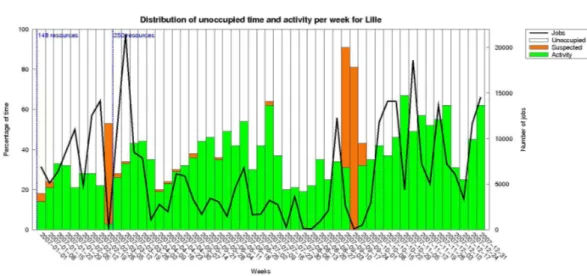
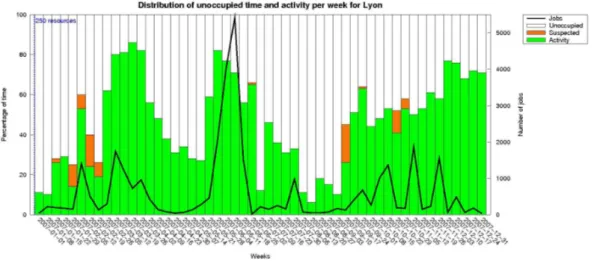
For each site, we provide four diagrams. The first one represents the weekly repartition in time of the resources between the different states: in red when some cores are dead (Dead state), in orange when they are suspected (Suspected state), in yellow when they are absent (Absent state), in green when they are working (a job is running) (Work state), and in white when they are unoccupied (no job, no other state) (Idle state).
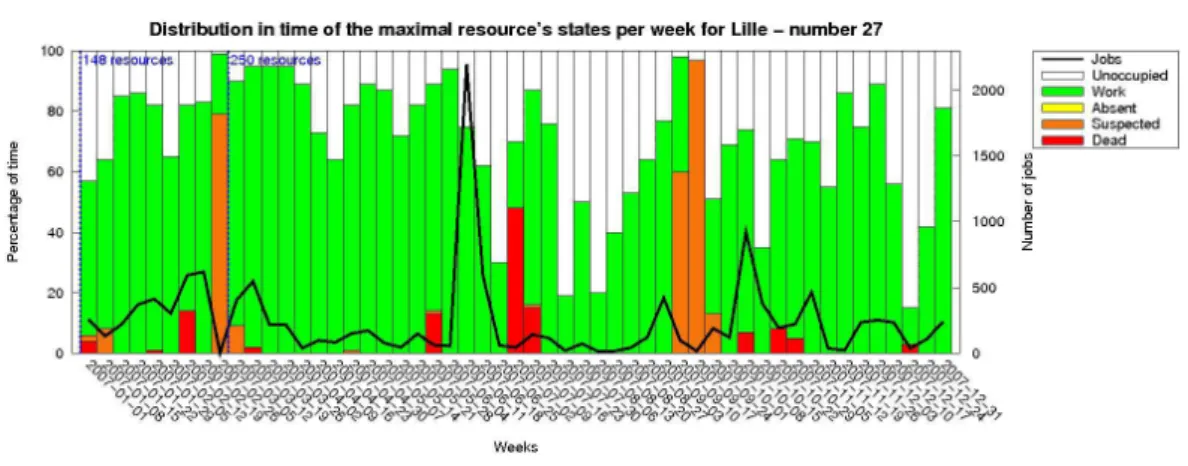
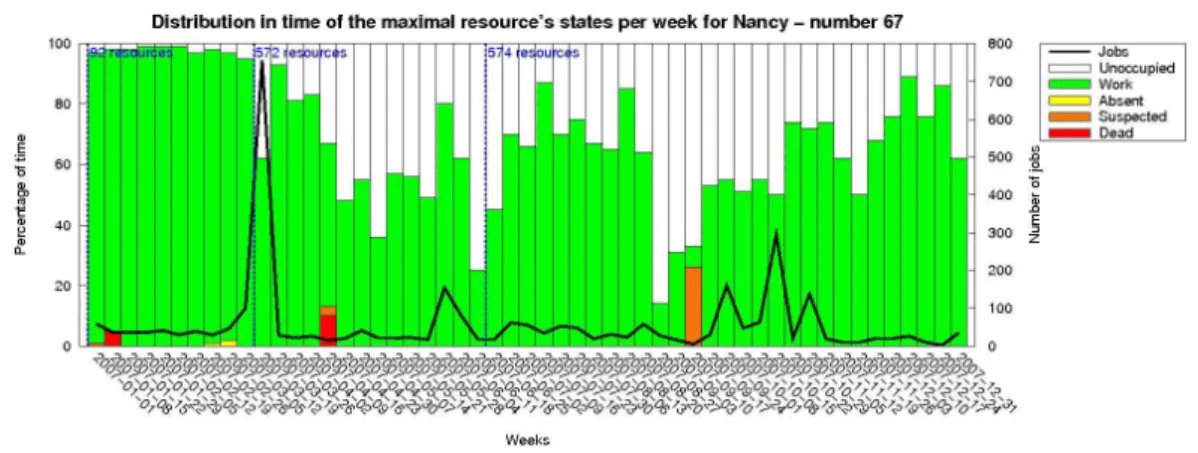
The two other diagrams present the weekly time repartition of two particular resources: the median and the maximal resources. The maximal resource is the resource which has the maximal work time among the resources which are present for the whole 2007 year. The median resource is a resource which is present for the whole 2007 year and is the nearest to the median value of cumulative work over the experiment’s duration.
3.2.1 Usage of Grid’5000’s Bordeaux site in 2007 ❼ Platform and resources:
– Maximal number of resources (cores): 650
– Mean time spent in each state for all the resources, in percentage: ✯ Dead: 20.78%
✯ Suspected: 1.40% ✯ Absent: 0.65% ✯ Work: 37.55%
– Real percentage of work time (without taking into account the time when the resources are dead or absent): 47.80%
❼ Jobs:
– Number of jobs (reservations): 45775
– Mean time of a job: 5224.59 (1 hour 27 minutes and 5 seconds) – Maximal duration: 454584 (5 days 6 hours 16 minutes and 24
sec-onds) for job number 56231
– Mean number of resources (cores) per job: 55.50 – Number of ‘deploy’ jobs: 1678 (3.67% of the jobs) – Percentage of jobs coming from other sites: 0.53% ❼ Users:
– Number of users: 174
– Percentage of users coming from other sites: 85.06%
For this site, we can notice a period of more than three months during which all the resources are dead: this is due to an air-cooling problem. As the percentage of ‘real’ work does not take into account the dead and absent time, this dead period is not considered in this percentage.
Figure 3: Global diagram with dead time for Grid’5000’s Bordeaux site
Figure 5: Median resource diagram for Grid’5000’s Bordeaux site
3.2.2 Usage of Grid’5000’s Lille site in 2007 ❼ Platform and resources:
– Maximal number of resources (cores): 250
– Mean time spent in each state for all the resources, in percentage: ✯ Dead: 9.30%
✯ Suspected: 4.31% ✯ Absent: 0.89% ✯ Work: 32.73%
– Real percentage of work time (without taking into account the time when the resources are dead or absent): 36.44%
❼ Jobs:
– Number of jobs (reservations): 330694
– Mean time of a job: 1446.13 (24 minutes and 6 seconds)
– Maximal duration: 648019 (7 days 12 hours and 19 seconds) for job number 318486
– Mean number of resources (cores) per job: 4.81 – Number of ‘deploy’ jobs: 2172 ( 0.66% of the jobs) – Percentage of jobs coming from other sites: 0.08% ❼ Users:
– Number of users: 181
– Percentage of users coming from other sites: 74.59%
Figure 8: Global diagram without dead time for Grid’5000’s Lille site
This site has got the largest number of jobs over year 2007. However, it has the smallest mean job length (less than 25 minutes): there are a lot of ‘small’ jobs on this site.
Also, the two resource views clearly show an important disparity between the usage of the different resources.
Figure 10: Maximal resource diagram for Grid’5000’s Lille site
3.2.3 Usage of Grid’5000’s Lyon site in 2007 ❼ Platform and resources:
– Maximal number of resources (cores): 322
– Mean time spent in each state for all the resources, in percentage: ✯ Dead: 13.76%
✯ Suspected: 1.75% ✯ Absent: 0.86% ✯ Work: 39.60%
– Real percentage of work time (without taking into account the time when the resources are dead or absent): 46.38%
❼ Jobs:
– Number of jobs (reservations): 33315
– Mean time of a job: 3246.15 (54 minutes and 6 seconds)
– Maximal duration: 1235695 (14 days 7 hours 14 minutes and 55 seconds) for job number 48942
– Mean number of resources (cores) per job: 41.64 – Percentage of jobs coming from other sites: 0.74% – Number of ‘deploy’ jobs: 2690 ( 8.07% of the jobs) ❼ Users:
– Number of users: 147
– Percentage of users coming from other sites: 71.43%
On the first diagram, we can see the effect of vacations: resources are less used in August, in September, and during the Christmas holidays. This is noticeable even on the most used resource.
Figure 11: Global diagram with dead time for Grid’5000’s Lyon site
Figure 13: Median resource diagram for Grid’5000’s Lyon site
3.2.4 Usage of Grid’5000’s Nancy site in 2007 ❼ Platform and resources:
– Maximal number of resources (cores): 574
– Mean time spent in each state for all the resources, in percentage: ✯ Dead: 1.49%
✯ Suspected: 2.76% ✯ Absent: 0.15% ✯ Work: 55.37%
– Real percentage of work time (without taking into account the time when the resources are dead or absent): 56.41%
❼ Jobs:
– Number of jobs (reservations): 63435
– Mean time of a job: 19480.49 (5 hours 24 minutes and 40 seconds) – Maximal duration: 979934 (11 days 8 hours 12 minutes and 14
sec-onds) for job number 79493
– Mean number of resources (cores) per job: 22.46 – Percentage of jobs coming from other sites: 0.16% – Number of ‘deploy’ jobs: 2366 ( 3.73% of the jobs) ❼ Users:
– Number of users: 154
Figure 16: Global diagram without dead time for Grid’5000’s Nancy site
We can observe a great stability on this site: few dead periods, a small number of jobs, but long ones (the longest mean length for a job), a high per-centage of utilization, and all the resources are used as we can see on the three resource views. The workload is well balanced over the resources. We observe also two and a half months of intensive activity: from January to the middle of March, over 95% of activity most of the time.
Figure 18: Maximal resource diagram for Grid’5000’s Nancy site
3.2.5 Usage of Grid’5000’s Orsay site in 2007 ❼ Platform and resources:
– Maximal number of resources (cores): 684
– Mean time spent in each state for all the resources, in percentage: ✯ Dead: 3.15%
✯ Suspected: 2.69% ✯ Absent: 0.99% ✯ Work: 18.10%
– Real percentage of work time (without taking into account the time when the resources are dead or absent): 18.88%
❼ Jobs:
– Number of jobs (reservations): 26448
– Mean time of a job: 4322.54 (1 hour 12 minutes and 3 seconds) – Maximal duration: 864008 (10 days and 8 seconds) for job number
52307
– Mean number of resources (cores) per job: 47.45 – Percentage of jobs coming from other sites: 0.89% – Number of ‘deploy’ jobs: 4447 ( 16.81% of the jobs) ❼ Users:
Figure 19: Global diagram with dead time for Grid’5000’s Orsay site
Figure 21: Median resource diagram for Grid’5000’s Orsay site
3.2.6 Usage of Grid’5000’s Rennes site in 2007 ❼ Platform and resources:
– Maximal number of resources (cores): 714
– Mean time spent in each state for all the resources, in percentage: ✯ Dead: 2.45%
✯ Suspected: 1.09% ✯ Absent: 0.87% ✯ Work: 48.21%
– Real percentage of work time (without taking into account the time when the resources are dead or absent): 49.87%
❼ Jobs:
– Number of jobs (reservations): 36433
– Mean time of a job: 7973.39 (2 hours 12 minutes and 53 seconds) – Maximal duration: 702342 (8 days 3 hours 5 minutes and 42 seconds)
for job number 192011
– Mean number of resources (cores) per job: 54.85 – Percentage of jobs coming from other sites: 0.90% – Number of ‘deploy’ jobs: 3132 ( 8.60% of the jobs) ❼ Users:
– Number of users: 194
– Percentage of users coming from other sites: 81.96%
Figure 24: Global diagram without dead time for Grid’5000’s Rennes site
This site is well used in terms of percentage of real work. We can notice several bursts of usage in terms of number of jobs per week, and in particular, one reaches more than 4000 jobs for one week. So there are a lot of small jobs during these periods in terms of both time and number of resources used.
We can see that after the addition of new resources in October, the median resources are not used anymore. The users reserve the new available machines instead.
Figure 26: Maximal resource diagram for Grid’5000’s Rennes site
3.2.7 Usage of Grid’5000’s Sophia site in 2007 ❼ Platform and resources:
– Maximal number of resources (cores): 568
– Mean time spent in each state for all the resources, in percentage: ✯ Dead: 5.41%
✯ Suspected: 1.19% ✯ Absent: 0.13% ✯ Work: 48.58%
– Real percentage of work time (without taking into account the time when the resources are dead or absent): 51.43%
❼ Jobs:
– Number of jobs (reservations): 35179
– Mean time of a job: 4890.28 (1 hour 21 minutes and 30 seconds) – Maximal duration: 900021 (10 days 10 hours and 21 seconds) for job
number 295097
– Mean number of resources (cores) per job: 57.93 – Percentage of jobs coming from other sites: 0.64% – Number of ‘deploy’ jobs: 2572 ( 7.31% of the jobs) ❼ Users:
– Number of users: 183
– Percentage of users coming from other sites: 81.97%
We see on the different diagrams that there are four distinct periods of more intensive work: usage is really bursty. This is a characteristic of experi-mental Grids.
Figure 27: Global diagram with dead time for Grid’5000’s Sophia site
Figure 29: Median resource diagram for Grid’5000’s Sophia site
3.2.8 Usage of Grid’5000’s Toulouse site in 2007 ❼ Platform and resources:
– Maximal number of resources (cores): 434
– Mean time spent in each state for all the resources, in percentage: ✯ Dead: 1.38%
✯ Suspected: 4.41% ✯ Absent: 1.12% ✯ Work: 49.30%
– Real percentage of work time (without taking into account the time when the resources are dead or absent): 50.57%
❼ Jobs:
– Number of jobs (reservations): 20832
– Mean time of a job: 7420.07 (2 hours 3 minutes and 40 seconds) – Maximal duration: 955177 (11 days 1 hour 19 minutes and 37
sec-onds) for job number 85103
– Mean number of resources (cores) per job: 12.89 – Percentage of jobs coming from other sites: 0.59% – Number of ‘deploy’ jobs: 818 ( 3.93% of the jobs) ❼ Users:
– Number of users: 161
– Percentage of users coming from other sites: 75.78%
Figure 32: Global diagram without dead time for Grid’5000’s Toulouse site
Figure 34: Maximal resource diagram for Grid’5000’s Toulouse site
3.2.9 Results summary
Tables1,2,3, summarize the main observed statistics: ❼ Platform and resources:
Site Number of resources (cores) Percentage of ‘real’ activity
Bordeaux 650 47.80% Lille 250 36.44% Lyon 322 46.38% Nancy 574 56.41% Orsay 684 18.88% Rennes 714 49.87% Sophia 568 51.43% Toulouse 434 50.57%
❼ Jobs: Site Number of jobs (reser-vations) Mean num-ber of resources per job Mean dura-tion of a job in seconds Jobs from other sites ‘deploy’ jobs Bordeaux 45775 55.50 5224.59 0.53% 3.67% Lille 330694 4.81 1446.13 0.08% 0.66% Lyon 33315 41.64 3246.15 0.74% 8.07% Nancy 63435 22.46 19480.49 0.16% 3.73% Orsay 26448 47.45 4322.54 0.89% 16.81% Rennes 36433 54.85 7973.39 0.90% 8.60% Sophia 35179 57.93 4890.28 0.64% 7.31% Toulouse 20832 12.89 7420.07 0.59% 3.93%
Table 2: Job-related statistics ❼ Users:
Site Number of users Users from other sites
Bordeaux 174 85.06% Lille 181 74.59% Lyon 147 71.43% Nancy 154 83.12% Orsay 189 81.48% Rennes 194 81.96% Sophia 183 81.97% Toulouse 161 75.78%
Table 3: User-related statistics
4
A focus on Grid jobs
We have made some statistics on grid jobs where at least two jobs run on different sites with the same user and which have at least five minutes in common during their execution time. This means that a user has launched at least two jobs on at least two different sites and they are simultaneous for at least five minutes.
With this definition, we have looked for grid jobs in the traces used pre-viously. For the same period (from the 1st January 2007 at 00:00:00 to the 6th January 2008 at 23:59:59), we have counted 208 different users who have launched grid jobs. The mean number of resources used per grid job is 57.69 and the mean duration of a grid job is 11922.76 seconds (3 hours 18 minutes and 42 seconds).
We have detailed these statistics per site:
These statistics vary from one site to another, but taken as a whole, the grid jobs use a lot of resources (60 in total average) and last a long time (more
Site Mean number of resources Mean duration of a grid job
per grid job (sec.)
Bordeaux 64.07 15406.22 Lille 45.90 9674.48 Lyon 51.02 9396.19 Nancy 79.65 21082.16 Orsay 47.25 12494.29 Rennes 57.33 11772.41 Sophia 66.38 9082.74 Toulouse 34.64 9911.03
Table 4: Grid jobs statistics
than three hours in average) when compared to all the jobs, using the results presented in the previous paragraphs.
Figure35shows the number of computing hours by week and by site spent by the grid jobs. The first graph presents the grid jobs per site in hours for the histogram and in number for the black line. The red line shows the total number of work hours for all the sites per week. This red line is detailed per site on the second graph.
The second histogram shows the number of work hours per site and per week. The black line represents the total number of jobs per week. This gives a global view of the grid.
As in the previous statistics, the number of jobs is not directly correlated with the work time. We can see that the global proportion of grid jobs is important.
5
Conclusion
The Grid’5000 platform is an important framework for doing research on large-scale distributed systems. During year 2007, we have observed some bursts and gaps in Grid’5000’s usage depending on the sites, timing effects (vacations), platform context (dead machines) and user locality.
Figure 35: Computing hours of the grid jobs and of all the jobs per week and per site
List of Figures
1 The Grid’5000 map. . . 4
2 Platform evolution in terms of number of resource (cores) over year 2007 . . . 6
3 Global diagram with dead time for Grid’5000’s Bordeaux site . . 8
4 Global diagram without dead time for Grid’5000’s Bordeaux site 8
5 Median resource diagram for Grid’5000’s Bordeaux site . . . 9
6 Maximal resource diagram for Grid’5000’s Bordeaux site . . . 9
7 Global diagram with dead time for Grid’5000’s Lille site . . . 10
8 Global diagram without dead time for Grid’5000’s Lille site . . . 11
9 Median resource diagram for Grid’5000’s Lille site . . . 11
10 Maximal resource diagram for Grid’5000’s Lille site. . . 12
11 Global diagram with dead time for Grid’5000’s Lyon site. . . 13
12 Global diagram without dead time for Grid’5000’s Lyon site . . . 13
13 Median resource diagram for Grid’5000’s Lyon site . . . 14
14 Maximal resource diagram for Grid’5000’s Lyon site . . . 14
15 Global diagram with dead time for Grid’5000’s Nancy site . . . . 15
16 Global diagram without dead time for Grid’5000’s Nancy site . . 16
17 Median resource diagram for Grid’5000’s Nancy site . . . 16
18 Maximal resource diagram for Grid’5000’s Nancy site. . . 17
19 Global diagram with dead time for Grid’5000’s Orsay site . . . . 18
20 Global diagram without dead time for Grid’5000’s Orsay site . . 18
21 Median resource diagram for Grid’5000’s Orsay site. . . 19
22 Maximal resource diagram for Grid’5000’s Orsay site . . . 19
23 Global diagram with dead time for Grid’5000’s Rennes site . . . 20
24 Global diagram without dead time for Grid’5000’s Rennes site. . 21
25 Median resource diagram for Grid’5000’s Rennes site . . . 21
26 Maximal resource diagram for Grid’5000’s Rennes site . . . 22
27 Global diagram with dead time for Grid’5000’s Sophia site. . . . 23
28 Global diagram without dead time for Grid’5000’s Sophia site . . 23
29 Median resource diagram for Grid’5000’s Sophia site . . . 24
30 Maximal resource diagram for Grid’5000’s Sophia site . . . 24
31 Global diagram with dead time for Grid’5000’s Toulouse site . . 25
32 Global diagram without dead time for Grid’5000’s Toulouse site. 26
33 Median resource diagram for Grid’5000’s Toulouse site . . . 26
34 Maximal resource diagram for Grid’5000’s Toulouse site . . . 27
35 Computing hours of the grid jobs and of all the jobs per week and per site . . . 30
References
[CCG+
05] Nicolas Capit, Georges Da Costa, Yiannis Georgiou, Guillaume Huard, Cyrille Martin, Gr´egory Mouni´e, Pierre Neyron, and Olivier Richard. A batch scheduler with high level components. In Cluster
[Cea05] F. Cappello et al. Grid’5000: A large scale, reconfigurable, contro-lable and monitorable grid platform. In 6th IEEE/ACM Interna-tional Workshop on Grid Computing, Grid’2005, Seattle, Washing-ton, USA, Nov. 2005.
[IDE+06] A. Iosup, C. Dumitrescu, D. Epema, Hui Li, and L. Wolters. How are
real grids used? the analysis of four grid traces and its implications. In 7th IEEE/ACM International Conference on Grid Computing, September 2006.
[OLG08a] Anne-C´ecile Orgerie, Laurent Lef`evre, and Jean-Patrick Gelas. Chasing gaps between bursts : Towards energy efficient large scale experimental grids. In PDCAT 2008 : The Ninth International Conference on Parallel and Distributed Computing, Applications and Technologies, Dunedin, New Zealand, December 2008.
[OLG08b] Anne-C´ecile Orgerie, Laurent Lef`evre, and Jean-Patrick Gelas. Save watts in your grid: Green strategies for energy-aware framework in large scale distributed systems. In 14th IEEE International Con-ference on Parallel and Distributed Systems (ICPADS), Melbourne, Australia, December 2008.
Unité de recherche INRIA Futurs : Parc Club Orsay Université - ZAC des Vignes 4, rue Jacques Monod - 91893 ORSAY Cedex (France)
Unité de recherche INRIA Lorraine : LORIA, Technopôle de Nancy-Brabois - Campus scientifique 615, rue du Jardin Botanique - BP 101 - 54602 Villers-lès-Nancy Cedex (France)
Unité de recherche INRIA Rennes : IRISA, Campus universitaire de Beaulieu - 35042 Rennes Cedex (France) Unité de recherche INRIA Rocquencourt : Domaine de Voluceau - Rocquencourt - BP 105 - 78153 Le Chesnay Cedex (France)