Annals of Oncology 14: 313–322, 2003
Original article
DOI: 10.1093/annonc/mdg059© 2003 European Society for Medical Oncology
Cancer prevalence in Central Europe: the EUROPREVAL Study
J. M. Lutz
1*, S. Francisci
2, E. Mugno
3, M. Usel
1, V. Pompe-Kirn
4, J.-W. Coebergh
5& M. Bieslka-Lasota
6On behalf of the EUROPREVAL Working Group†
*Correspondence to: Dr J. M. Lutz, Registre Genevois des Tumeurs, 55 Bvd de la Cluse, CH-1205 Geneve, Suisse. Tel: +41-2232-910-11; Fax: +41-2232-829-33; E-mail: [email protected] †Members of the EUROPREVAL Working Group are listed in the Acknowledgements.
1
Institut de Médecine Sociale et Préventive, Université de Genève, Switzerland; 2
Lab. Epidemiologia e Biostatistica, Istituto Superiore di Sanità, Roma, Italy;
3
Istituto di Tumori, Milano, Italy; 4
Institute of Oncology, Cancer Registry of Slovenia, Ljubljana, Slovenia; 5
Department of Public Health, Erasmus University Medical Centre, Rotterdam, The Netherlands; 6
M. Sklodowska-Curie Cancer Center, Warszawa, Poland Received 3 April 2002; revised 8 August 2002; accepted 10 September 2002
Background: Information on cancer prevalence is either absent or largely unavailable for central European countries.
Materials and methods: Austria, Germany, The Netherlands, Poland, Slovakia, Slovenia and Switzerland cover a population of 13 million inhabitants. Cancer registries in these countries supplied incidence and survival data for 465 000 cases of cancer. The prevalence of stomach, colon, rectum, lung, breast, cervix uteri, corpus uteri and prostate cancer, as well as skin melanoma, Hodgkin’s disease, leukaemia and all malignant neoplasms combined was estimated for the end of 1992.
Results: A large heterogeneity was observed within central European countries. For all cancers combined, estimates ranged from 730 per 100 000 in Poland (men) to 3350 per 100 000 in Germany (women). Overall cancer prevalence was the highest in Germany and Switzerland, and the lowest in Poland and Slovenia. In Slovakia, prevalence was higher than average for men and lower than average for women. This was observed for almost all ages. As shown by incidence data, breast cancer was the most frequent malignancy among women in all countries. Among men, prostate cancer was the leading malignancy in Germany, Austria and Switzerland, and lung cancer was the major cancer in Slovenia, Slovakia and Poland. The Netherlands had a high prevalence of both prostate and lung cancer. Time-related magnitude of prevalence within each country and the variability of such proportions across the countries has been estimated and cancer prevalence is given by time since diagnosis (1 year, 1–5 years, 5–10 years, >10 years) for each site. The weight of 1-year prevalence (248 per 100 000 among men and 253 per 100 000 among women) was <15% of total prevalence. Prevalent cases between 1 and 5 years since diagnosis represented between 22% and 34% of the total pre-valence. Prevalent cases diagnosed from 5 to 10 years before (335 per 100 000 for men and 505 per 100 000 for women) represented between 17% and 23% of prevalent cancers. Finally, long-term cancer prevalence (diagnosed >10 years before), reflecting long-term survival, and number of people considered as cured from cancer were 490 per 100 000 for men and 1028 per 100 000 for women, with a range between 26% (The Netherlands, men) and 50% (Slovakia, women).
Conclusion: It is clear from observing countries in Central Europe, that high cancer prevalence is associated with well-developed economies. This burden of cancer could be interpreted as a paradoxical effect of better treatments and thereby survival. It could also be taken as a sign for not being satisfied with the advances in treating patients diagnosed with cancer, and for supporting more primary prevention.
Key words: cancer registries, Central Europe, prevalence
Introduction
Cancer incidence and mortality do not fully reflect the magnitude of cancer. Cancer registries (CRs) in Nordic countries have already shown the relevance of measuring prevalence for the “evaluation of the cancer problem” [1]. For many years, preva-lence figures have only been delivered by CRs collecting data for
a sufficient period of time to provide unbiased estimates. Recent advances in statistical methods and requirements for updated public health strategies [2] explain the interest for prevalence estimations, using incidence and survival figures.
The aim of this work is to estimate the cancer prevalence for central European countries, as has been done in a comparable way for other European areas [3]. Austria, Germany, The Nether-lands, Poland, Slovakia, Slovenia and Switzerland have a combined population of 13 million inhabitants and present large disparities in national population coverage by the CRs. In spite of their geographical contiguity, these countries belong to different entities, as defined by the World Health Organization: Poland
314
and Slovakia are in Eastern Europe; Slovenia is in Southern Europe; Austria, Germany, The Netherlands and Switzerland are in Western Europe. Slovenia (2 million inhabitants) and Slovakia (5.3 million inhabitants), representing 56% of the dataset, have nationwide tumour registries. In the other registries (totalling 5.8 million inhabitants), available data have a low degree of coverage within their respective country. One cancer registry represents 1.7% of the population in Germany (Saarland), 5.7% in The Netherlands (Eindhoven) and 7.8% in Austria (Tyrol); two CRs represent 6.2% of the population in Poland (Warsaw and Cracow) and 11.8% in Switzerland (Basel and Geneva). This requires caution in attributing to the whole country figures derived from the corresponding CRs.
As 55% of the population dataset are incident cases from as early as 1970, it could be assumed that the majority of prevalent cases in 1992 were diagnosed after the start of the registration period. However, it might not be a correct assumption for pre-valent cases from either Slovakia (41% of the dataset), where registration started in 1980, or Tyrol (5% of the dataset) and Warsaw (12% of the dataset), where registration started in 1988. This heterogeneity between data from the registries is also remark-able when dealing with life-styles, diet habits, cancer incidence patterns, cancer survival and health care organisations. As a con-sequence, differences in estimated results could be expected.
Eleven types of cancer have been considered in the analysis: stomach, colon, rectum, melanoma, breast, uterus, prostate, Hodgkin’s lymphoma, leukaemia, lung combined with pleura, and all malignant cancers combined.
Materials and methods
DataNine CRs from Austria, Germany, The Netherlands, Poland, Slovakia, Slovenia and Switzerland, covering a population of 13 million inhabitants, provided the incidence and survival data needed to estimate prevalence for these seven countries. More than 465 000 incident tumours were registered and the data collection period ranged from 4 years (1988–1992 for Warsaw in Poland) to 22 years (1970–1992 for Geneva in Switzerland and Saarland in Germany). All registries assured follow-up for vital status at least until 31 December 1992, which is the index date for the estimation of prevalence.
All cases recorded by each cancer registry were included in the analysis. When some information was missing (on average, not more than 1% of the total number of cases) imputation procedures were adopted [3]. The only cases excluded from the analysis were death certificate only (DCO) cases and cases discovered at autopsy, assuming they did not contribute to the burden of the disease. Cases lost to follow-up were assigned survival probabilities, estimated from the successful follow-up of patients of the same gender, age and period of diagnosis.
Observed prevalence represented the number of individuals diagnosed with cancer and still alive at a certain date. Unfortunately, this definition excluded cases either diagnosed before the starting date of the CR or those not registered due to incompleteness. Therefore, the observed prevalence did not correspond to the actual number of prevalent cases in a population, as some of them, still alive, may have escaped cancer registration. A correction factor named completeness index was used for correcting these estimates of pre-valence figures. This index is derived from our knowledge of cancer type specific incidence and survival [4].
The age structure of the populations under observation was slightly differ-ent. In Slovakia and Austria, the age group 0–44 years represented more than two-thirds of the male population (72% and 70%, respectively), but only 63% in Switzerland and 62% in Germany. Among women, we observed a similar contrast between the highest (Slovakia 66% and Austria 64%) and the lowest figures (Switzerland 57% and Germany 56%). For both genders, the popula-tion aged >65 years represented <20% in all countries, ranging between 8% (Slovenia, men) and 19% (Germany, women).
Calculation of prevalence
Observed prevalence was computed on the basis of the longest period of data available from each registry, by means of the PREVAL method [5, 6]. This method basically consists of collecting information from all incident cases over the period considered by the cancer registration, and following the patients throughout their life. The information on age and time since diagnosis was updated according to the life status of the patients known from the CRs.
Tables with number and proportion of prevalent cases in the populations covered by each participating CR were sent to the registries for checking and information. Registry-specific prevalence data were finally combined to provide prevalence numbers and proportions at country level.
Completeness index
The adjustment applied by the completeness index was derived from our knowledge of incidence and survival features of each cancer site [4]. The index varied between 0 and 1, depending on the adjustment introduced in the prevalence observed by the registry. Values close to 0 indicated a short observation period and a large correction applied to the observed prevalence. Values close to 1 indicated a slight correction. Details of the method used for the estimation of completeness index, have been reported in previous papers [4, 5]. A common set of parameters was used for the estimation of complete-ness index in every registry considered in this study. However, relative survival varied to some extent between registries, in each country considered here. As relative survival affects prevalence, a relative death ratio specific for each registry was considered in order to increase the precision in the estima-tion of completeness index.
The completeness index was near 1 for registries with longer follow-up, for cancer sites that occurred mainly in the elderly, and for those registries with low survival rates, because worse prognosis leads to a restricted number of long-term survivors. In Geneva and Saarland, the two registries with the longest follow-up period (23 years), completeness of observed prevalence ranged from 0.88 and 0.87 for cancer of corpus uteri to 1 for cancer of the prostate and cervix uteri, and Hodgkin’s disease. The corresponding values for the Warsaw and Tyrol registries, which had the shortest period of follow-up (5 years) were 0.31 and 0.32 for corpus uteri, 0.67 and 0.78 for prostate, respectively, and 0.42 for cervix uteri and 0.38 for Hodgkin’s disease for both registries.
Average prevalence was estimated for all sites and for the seven registries combined. As figures for The Netherlands were close to these averages, we used the Dutch prevalence as reference for observing heterogeneity within our dataset through a prevalence ratio (PR).
Results
Among the seven countries, the mean prevalence estimated for all cancers combined was 1565 per 100 000 persons for men and 2413 per 100 000 persons for women, similar to the prevalence estimated for all 17 European countries combined (1570 for men and 2490 for women). Table 1 presents cancer prevalence in each of the seven populations by age group, for men and women,
31
5
Table 1. Total prevalence by country, age class, gender and cancer site. Proportions per 100 000 persons
The Netherlands Germany Austria Switzerland
0–44 45–64 65+ All ages 0–44 45–64 65+ All ages 0–44 45–64 65+ All ages 0–44 45–64 65+ All ages
Men Stomach 3.5 98.4 431.2 63.6 5.6 134.0 626.8 107.5 6.9 150.6 847.2 115.0 4.6 82.6 310.6 61.4 Colon 10.6 207.9 1114.2 154.9 11.2 231.0 1232.2 202.7 6.2 151.1 984.5 127.4 3.4 169.0 1151.4 183.4 Rectum 3.8 158.4 714.2 103.0 4.4 194.3 944.2 157.3 2.6 138.1 477.7 75.2 6.3 116.9 769.3 126.1 Lung 3.3 276.5 1468.0 197.4 5.6 246.5 907.4 168.0 5.7 201.5 610.0 103.1 6.4 215.0 721.6 145.8 Melanoma of skin 18.7 102.5 136.4 48.4 20.9 111.7 213.7 66.1 40.7 240.3 399.0 116.2 35.0 199.7 491.1 132.1 Prostate 0.0 119.0 1895.7 197.7 0.0 163.9 2606.5 327.6 0.0 196.0 3189.8 336.4 0.0 122.6 3154.0 408.4 Hodgkin’s diseasea 17.3 28.2 21.5 20.2 23.0 32.2 28.6 26.1 23.5 50.0 34.3 30.1 21.9 31.5 32.1 25.6 Leukaemia 16.5 45.1 112.5 31.6 21.8 56.3 162.1 46.2 30.2 75.2 140.1 49.9 16.2 76.1 291.5 64.6
All malignant neoplasmsb 252.0 1910.0 8848.8 1403.6 379.8 2681.9 11221.2 2173.5 405.9 2512.9 12320.7 1954.2 371.1 2268.8 10448.7 2066.0
Women Stomach 2.4 40.5 246.0 42.8 6.6 62.2 352.5 85.4 5.2 97.1 569.7 111.0 3.4 35.4 178.4 42.8 Colon 13.1 186.1 1020.0 183.5 18.9 221.2 1096.3 271.8 7.6 160.4 712.8 147.6 6.0 136.9 866.4 193.2 Rectum 1.0 125.8 512.2 95.9 5.6 135.1 638.0 156.8 2.3 105.5 393.1 83.7 5.0 112.2 536.8 127.4 Lung 3.1 79.3 101.1 33.1 2.3 51.3 100.1 33.1 3.9 68.9 111.1 33.9 3.4 71.6 144.0 45.9 Melanoma 48.2 231.4 165.8 105.0 31.8 168.3 234.6 104.6 86.7 430.7 475.4 217.9 53.4 285.8 393.8 173.5 Breast 100.2 1824.3 3227.5 898.1 106.9 1485.8 3435.7 1081.7 60.8 1355.6 2834.8 755.9 97.4 1867.7 3577.0 1170.6 Cervix uteria 36.0 97.5 155.8 65.5 56.1 207.4 284.5 137.5 68.2 432.1 349.5 187.0 23.6 124.7 151.2 72.2 Corpus uteri 1.7 262.8 926.9 181.4 6.7 271.5 1452.5 344.3 5.5 272.4 1136.8 234.7 4.3 236.5 1351.1 304.3 Hodgkin’s diseasea 17.3 18.3 13.4 17.0 22.6 14.4 15.9 19.2 22.5 33.2 13.4 23.4 16.7 20.0 15.8 17.4 Leukaemia 13.7 31.9 81.1 26.6 21.2 40.2 69.0 35.0 15.1 47.1 80.3 31.8 12.6 36.2 122.5 38.3
31
6
Table 1. (Continued)
aFifteen-year prevalence.
bAll neoplasms excluding non-melanoma skin cancer.
Slovenia Slovakia Poland All European countries (n = 17)
0–44 45–64 65+ All ages 0–44 45–64 65+ All ages 0–44 45–64 65+ All ages 0–44 45–64 65+ All ages
Men Stomach 5.5 113.0 397.5 61.5 3.7 122.8 712.1 90.8 2.7 62.5 175.9 35.2 3.0 89.5 376.5 67.8 Colon 4.2 116.5 450.4 65.6 6.6 162.9 707.1 99.9 2.5 69.1 253.8 44.7 6.0 151.6 819.4 137.4 Rectum 3.5 142.7 470.0 72.7 4.1 171.5 734.0 102.3 1.0 68.3 203.5 38.3 3.2 123.2 599.0 102.4 Lung 7.5 262.1 672.0 118.9 6.3 398.6 1390.4 206.5 5.5 216.2 424.5 100.0 3.8 201.5 791.5 144.1 Melanoma of skin 8.6 57.8 112.7 28.2 9.4 71.2 155.3 34.4 6.4 43.2 67.9 21.7 15.9 98.8 163.0 52.6 Prostate 0.0 51.3 888.3 82.9 0.3 69.5 1244.7 126.9 0.3 35.0 341.8 44.1 0.2 80.1 1555.5 206.6 Hodgkin’s diseasea 20.8 29.1 15.2 22.2 18.6 20.1 27.5 19.7 17.0 24.0 17.0 18.7 25.0 32.6 21.9 26.3 Leukaemia 15.7 40.7 127.3 30.4 17.1 49.4 226.0 42.3 11.4 17.0 35.4 15.2 20.4 41.3 139.1 39.5
All malignant neoplasmsb 252.9 1725.8 6188.3 1064.7 259.0 2343.5 10218.7 1560.6 176.6 1180.0 3162.8 729.5 298.4 1908.6 7784.5 1570.6
Women Stomach 4.9 71.2 266.8 57.5 2.9 62.5 440.8 72.4 2.0 30.6 93.2 23.5 2.2 42.4 202.7 46.6 Colon 4.9 89.0 312.8 68.1 6.2 123.7 485.6 93.1 3.0 63.2 176.0 45.4 7.2 147.1 717.2 163.9 Rectum 2.8 120.7 384.0 84.2 4.2 114.8 507.5 92.8 2.6 69.2 161.9 44.5 3.0 96.0 407.7 95.3 Lung 1.5 36.1 60.5 17.8 2.0 40.3 141.5 28.1 2.9 57.3 103.9 32.6 2.2 59.7 166.1 44.2 Melanoma 23.5 130.7 155.8 66.9 18.2 122.3 194.3 62.6 12.3 74.3 84.9 39.5 34.6 182.8 251.8 106.5 Breast 68.9 1004.0 1570.0 497.1 49.4 793.1 1391.7 377.7 67.3 814.5 1138.7 425.6 85.8 1530.3 2599.8 855.6 Cervix uteria 65.5 226.3 254.6 129.3 74.5 358.2 333.0 166.5 55.0 350.5 273.6 164.6 57.9 228.4 206.6 122.7 Corpus uteri 3.5 366.8 1161.8 251.9 8.1 420.4 1292.8 260.8 7.8 345.4 800.1 217.9 5.2 265.6 846.0 212.3 Hodgkin’s diseasea 16.9 11.9 12.6 15.1 18.7 15.2 16.0 17.6 18.3 16.7 5.7 15.9 21.4 18.2 13.6 19.3 Leukaemia 14.7 32.2 104.3 31.5 15.8 32.7 119.6 32.9 9.3 11.1 34.5 13.7 18.3 28.3 82.3 31.9
317
respectively, and for all European countries included in the EUROPREVAL study combined (n = 17) (given for reference). Figures 1 and 2 summarise the heterogeneity observed within central European countries: overall, cancer prevalence was highest in Germany and Switzerland, and lowest in Poland and Slovenia. In Slovakia, prevalence is higher than average for men, and lower than average for women. This was observed for almost all ages.
Breast cancer is the most frequent malignancy among women in all countries, with the highest prevalence found in Switzerland (1170 cases for 100 000 persons). Among men, prostate cancer is the leading malignancy in Germany, Austria and Switzerland (the highest prevalence proportion is 408 per 100 000) and lung cancer is the commonest cancer in Slovenia and Slovakia (the highest prevalence proportion is 206 per 100 000) and Poland.
The Netherlands has a high prevalence for prostate and lung cancer (198 per 100 000 for both).
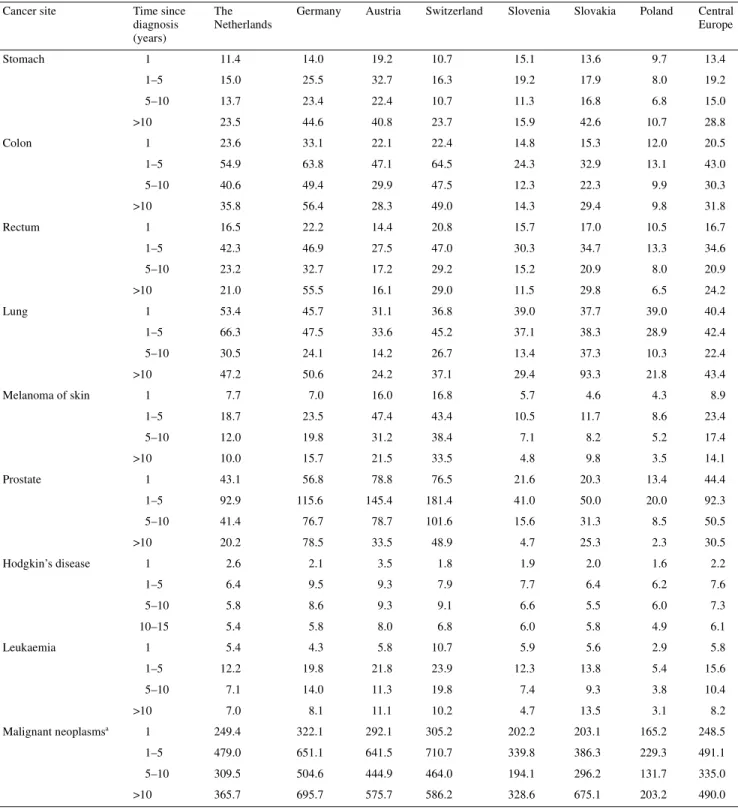
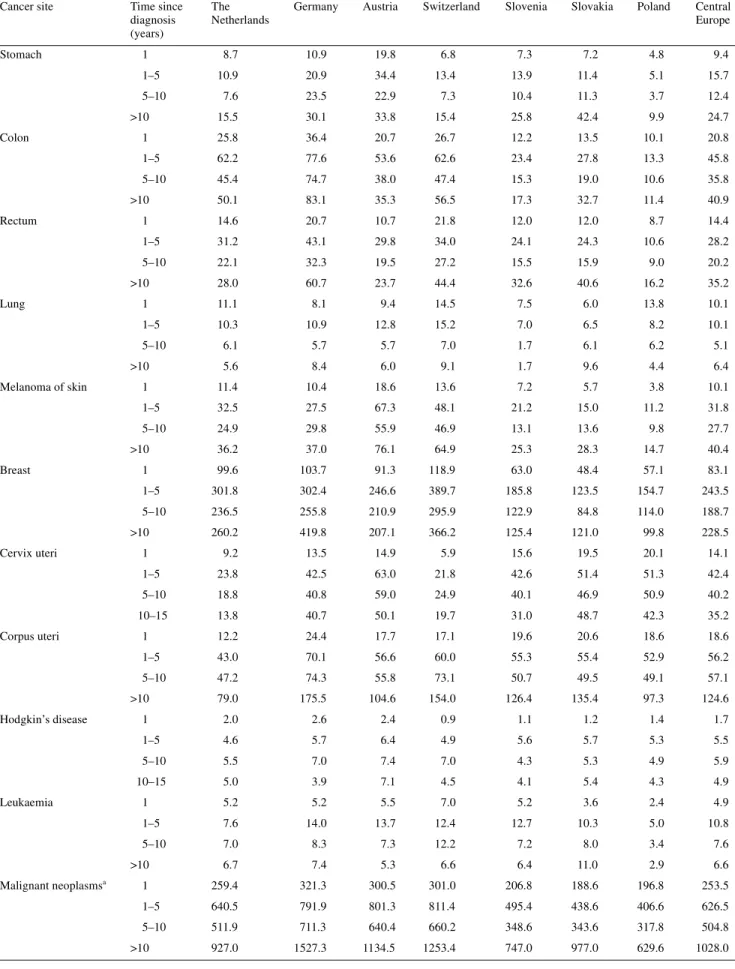
Regarding cancer prevalence by time since diagnosis (Tables 2 and 3), two issues were considered: the time-related magnitude of prevalence within each country and the variability of such propor-tions across the countries. One-year prevalence consisted of cancer patients that were likely to be under primary treatment and therefore required more resources from the health-care system. For all malignancies combined, the mean proportion of 1-year prevalence for the central European countries was 248 per 100 000 among men, representing 15–20% of total cancer prevalence. The mean proportion per site varied from 10 to 20 per 100 000 for all sites, except for lung (40.4), prostate (44.4), Hodgkin’s disease (2.2) and leukaemia (5.8). Among women, the mean proportion of 1-year prevalence for the central European countries was 253 per 100 000, representing ∼10% of cancer prevalence. The range was similar: from 10 to 20 per 100 000 for all sites except breast (83.1), Hodgkin’s disease (1.7) and leukaemia (4.9).
Prevalent cases between 1 and 5 years since diagnosis were more likely to undergo follow-up procedures for recurrence and adverse reactions. The magnitude of this prevalence was also a useful indicator of the patients’ demand for health-care facilities and of its impact on the medical system and health infrastructure. All sites combined, the mean proportion for the central European countries was 491 per 100 000 for men and 626 per 100 000 for women, with a range of proportion of the total prevalence between 22% and 28% for women, and 24% and 34% for men.
Prevalent cases diagnosed from 5 to 10 years previously repre-sent a component of patients with a lower demand for frequent control examinations. All sites combined, mean proportions were 335 per 100 000 for men and 505 per 100 000 for women, with a range of proportion of the total prevalence between 17% and 23% for both genders.
Finally, long-term cancer prevalence (diagnosed >10 years before) reflected long-term survival and proportion of people considered as cured from cancer. All sites combined, mean pro-portions were 490 per 100 000 for men and 1028 per 100 000 for women, with a range of proportion between 26% (The Nether-lands, men) and 50% (Slovakia, women).
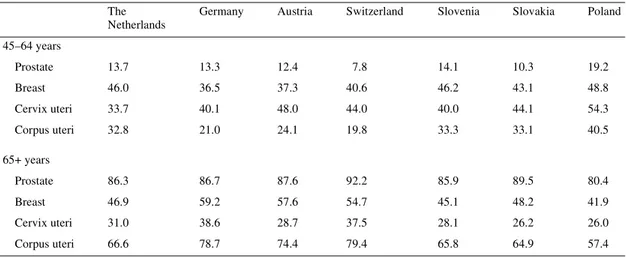
Age was an important factor influencing accuracy and timing of diagnosis, as well as effectiveness of treatment and prognosis. Prevalence of cancer in the elderly (Tables 4 and 5) represented an increasing load for the community, due to frequently associ-ated comorbidity and disability factors. For all cancers combined, people aged ≥65 years accounted for between 43% (Poland) and 72% (Switzerland) of cancer prevalence. The proportion of elderly patients was highest for prostate cancer (males; range from 80% in Poland to 92% in Switzerland) and lowest for Hodgkin’s disease, with <40% in all countries except Slovakia (49%).
Discussion
The methods for solving the main methodological problems are described extensively elsewhere [7, 8]. In addition, we can focus on some specific issues.
Figure 1. Prevalence rate ratios in men for all malignant neoplasms.
318
Completeness index
There is an apparent contradiction between the high proportion lost to follow-up in Geneva (5.4%), compared with all the others (<2%) except Cracow (4.7%), and the completeness index for which Geneva has, for all cancer sites, a value near to one. Geneva has a very peculiar situation: the population is actively
monitored and the administration knows exactly the dates of arrival and departure through the regime of residency permits. The Geneva CR has on-line access to this population data and traces patients for active follow-up twice a year. Thus, the exact number of prevalent patients is known at any time (index of completeness close to 1). However, the high proportion of ‘lost to follow-up’ simply reflects the fact that the number of foreigners
Table 2. Prevalence by time since diagnosis, site and country for men (per 100 000)
aAll neoplasms excluding non-melanoma skin cancer.
Cancer site Time since
diagnosis (years)
The Netherlands
Germany Austria Switzerland Slovenia Slovakia Poland Central
Europe Stomach 1 11.4 14.0 19.2 10.7 15.1 13.6 9.7 13.4 1–5 15.0 25.5 32.7 16.3 19.2 17.9 8.0 19.2 5–10 13.7 23.4 22.4 10.7 11.3 16.8 6.8 15.0 >10 23.5 44.6 40.8 23.7 15.9 42.6 10.7 28.8 Colon 1 23.6 33.1 22.1 22.4 14.8 15.3 12.0 20.5 1–5 54.9 63.8 47.1 64.5 24.3 32.9 13.1 43.0 5–10 40.6 49.4 29.9 47.5 12.3 22.3 9.9 30.3 >10 35.8 56.4 28.3 49.0 14.3 29.4 9.8 31.8 Rectum 1 16.5 22.2 14.4 20.8 15.7 17.0 10.5 16.7 1–5 42.3 46.9 27.5 47.0 30.3 34.7 13.3 34.6 5–10 23.2 32.7 17.2 29.2 15.2 20.9 8.0 20.9 >10 21.0 55.5 16.1 29.0 11.5 29.8 6.5 24.2 Lung 1 53.4 45.7 31.1 36.8 39.0 37.7 39.0 40.4 1–5 66.3 47.5 33.6 45.2 37.1 38.3 28.9 42.4 5–10 30.5 24.1 14.2 26.7 13.4 37.3 10.3 22.4 >10 47.2 50.6 24.2 37.1 29.4 93.3 21.8 43.4 Melanoma of skin 1 7.7 7.0 16.0 16.8 5.7 4.6 4.3 8.9 1–5 18.7 23.5 47.4 43.4 10.5 11.7 8.6 23.4 5–10 12.0 19.8 31.2 38.4 7.1 8.2 5.2 17.4 >10 10.0 15.7 21.5 33.5 4.8 9.8 3.5 14.1 Prostate 1 43.1 56.8 78.8 76.5 21.6 20.3 13.4 44.4 1–5 92.9 115.6 145.4 181.4 41.0 50.0 20.0 92.3 5–10 41.4 76.7 78.7 101.6 15.6 31.3 8.5 50.5 >10 20.2 78.5 33.5 48.9 4.7 25.3 2.3 30.5 Hodgkin’s disease 1 2.6 2.1 3.5 1.8 1.9 2.0 1.6 2.2 1–5 6.4 9.5 9.3 7.9 7.7 6.4 6.2 7.6 5–10 5.8 8.6 9.3 9.1 6.6 5.5 6.0 7.3 10–15 5.4 5.8 8.0 6.8 6.0 5.8 4.9 6.1 Leukaemia 1 5.4 4.3 5.8 10.7 5.9 5.6 2.9 5.8 1–5 12.2 19.8 21.8 23.9 12.3 13.8 5.4 15.6 5–10 7.1 14.0 11.3 19.8 7.4 9.3 3.8 10.4 >10 7.0 8.1 11.1 10.2 4.7 13.5 3.1 8.2 Malignant neoplasmsa 1 249.4 322.1 292.1 305.2 202.2 203.1 165.2 248.5 1–5 479.0 651.1 641.5 710.7 339.8 386.3 229.3 491.1 5–10 309.5 504.6 444.9 464.0 194.1 296.2 131.7 335.0 >10 365.7 695.7 575.7 586.2 328.6 675.1 203.2 490.0
319
Table 3. Prevalence by time since diagnosis, site and country for women (per 100 000)
aAll neoplasms excluding non-melanoma skin cancer.
Cancer site Time since
diagnosis (years)
The Netherlands
Germany Austria Switzerland Slovenia Slovakia Poland Central
Europe Stomach 1 8.7 10.9 19.8 6.8 7.3 7.2 4.8 9.4 1–5 10.9 20.9 34.4 13.4 13.9 11.4 5.1 15.7 5–10 7.6 23.5 22.9 7.3 10.4 11.3 3.7 12.4 >10 15.5 30.1 33.8 15.4 25.8 42.4 9.9 24.7 Colon 1 25.8 36.4 20.7 26.7 12.2 13.5 10.1 20.8 1–5 62.2 77.6 53.6 62.6 23.4 27.8 13.3 45.8 5–10 45.4 74.7 38.0 47.4 15.3 19.0 10.6 35.8 >10 50.1 83.1 35.3 56.5 17.3 32.7 11.4 40.9 Rectum 1 14.6 20.7 10.7 21.8 12.0 12.0 8.7 14.4 1–5 31.2 43.1 29.8 34.0 24.1 24.3 10.6 28.2 5–10 22.1 32.3 19.5 27.2 15.5 15.9 9.0 20.2 >10 28.0 60.7 23.7 44.4 32.6 40.6 16.2 35.2 Lung 1 11.1 8.1 9.4 14.5 7.5 6.0 13.8 10.1 1–5 10.3 10.9 12.8 15.2 7.0 6.5 8.2 10.1 5–10 6.1 5.7 5.7 7.0 1.7 6.1 6.2 5.1 >10 5.6 8.4 6.0 9.1 1.7 9.6 4.4 6.4 Melanoma of skin 1 11.4 10.4 18.6 13.6 7.2 5.7 3.8 10.1 1–5 32.5 27.5 67.3 48.1 21.2 15.0 11.2 31.8 5–10 24.9 29.8 55.9 46.9 13.1 13.6 9.8 27.7 >10 36.2 37.0 76.1 64.9 25.3 28.3 14.7 40.4 Breast 1 99.6 103.7 91.3 118.9 63.0 48.4 57.1 83.1 1–5 301.8 302.4 246.6 389.7 185.8 123.5 154.7 243.5 5–10 236.5 255.8 210.9 295.9 122.9 84.8 114.0 188.7 >10 260.2 419.8 207.1 366.2 125.4 121.0 99.8 228.5 Cervix uteri 1 9.2 13.5 14.9 5.9 15.6 19.5 20.1 14.1 1–5 23.8 42.5 63.0 21.8 42.6 51.4 51.3 42.4 5–10 18.8 40.8 59.0 24.9 40.1 46.9 50.9 40.2 10–15 13.8 40.7 50.1 19.7 31.0 48.7 42.3 35.2 Corpus uteri 1 12.2 24.4 17.7 17.1 19.6 20.6 18.6 18.6 1–5 43.0 70.1 56.6 60.0 55.3 55.4 52.9 56.2 5–10 47.2 74.3 55.8 73.1 50.7 49.5 49.1 57.1 >10 79.0 175.5 104.6 154.0 126.4 135.4 97.3 124.6 Hodgkin’s disease 1 2.0 2.6 2.4 0.9 1.1 1.2 1.4 1.7 1–5 4.6 5.7 6.4 4.9 5.6 5.7 5.3 5.5 5–10 5.5 7.0 7.4 7.0 4.3 5.3 4.9 5.9 10–15 5.0 3.9 7.1 4.5 4.1 5.4 4.3 4.9 Leukaemia 1 5.2 5.2 5.5 7.0 5.2 3.6 2.4 4.9 1–5 7.6 14.0 13.7 12.4 12.7 10.3 5.0 10.8 5–10 7.0 8.3 7.3 12.2 7.2 8.0 3.4 7.6 >10 6.7 7.4 5.3 6.6 6.4 11.0 2.9 6.6 Malignant neoplasmsa 1 259.4 321.3 300.5 301.0 206.8 188.6 196.8 253.5 1–5 640.5 791.9 801.3 811.4 495.4 438.6 406.6 626.5 5–10 511.9 711.3 640.4 660.2 348.6 343.6 317.8 504.8 >10 927.0 1527.3 1134.5 1253.4 747.0 977.0 629.6 1028.0
320
normally qualified as residents leave Geneva, to return to their country of origin, at the end of their life [9]. In the current process of estimating prevalence through a mathematical model, patients that have left Geneva continue to be considered alive, and con-tribute therefore to an overestimation of survival. This (late) migration phenomenon is medically important in Geneva, a city of international organisations with a high proportion of foreign-ers. In this situation, the overestimation of survival could bias the overall dataset and, therefore, Geneva data have not been used for the validation of prevalence modelling.
Variability within the central European countries
The dataset, arbitrarily defined as ‘central European’, combines countries with different demographic situations. Age distribution by gender is similar within each country, and figures with both genders combined can be used to define ‘young’ countries, (Slovakia, Austria, The Netherlands, Slovenia) with more than two-thirds of the population aged 0–44 years and ‘old’ countries (Poland, Switzerland, Germany) with less than two-thirds of the population aged 0–44 years. The proportion of youngest age
Table 4. Proportion (%) of mature (45–64 years) and elderly (65+ years) men and women among cancer prevalent cases
aAll neoplasms excluding non-melanoma skin cancer. The
Netherlands
Germany Austria Switzerland Slovenia Slovakia Poland
45–64 years Stomach 27.0 28.5 21.4 33.6 25.7 16.5 23.9 Colon 21.0 29.6 19.9 29.9 18.5 21.9 25.6 Rectum 24.1 39.9 22.0 36.7 20.6 22.0 27.4 Lung 30.6 51.8 31.5 39.6 34.3 41.0 36.5 Melanoma of skin 37.7 52.3 34.3 55.8 36.3 39.0 42.2 Hodgkin’s disease 42.5 37.1 48.6 44.1 33.5 24.1 46.4 Leukaemia 20.4 39.2 25.0 34.0 24.9 22.5 24.8 Malignant neoplasmsa 32.1 37.5 24.6 40.1 28.2 32.7 31.4 65+ years Stomach 52.0 88.3 58.0 90.9 49.7 66.8 53.2 Colon 56.4 87.6 59.5 94.2 58.1 61.9 52.1 Rectum 54.4 79.2 58.9 90.0 55.4 61.2 50.9 Lung 49.9 64.4 48.6 86.2 43.6 45.3 43.6 Melanoma of skin 30.0 39.5 32.7 30.2 31.5 34.8 28.1 Hodgkin’s disease 17.9 25.2 17.0 25.5 38.0 48.5 25.3 Leukaemia 29.9 37.4 31.3 48.5 41.3 44.0 33.7 Malignant neoplasmsa 41.3 67.8 50.2 72.2 44.5 46.6 42.8
Table 5. Proportion (%) of mature (45–64 years) and elderly (65+ years) patients among cancer prevalent cases, for
gender-specific sites
The Netherlands
Germany Austria Switzerland Slovenia Slovakia Poland
45–64 years Prostate 13.7 13.3 12.4 7.8 14.1 10.3 19.2 Breast 46.0 36.5 37.3 40.6 46.2 43.1 48.8 Cervix uteri 33.7 40.1 48.0 44.0 40.0 44.1 54.3 Corpus uteri 32.8 21.0 24.1 19.8 33.3 33.1 40.5 65+ years Prostate 86.3 86.7 87.6 92.2 85.9 89.5 80.4 Breast 46.9 59.2 57.6 54.7 45.1 48.2 41.9 Cervix uteri 31.0 38.6 28.7 37.5 28.1 26.2 26.0 Corpus uteri 66.6 78.7 74.4 79.4 65.8 64.9 57.4
321 group ranges from 59% (Germany) to 69% (Slovakia). In
addi-tion, taking into account unequal age distributions and the risk of mortality observed for the whole population in each country (including non-cancer patients), we also observe large differ-ences in cancer survival [10]. All cancers combined, the 5-year age-adjusted relative survival (AARS) ranges from 19% (Poland) to 45% (Austria) for men, and from 33% (Poland) to 55% (Switzerland) for women, reflecting the discrepancies in health-care systems. Illustrating this unbalanced situation, the 5-year AARS for several sites (digestive tract, prostate, all sites com-bined) in the countries having the richer economies (Germany, The Netherlands, Switzerland) are higher than the 1-year AARS for some other countries (Poland, Slovakia), reflecting the differences between countries in access to care facilities, avail-ability of modern investigation techniques and capacity for early diagnosis.
Burden of cancer and priorities
Prevalence, which results from the combined effects of the age structure of the population, age-specific incidence and quality of care, demonstrating the actual burden of disease in a different way than incidence alone does. If short-term prevalence can be assumed to be close to incidence figures, long-term prevalence is obviously linked with the efficiency of the health-care system and its capacity to provide long-term survival.
Stomach. Slovenia, Austria, Slovakia and Poland have the four
highest incidence age-standardised (European) rates, ranging from 19 to 26 per 100 000 per year [11]. Within this group, the highest prevalence for men and women is only found in Austria (115 and 111 per 100 000 for all ages); much higher (up to 6.7 times) than the country having the lowest prevalence (Poland). It seems clear that even if burden of disease, in terms of risk (incidence rates), is similar for these four countries, the actual burden, in terms of proportion of patients under treatment and follow-up, is higher in Austria, due to better survival. Five-year AARS in Austria, both genders combined, is 27%, and the 1-year and 5-year survival rates in Poland are 24% and 9%, respectively [10].
Colon. Countries with the highest overall risk (Germany,
Switzerland, The Netherlands and Austria) have the highest overall prevalence proportions for men and women. Burden of disease is even accentuated by a much better survival in these countries. For example, 5-year AARS figures in The Netherlands for men (59%) or for women (56%) are better than the 1-year AARS figures in Slovakia (54% and 54%, respectively) and Slovenia (50% and 54%, respectively). Another example, the 1-year survival rate in Poland for men and women (43%) is worse than the 5-year survival rates in Austria, Switzerland and Germany for both genders. However, one can observe some par-ticularities in prevalence by age group (through the prevalence ratios), within the group of high incidence–high prevalence countries. Switzerland and Austria have a prevalence lower than The Netherlands and Germany for young people (age <65 years). This might be due to different attitudes towards colon cancer
prevention through polyp detection, but this hypothesis needs to be investigated.
Lung. This cancer site is characterised by poor survival
every-where, i.e. <30% after 1 year, and ≤10% after 5 years. This means that health-care system and treatment do not have a great impact on prevalence, mainly related to age-specific incidence and demographic structure. Illustrating this, the prevalence ratios by period since diagnosis decrease with time in all countries except in Slovakia, where prevalence after 10 years is 2.5× prevalence at 1 year after diagnosis for men (93.3 compared with 37.7 per 100 000), and 1.6× for women (9.6 compared with 6.0 per 100 000). This exception could be explained by one of the next two proposals. First, because Slovakia has one of the highest inci-dence rates among men (79 per 100 000), the highest proportion of young people aged 0–44 years (72% among men and 66% among women) and the best 5-year AASR [10]. Secondly, because Slovakia has a passive follow-up system producing a number of lost cases that have been (wrongly) considered as alive and therefore led to overestimated prevalence counts. Both explanations could be right.
Breast and prostate. High prevalence of breast and prostate
cancers are indeed the triple effect of high incidence, demo-graphic factors (age distribution skewed toward old age), and good survival, within the same countries, especially Switzerland, Germany, The Netherlands and Austria. In addition, the observed decrease of mortality from breast cancer due to screening pro-grammes (The Netherlands) should reinforce this trend for high prevalence figures in future.
Cervix. In countries with an efficient health-care system, early
stage at diagnosis and efficient treatment explain the good survival figures, such as 1-year and 5-year AARS rates being 90% and 67% in Switzerland, versus 76% and 51% in Poland, respectively [10], and high prevalence should be observed. However, a para-doxical situation in such countries is that they could also be con-sidered at low risk (and with a small burden of disease), simply because they benefit from a good level of secondary prevention. In these cases, the high proportion of cancer in situ is lowering the incidence of malignant tumours, and thereby lowering the prevalence, which is estimated on the basis of invasive tumours. However, the impact of this prevention is generally less marked after the menopause than before, and this leads to an increase in the prevalence proportions among elderly women, mainly for long-term prevalence. In these countries we also observe the lowest incidence and the lowest prevalence, but the highest pro-portions of elderly among prevalent cases.
Skin melanoma. The range of incidence rates is wide, about 4×
higher in countries at very high risk (Austria and Switzerland) compared with countries at low risk (Slovenia, Slovakia and Poland), and the range in prevalence estimates is on the same scale. This observation is not surprising, with 5-year survival figures much better for those countries at high risk (AARS >80%) than for countries at low risk (AARS <70% among women and <55% among men).
322
Conclusion
Observing countries in central Europe, high cancer prevalence is associated with well-developed economies. Several parameters are concordant for explaining this phenomenon, such as higher proportion of elderly people, lower general mortality, more frequent early detection and high expenditure on health care. This increased burden of cancer could be interpreted as a paradoxical effect of improving treatments and thereby survival. This could also be an indication for not only being satisfied with the advances in treating patients diagnosed with cancer, but also for supporting more primary prevention.
Acknowledgements
The EUROPREVAL Working Group consists of the following members. Austria: W. Oberaigner (Cancer Registry of Tyrol); Denmark: H. Storm, G. Engholm (Danish Cancer Society, Institute of Cancer Epidemiology); Estonia: T. Aareleid (Estonian Cancer Registry); Finland: T. Hakulinen (Finnish Cancer Registry); France: G. Hédelin (Bas-Rhin Cancer Registry), H. Lefevre (Calvados Digestive Cancer Registry), J. Mace-Lesec’h (Calvados General Cancer Registry), J. Faivre (Côte d’Or Digestive Cancer Registry), G. Chaplain (Côte d’Or Gynaecologic Cancer Registry), P.M. Carli (Côte d’Or Malignant Haemopathies Registry), P. Arveux (Doubs Cancer Regis-try), J. Estève (University of Lyon), M. Colonna (Isère Cancer RegisRegis-try), N. Raverdy, P. Jun (Somme Cancer Registry); Germany: J. Michaelis (German Registry of Childhood Malignancies), H. Ziegler and C. Stegmaier (Saarland Cancer Registry); Iceland: H. Tulinius (Icelandic Cancer Registry); Italy: R. Capocaccia (Project Leader), I. Corazziari, R. De Angelis, S. Fran-cisci, S. Hartley, F. Valente, A. Verdecchia and A. Zappone (National Institute of Health, Rome), F. Berrino, G. Gatta, A. Micheli, E. Mugno and M. Sant (National Institute for the Study and Cure of Tumors, Milan), P. Cro-signani (Lombardy Cancer Registry), E. Conti (Latina Cancer Registry), M. Vercelli, C. Casella and A. Puppo (Liguria Cancer Registry–NCI, Genova), M. Federico (Modena Cancer Registry), M. Ponz De Leon (Modena Colorectal Cancer Registry), V. De Lisi (Parma Cancer Registry), R. Zanetti (Piedmont Cancer Registry), C. Magnani (Piedmont Childhood Cancer Registry), L.Gafà (Ragusa Cancer Registry), F. Falcini (Romagna Cancer Registry), E. Paci and E. Crocetti (Tuscany Cancer Registry), S. Guzzinati (Venetian Cancer Registry); Poland: J. Rachtan (Cracow Cancer Registry), M. Bielska-Lasota (Warsaw Cancer Registry); Slovakia: I. Plesko (National Cancer Registry of Slovakia); Slovenia: V. Pompe-Kirn (Cancer Registry of Slovenia); Spain: I. Izarzugaza (Basque Country Cancer Registry), A. Izquierdo (Girona Cancer Registry), C. Martinez-Garcia (Granada Cancer Registry), I. Garau (Mallorca Cancer Registry), E. Ardanaz and C. Moreno (Navarra Cancer Registry), J. Galceran (Tarragona Cancer Registry), V. Moreno (Catalan Institute of Oncologia); Sweden: T. Möller and
H. Anderson (Southern Swedish Regional Tumour Registry); Switzerland: J. Torhorst (Basel Cancer Registry), C. Bouchardy, J. M. Lutz and M. Usel (Geneva Cancer Registry), J.E. Dowd (WHO,Geneva); The Netherlands: J.W.W. Coebergh and M. Janssen-Heijnen (Eindhoven Cancer Registry), R.A.M. Damhuis (Rotterdam Cancer Registry); UK: R. Black, V. Harris and D. Stockton (Scottish Cancer Intelligence Unit), T.W. Davies (East Anglian Cancer Registry), M.P. Coleman and S. Harris (London School of Hygiene and Tropical Medicine), E.M.I. Williams (The Merseyside and Cheshire Cancer Registry), D. Forman and R. Iddenden (Northern and Yorkshire Cancer Registry and Information Service & Centre for Cancer Research), M.J. Quinn (Office for National Statistics), M. Roche (Oxford Cancer Intelli-gence Unit), J. Smith (South and West Cancer IntelliIntelli-gence Unit), H. Moller (Thames Cancer Registry), P. Silcocks (Trent Cancer Registry), G. Lawrence and K. Hemmings (West Midlands Cancer Intelligence Unit).
References
1. Hakama M, Hakulinen T, Teppo L, Saxen E. Incidence, mortality or prevalence as indicators of the cancer problem. Cancer 1975; 36: 2227– 2231.
2. Adami HO, Gunnarsson T, Sparen P, Eklund G. The prevalence of cancer in Sweden 1984. Acta Oncol 1989; 28: 463–470.
3. Micheli A, Mugno E, Krogh V et al. Cancer prevalence in European registry areas. Ann Oncol 2002; 13: 840–865.
4. Capocaccia R, De Angelis R. Estimating the completeness of prevalence based on cancer registry data. Stat Med 1997; 16: 425–440.
5. Micheli A, Francisci S, Krogh V et al. Cancer prevalence in Italian cancer registry areas: the ITAPREVAL study. ITAPREVAL Working Group. Tumori 1999; 85: 309–369.
6. Krogh V, Micheli A. Measure of cancer prevalence with a computerized program: an example on larynx cancer. Tumori 1996; 82: 287–290. 7. Capocaccia R, Verdecchia A, Micheli A et al. Breast cancer incidence
and prevalence estimated from survival and mortality. Cancer Causes Control 1990; 1: 23–29.
8. Capocaccia R, Colonna M, Corazziari I et al. Measuring cancer prevalence in Europe: the EUROPREVAL project. Ann Oncol 2002; 13: 831–839.
9. Raymond L, Fischer B, Fioretta G, Bouchardy C. Migration bias in cancer survival rates. J Epidemiol Biostatistics 1996; 1: 167–173. 10. Berrino F, Capocaccia R, Estève J et al. Survival of cancer patients in
Europe: the EUROCARE-2 study. Lyon, France: International Agency for Research on Cancer, IARC Scientific Publications No. 151, 1999. 11. Parkin DM, Whelan SL, Ferlay J et al. Cancer Incidence in Five
Continents, Vol. Vll. Lyon: International Agency for Research on Cancer, IARC Scientific Publications No. 143, 1997.