An Apparatus Enabling Easier and More
Automated Dietary Pattern Tracking
by
Guolong Wang
B.S. Physics, University of Virginia (2015)
Submitted to the Program in Media Arts and Sciences
in partial fulfillment of the requirements for the degree of
Master of Science in Media Arts and Sciences
at the
MASSACHUSETTS INSTITUTE OF TECHNOLOGY
June 2017
C Massachusetts Institute of Technology 2017. All rights reserved.
Signature redacted
A uthor...
Program in Media Arts and Sciences
At
May 11, 2017
Certified by...Sig
Signa
Accepted by ...
MASSACHUS S INSTITUTE OF TEHOLOG. Cl)JUL
3 1
7fl11
Ic:A
L1BAI
L
ES
nature redacted
...
'
Deb Roy
Associate Professor
Program in Media Arts and Sciences
ture redacted
Thesis Supervisor
...
Pattie Maes
Academic Head
Program in Media Arts and Sciences
77 Massachusetts Avenue
Cambridge, MA 02139
MiLibraries
http://Iibraries.mit.edu/askDISCLAIMER NOTICE
The pagination in this thesis reflects how it was delivered to the
Institute Archives and Special Collections.
An Apparatus Enabling Easier and More Automated Dietary
Pattern Tracking
by
Guolong Wang
Submitted to the Program in Media Arts and Sciences on May 12, 2017, in partial fulfillment of the
requirements for the degree of Master of Science in Media Arts and Sciences
Abstract
Nutritional assessment is an important problem for every American. Studies suggest that as many as 90% of Americans fall short of Vitamins D and E as a result of their regular dietary habits, and up to 50% of Americans do not get enough Vitamin A and Calcium. On the other hand, 68.8% of American adults over 20 were considered overweight or obese (had BMI of over 25), with excessive consumption of added sugars, fats, and carbohydrates being a key factor.
There are two potential challenges that, if solved, may help many ordinary
Americans manage their diets healthily. The first is recording dietary intake so that we have sufficient information regarding an individual's dietary pattern, and the second is
interpreting nutritional profiles from the foods people are eating. It's after these two steps that nutritional intake can be inferred and insights into dietary balance can be gained.
This thesis focuses on the first challenge, enabling more convenient tracking of dietary patterns supported by automatic image recognition. Our goal was to provide an improved alternative to current mainstream methods of keeping dietary records such as written records for clinical studies, or text input based digital trackers such as MyFitnessPal. Both current methods are quite tiresome, and we saw opportunities in utilizing computer vision methods to automate the recognition of what a user is eating, therefore hoping to reduce the need for manual input and making the process easier.
In practice, we implemented an image classifier based on the Inception architecture of GoogLeNet, and trained it on the Food- 101 dataset. The performance of the classifier on the validation set achieved around 87% for top 5 accuracy. We then deployed our image recognition apparatus in the form of a mobile application, to examine the actual
performance of this apparatus in an in-field setting with actual consumer eating patterns. The overall in-field recognition performance was around 28% (top 5), however, since only 30% of our meals observed were actually of foods belonging to the 101 classes we had trained the classifier to recognize, the in-field recognition accuracies for when foods to record were of foods we had trained on was around 92%. Furthermore, in subjective user surveys, 67% of users preferred our computer vision based apparatus to existing text input based digital trackers like MyFitnessPal, with 22% being neutral. Therefore, we believe that
this approach to diet tracking is a promising one to explore in the future, as the main cause of low in-field recognition performance seems to be mainly caused by lack of coverage of the training data, and if we can curate a training set that captures the visual food domain appropriately, this approach can yield high in-field results and provide a tangibly more convenient tool for users to log and track their diets.
Thesis Supervisor: Deb Roy Title: Associate Professor
Program in Media Arts and Sciences
An Apparatus Enabling Easier and More Automated Dietary
Pattern Tracking
by
Guolong Wang
The following people served as readers for this thesis:
Signature redacted
Thesis Reader
....
Alex "Sandy" Pentland
Professor of Media Arts and Sciences
MIT Media Lab
Signature redacted
Thesis Reader ...
Iyad Rahwan
Associate Professor of Media Arts & Sciences
MIT Media Lab
Acknowledgements
First and foremost, I would like to sincerely thank my advisor, Prof. Deb Roy, for his support and advice over the past two years. My time at the Media Lab has been a truly eye opening and inspirational one, and I am forever grateful for having been given the opportunity to be a part of this incredible community. Also, this thesis would not have been made possible without Deb's support and advice during both smooth and rough times.
I would also like to thank my readers, Prof. Alex "Sandy" Pentland and Prof. Iyad Rahwan, for their support and feedback that helped shape this thesis.
Additionally, I would like to thank our former collaborators from Target and the Food + Future CoLab, who introduced us to the fascinatingly deep world of food.
Last but not least, I would like to thank all my peers at the Laboratory for Social Machines. Together, you have helped shape an incredibly diverse and inclusive community that fostered exchange of ideas with unforgettable chemistry. We were also blessed to have so many peers who were constantly willing to put in personal time and effort to make our community a warm and inclusive place where everyone could find a sense of belonging. Also, together, my peers have been a second advisor to me in many ways, and I found their influence and help to be one of the most critical components of my educational experience here at the Media Lab.
Contents
Introduction ... 17
1.1 M otivations... 18
1.2 Contributions ... 19
R elated w ork...20
2.1 Non-digital forms of dietary data collection and assessment... 20
2.2 Attempts to digitalize dietary data collection for low cost and accurate m easurem ent of dietary intake ... 21
2.3 Im age recognition on foods... 22
2.4 Learning of recipes or nutritional profiles from food images ... 22
System D esign ... 24
3.1 System overview ... 24
3.2 Im age classifier architecture... 26
3.3 Training ... 31
D eploym ent and Evaluation... 32
4.1 Deploym ent ... 32
4.2 Evaluation of m ain user test ... 33
4.3 Test for restaurant based approaches using McDonald's foods ... 37
4.4 Subjective evaluations of usability ... 37 1
Future works... 40
5.1 General ... 40
5.2 Improvements related to machine learning ... 40
List of Figures
Figure 1 screenshots of our application, nutrition statistics from USDA's food composition database's standard reference values. ... Error! Bookmark not defined. Figure 2 Left is concept of Inception module, right is actual original inception module used [3 5 ] ... 2 7
Figure 3 larger filters replaced by sequence of smaller filters, module 2 in table [20]...27 Figure 4 larger filters replaced by sequence of asymmetrical convolutions, n=7 was used in our case, m odule 3 in table [20]... 28
Figure 5 m odule 4 in table [20]... 28
Figure 6 Tensorboard visualization of network used, showing the type and number of layers included in this convolutional network architecture. Detailed documentation of each convolutional layer's patch size and stride are in the table below. Layers depicted as mixed are Inception modules, with the type of Inception module documented in table below, and the specific structure of each Inception module is documented in the
fig ures ab o v e ... 2 9 Figure 7 Sum m ary of user-m eal log totals... 33 Figure 8 examples of meals captured by participants...35 Figure 9 This particular meal was a homemade mushroom soup, and since it was not a
previously widespread dish, our classifier was not able to correctly classifiy it, original homemade foods like this pose a challenge for our current image recognition approach
... 3 6
List of Tables
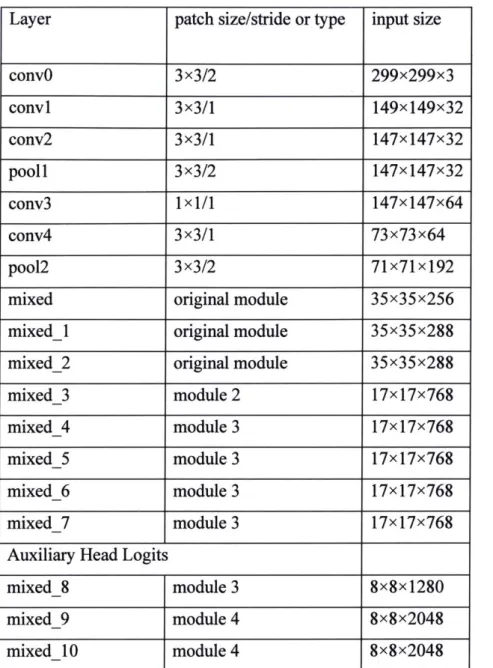
Table 1 Table of convolutional network structure, depicting each convolutional layer's input size, patch size and stride, along with the type of each Inception module. Specific structure of each module is documented in figures above. ... 30
Chapter 1
Introduction
Inadequate intake of key nutrients as a result of dietary habits is common problem for many American children and adults. Based on data originally derived from the National Health and Nutrition Examination Survey (NHANES) [36], Berner's 2014 study [13] and Fulgoni's 2011 study [14] reported nutritional deficiency levels for children and adults respectively. Deficiencies were most severe among female children between 14 to 18 years old, where more than 98% of the demographic was not consuming enough Vitamin D and Vitamin E, more than
90% did not consume enough Magnesium, and deficiencies in Calcium were existent in 81% of the demographic. Among American adults years 19 and older, Vitamin D and Vitamin E intake
deficiencies were 95% and 94% among the demographic, and Magnesium and Calcium deficiencies were found in as much as 61% and 49% of the demographic respectively.
Currently, in clinical nutritional practices, dietary assessment is performed via one of three methods, full written self-reported diet records, 24-hour recalls performed in an
interview-like fashion by dietary professionals, or food frequency questionnaires recording frequency of certain foods consumed over a specific period of time (typically 1 year) [23]. Of these three methods, the first two are very labor intensive, and while the last method is relatively less tedious, granularity of food intake information is very non-ideal with food frequency questionnaires.
While full written diet records provide best granularity and accuracy of data, writing down everything you eat is an extremely labor intensive data collection method, and is typically only done over short lengths of time such as three days. The method is also prone to changing people's food consumption patterns, as they become very conscious of the fact that they are under study. [1]
The idea of applying computer vision technologies to the dietary assessment domain has been explored before. Most previous studies from earlier times focused on the image recognition architecture, focusing on the problem of accurately classifying foods from images [2][3][4]. More recently, leaping advances in deep neural networks applied to image recognition have
allowed food image recognition tasks to be performed with satisfactorily high accuracies of approximately 90% for top 5 [5][6]. Subsequently, this has allowed researchers to move forward with tasks other than simply recognizing the food item in an image, and the frequent focus has been to infer calorie values from image data, such as the im2calories effort made by Google researchers [7], along with a number of others [10][1 1][12] .
However, while efforts have been made to tackle this domain, there has yet to be a system, actually deployed, that combines both solid algorithmic performance and tangible usability to provide a tangibly useful apparatus for users to log and track their diets easily. Therefore, we ventured out into this problem domain to explore the performance of mature machine learning systems on this problem in-field, and how end users feel about the performance of such systems, either providing tangible convenience, or simply redundant technical gimmicks.
1.1
Motivations
Our unique motivations for venturing into this area were born out of a need for ground-level data on what people actually ate every day. Initially, we were studying user conversations on Twitter that were related to food, and therefore mentions of particular foods by users were the main source of signal by which we explored relationships of users and foods. However, later on, we realized that while conversations do provide rich insight into what people think and talk
about, we had no way of knowing the relationship of such utterances with actions of actual eating of respective foods, due to lack of ground-level data on what people actually ate, for each of their daily meals.
Therefore, we first set out to find such ground level food consumption data, and after finding that data of such kinds weren't easily and readily available, we started researching methods of collection regarding dietary data, and surprisingly found out that even for nutritional science communities, this was a hard problem, and the most mature and widespread method was still to conduct self-reported diet records where users write down what they eat for every meal very specifically, or to conduct food frequency questionnaires where users report the frequencies that they eat certain foods and food categories over a certain period of time (typically one year). Of these, food frequency questionnaires are used most commonly as they are far less
burdensome for the participant than full self-reported diet records, but the accuracy of this
methodology has been challenged over the years where some claim that it is not an accurate reflection [15], and some refute such claims [16]. Alternatively, outside of the academic
community, MyFitnessPal is the most common tool that people use to track their diets today, and they claim 75 million registered users as of 2014 [17]. However, MyFitnessPal's text input based approach is still very similar to having to conduct written dietary records.
Thus, we began work on an apparatus that would allow us to capture ground-level user diet data in a scalable fashion that is also convenient for users, and deemed that image
recognition on pictures of users' meals would be an adequately convenient approach to this problem, as theoretically, we can reduce the effort on the user end to simply taking pictures (in reality, there will be cases where recognition is not accurate enough and manual correction is needed).
1.2
Contributions
There has already been past work around image recognition on foods, potentially with dietary applications in mind, but most of the past work in this sector has been focused quite purely on the image recognition problem, and were not deployed to the real world[2][3][4] [5][6]. The im2Calorie work from Google was briefly released as a mobile application, but the paper does not document how the app performed when used by consumers, and neither did it report the subjective feedback that consumers may have had after coming into contact with such a tool [7]. There has been work from Purdue on a deployed system [18], but their paper documents little about their image analysis process, and the deployed system's focus seems to be more about data collection via pictures for the time being. Subsequent work from the same Purdue group shows research dieticians analyzing the images [19], and therefore it is likely that their analytics don't have a high degree of automation when it comes to analysis of visual content.
Therefore, the main novelty of our work is that we developed a system based on a mature deep convolutional network architecture first developed at Google, commonly known as
Inception-v3 [20] and deployed it to study user interactions with such a system.
Chapter 2
Related work
2.1
Non-digital forms of dietary data collection and assessment
The most classic approach to dietary data collection widely accepted by the academic community was the dietary history approach, first proposed by Burke and Stuart [24] around the1940s. This method hinged on the principle belief that what is important in nutritional research is the long-term history or pattern of usual intake. However, this approach required an extensive interview by a trained nutritionist, and therefore was hard to administer, and not easy to scale. Furthermore, it is not a granular ground-level record of dietary consumption.
The 24-hour recall approach [23] is an alternative which is a granular record of a person's dietary intake in the past 24-hours based on recall. The merit of this method was that it was actually a granular record, and can be administered by persons with less training. However, the disadvantage is that since individual diet patterns vary greatly over time, the representativeness of this approach is sometimes not ideal.
A direct improvement on this approach, is the seven-day recall, which is similar to the 24-hour recall, only extended to seven days to achieve greater representation [23]. However, the problem with this approach is that human recall of dietary intake fades rather quickly, and therefore, it is hard to assure the accuracy of data collected via this method, at times.
Therefore, what became the standard, for dietary and nutritional research communities, was the full seven-day record of actual intake [23], which is not only granular and accurate, but also representative of general eating patterns and habits. However, the major downside to this approach, while ideal in terms of data quality, was its low scalability, due to significant effort required from participants.
Thus, as early as the 1960s, people have been looking to develop alternative methods that not only give good data quality, but also scale well. An approach called the food-frequency questionnaire has been popular, and is still mainstream, where people fill out a questionnaire
about the frequency at which they eat certain foods over a certain period of time. This is a much more scalable method than full seven-day records, and thus is being used when the level of granularity provided is sufficient.
2.2
Attempts to digitalize dietary data collection for low cost
and accurate measurement of dietary intake
Collection of ground-level dietary data collection is quite a challenging task, mainly due to difficulties in balancing scalability, granularity, and accuracy of the data being collected. Scalable methods tend to sacrifice either granularity or accuracy, and when both granularity and accuracy are being guaranteed, the approach oftentimes becomes too demanding to scale.
One attempt, from the nutritional and dietary research community to use digital
technologies to develop a dietary data collection scheme that is scalable, granular, and accurate at the same time is a web-based, automated, and self-administered 24-hour recall tool called DietDay [25]. The idea was rather straightforward, to combine the granularity and accuracy of the 24-hour recall method with the ease of administration of a web-based platform. However, while this solves scalability on the side of the researchers looking to administer the study, it is
still inconvenient for participants who have to report their intake every day.
However, it is undeniable that such web-based tools and platforms have made it much easier for researchers to administer studies requiring ground-level dietary intake information, and trials of greater size and complexity have been made more possible by such tools [26].
Following the success of tools such as DietDay in enabling more scalable collection of data for diet researchers, a system called Image-DietDay [27] was developed where images of meals from participants were recorded via mobile phone, and uploaded to remote servers as a way of automated diet data collection. The image capture based approach was generally well received from participants as being more convenient than traditional text-based ones [27]. However, what was lacking from this apparatus was that this was somewhat a pure photo
collecting system, without semantic information about what was actually being eaten. Therefore, either studies had to rely on a mechanism where the photo information was shown to participants
as a reminder for filling out 24-hour diet recalls, or researchers had to label the images manually afterwards.
Thus, applying machine learning technologies to automatically process image data from image-capture based dietary data collection apparatuses becomes an interesting and potentially impactful prospective.
2.3
Image recognition on foods
The topic of image recognition on food items has been studied within the computer vision and machine learning community for a while now. Early efforts involved hand-crafted features and SVMs [2][3]. However, accuracies resulting from such approaches are limited, and it is only until recently, that recognition tasks regarding food have been achieving stellar performance
levels due to the utilization of deep neural networks. Examples include [40] where the output of an AlexNet style architecture pretrained on ImageNet plus 1000 additional food-related
categories was combined with hand-crafted features. Alternatively, architectures utilizing the Inception architecture from GoogLeNet [20][35] were exploited in [5][6]. Both works mostly followed the general Inception architecture, with small modifications such as 1 x 1 convolutional layers to reduce input dimensions before subsequent layers, and tweaks to the Inception module for computational efficiency. Others have also used modified versions of the VGG- 16 network to perform this task [41].
Also, a team from Google has worked on this problem recently [7]. Their recognition approach was to use a pretrained Inception network as a feature extractor, and retrain the final layer softmax classifier. Additionally, very recently, a team from Italy has reported promising results surrounding food image recognition with a customized residual network designed to exploit slice-like spatial structures of foods [32].
2.4 Learning of recipes or nutritional profiles from food
images
In addition to pure image recognition on foods, researchers have also been working on approaches that learn ingredients and recipes, or nutritional profiles directly from images [29][30][42][43][7][2]. As the end goal of recognition in the food domain is to infer nutritional intake, this multimodal approach is an interesting and promising one.
Chapter 3
System Design
3.1 System overview
Our apparatus was simplistic and straightforward, consisting of a mobile application on the front-end, and a back end which handled the image recognition, matching of nutrition
information based on USDA's food composition database [22], and recording and storing of user meal information.
The front end was built via a hybrid framework called Ionic that allowed us to develop native iOS and Android applications in an Angular.js style with JavaScript. We went for a minimalistic design with capturing meals via photos as the main feature, and the history of each user's meals showing on the home screen of the mobile application. We had a simple calorie counter as a minimalistic form of feedback that both users are familiar with, and was feasible to implement. We are aware of the fact that calorie counting is far from an ideal reflection of dietary health, even for weight control purposes [21], but since the focus of this study was on a apparatus for easy dietary pattern logging and not the development of novel dietary quality indexes, we used a simple calorie counter as a simple reflection that most people were familiar with. We also allowed for a brief inspection of each meal's nutrition profile, when such
information was available in USDA's food composition database [22].
Email Password
Password
Or create an account Already have an account
cup cakes: 39.54% chocolate cake: 9.46% ice cream: 7.94% chocolate mousse: 7.92%
Today's Total Calories Calories: 204/2200 kcal History Cup Cakes Mon Mar 27 2017, 0:19 Bibimbap M MMar 27 2017012
Your Htory Goes Here
Mon Mar 27 2017 Cup Cakes cup cakes: 39.54% chocolate cake: 9.46% ice cream: 7.94% chocolate mousse: 7.92% tiramisu: 6.52%
Other: Ente' Fcoci
0
Stats per 0.333 cup: Sugars, total: 17.00 g Total lipid (fat): 4.00 g
Figure ] Screenshots of our application. Users log in, record meals by taking pictures, and can manually input if image classifier guesses are incorrect. History available in homepage and individual item nutrition statistics are inspectable. Nutrition statistics from USDA 'sfood composition database's standard reference values.
25
Name
The back end was built with Flask, so that Python logic could be run from the server. Our image classifier was built using Tensorflow which in mainly interpreted through a Python
interface, and thus was the need for a backend framework that was integrated with Python. PostgreSQL was used as the database of choice, to store user meal records. With respect to meal records, we stored the item being eaten, the timestamp of the record, and the user. In terms of user information regarding meals, we assigned a UUID to every user, and the UUID was what was actually recorded, thus we are able to distinguish between meals of different individuals, but the data was also anonymized enough so that we would not be tracking what each specific individual was eating, directly.
3.2
Image classifier architecture
For our core task of image classification, we chose a relatively mature architecture that, while not newest, still has cutting-edge performance levels on core image recognition tasks such as the ImageNet challenge. We picked the Inception-v3 architecture [20], which is a modified and improved version of the original GoogLeNet [35], Google's submission to the ImageNet Challenge in 2014.
The key characteristic of this architecture lies in the use of Inception modules, where unlike traditional architectures, convolutions of different spatial filter sizes (e.g. 3 x 3, 5 x 5, or 7
x 7) are not simply stacked, but performed in parallel and later concatenated before passing the representation on to the next layer or module. The figure [35] shows an example of an inception module that concatenates the representation of 1 x 1, 3 x 3, and 5 x 5 convolutions with a 3 x 3 max pooling layer. The merit of this design is that spatial filters of different sizes capture features at different scales, and concatenating such filters will allow better feature learning of different scales at the same time. When we look at recognition tasks around food, we believe that this is a desirable quality, as visual identities of foods are comprised of features at the larger scales and also smaller features such as smaller scattered ingredients and toppings. The right structure in the figure shows the actual Inception module used in the GoogLeNet architecture, which includes 1 x 1 convolutions for dimensionality reduction to lower computational cost.
PU.
lXI OcAMWOMF 14u Cdmnvoaim 94 NWOWN" 3 dilp tfh od%
(a) Inception module, naive version
PU.
-
~
Guwdm so5swu lxi OfvWPAWlxi conlamdons
lx awrickifu lx0 Cmivkaowu 3 5amx padx
(b) Inception module with dimension reductions
Figure 2 Left is concept of Inception module, right is actual original inception module used [35]
Later iterations (including Inception-v3, which we use in this work) of the Inception
architecture improved upon the Inception modules shown above even further, and achieved
greater levels of computational cost reduction through reducing convolutions with larger spatial
filters (e.g.
5
x5, 7
x7) into sequences of 3
x3 convolutions, or factorized into sequences of
asymmetric convolutions. The figures shown below are instances of the original Inception
module shown above with the
5
x5
convolutions replaced with sequences of convolutions to
decrease computational cost.
Filter Concat
3x3
3x3 3x3 1x1
1x1 1x1 Pool 1x1
Figure 3 larger filters replaced by sequence of smaller filters, module 2 in table [20J
Filter Concat
nxI
1xn
nx1 nx1
1xn 1xn 1x1
1xi x Pool 1xi
Bms
Figure 4 larger filters replaced by sequence of asymmetrical convolutions, n=7 was used in our case, module 3 in table [20]
Filter COMMa
1x3 3x1
3x3 1x3 x1 1xi
1x1 1X1 Pool 1x1
Bms
Figure 5 module 4 in table [20]
The Tensorboard visualization of the actual network that we used is shown below, with
details of each layer shown in the table.
MixocL10 M9UML9 I MW&7 Oft" mixed.O miud...4 mixecL2
I
r xed2 C3n1IMX
U
U
U
airOu lb Cast 'C Decodel rtur!s0 mlu.dJFigure 6 Tensorboard visualization of network used, showing the type and number of layers included in this convolutional network architecture. Figure on right shows first few layers andfigure on left shows subsequent layers until the final layers. Detailed documentation of each convolutional layer's patch size and stride are in the table below. Layers depicted as mixed are Inception modules, with the type of Inception module documented in table below, and the specific structure of each Inception module is documented in the figures above.
Layer
patch size/stride or type
input size
convO
3x3/2
299x299x3
convi
3x3/1
149x149x32
conv2
3x3/1
147x147x32
pooll
3x3/2
147x147x32
conv3
1xl/l
147x147x64
conv4
3x3/1
73x73x64
pool2
3x3/2
71x71x192
mixed
original module
35x35x256
mixed_1
original module
35x35x288
mixed_2
original module
35x35x288
mixed_3
module 2
17x17x768
mixed_4
module 3
17x17x768
mixed_5
module 3
17x17x768
mixed_6
module 3
17x17x768
mixed_7
module 3
17x17x768
Auxiliary Head Logits
mixed_8
module 3
8x8x1280
mixed_9
module 4
8x8x2048
mixed_10
module 4
8x8x2048
Table I Table ofconvolutional network structure, depicting each convolutional layers input size, patch size and stride, along with the type of each Inception module. Specific structure of each module is documented in figures above.
3.3
Training
Due to the scale of our training data, we did not train our model on the network from scratch, but rather implemented a transfer learning technique called "fine-tuning" [33] [34] where a previous model trained on the ImageNet [28] dataset was loaded to initiate the network, and afterwards, we train the network on our Food- 101 dataset during which the weights in the network are updated according to training on our new dataset. This is akin to training the model on the network from scratch except for one key difference which is the learning rate. The learning rate is significantly lowered for fine-tuning, compared to training from scratch with randomly initiated weights, due to the fact that the original purpose of fine-tuning was to utilize what the network had learned of the previous dataset (ImageNet), and thus a learning rate that is similarly high as a training from scratch scenario would update the weights of the network too dramatically, thus failing to utilize what the network had learned from the previous dataset. For this particular Inception architecture, the recommended learning rates for training from scratch and fine-tuning were 0.1 and 0.00 1 respectively. However, in our actual implementation, learning rates around 0.001 yielded very poor training results (with top 5 accuracies in the 60% to 70% range), and thus we opted for a learning rate of 0.1 instead, which allowed us to achieve 87% top 5 accuracy on the Food-101 dataset.
Additionally, we utilized another transfer learning technique called "bottlenecking" [33][34], where the last layer of the network of a model trained on ImageNet [28] is removed, and we take the values of the penultimate layer to train a Softmax classifier on the new dataset. In this scenario, the convolutional network is essentially a fixed feature extractor for the new dataset. While even intuitively, we can assume that this approach is less accurate than training on the full network, either from scratch or fine-tuned, in practice, this approach actually works quite well in certain cases. Furthermore, this approach can be trained within several hours on a laptop, while fine-tuning takes several days on a GPU box, and thus we utilized this method heavily for testing and prototyping. In practice, the McDonald's classifier that we built, which was a food image classifier of McDonald's foods (specifics of the test will be elaborated in a subsequent section), was built using this approach.
Chapter 4
Deployment and Evaluation
4.1
Deployment
As stated previously, the main focus of this study was the exploration of how image recognition enabled apparatuses perform in the wild, for dietary data collection purposes, and how much convenience it offers for users and participants, both objectively and subjectively.
The main user test was a study enlisting participants to try out a new diet tracking mobile application to evaluate the overall usability and quality with respect to diet tracking, of the mobile application. Since we wanted to see just how natively engaging our apparatus was, we explicitly did not instruct participants to log as many meals as possible. Users would begin participating by downloading our application, and would freely begin the process of logging their meals via our apparatus. We also did not define an explicit end to the study, and let usage taper down naturally. After natural decay of usage, we would send out surveys to users as they stopped using our apparatus, or if two weeks has gone by. A total of 20 users downloaded our application, with varying degrees of engagement. For subjective surveys, we received 10 responses. The average amount of time for which a participant was engaged in our study was about a week.
In the process of our main study, we noticed that a high portion of participants did not eat home prepared meals for the majority of their meals, and instead consumed restaurant foods, take-out, and delivery for a significant portion of their meals. Therefore, we also carried out a small test focusing on McDonald's foods to explore possibilities of improving the performance of our apparatus, when possible, by focusing on a well-defined setting where there is a finite number of foods being served that we can know about beforehand. We subsequently built a McDonalds version of our food image classifier by crawling images of burgers that McDonalds offers, from Google.
4.2 Evaluation of main user test
As mentioned above, our main user test had a total of 20 users download our application.
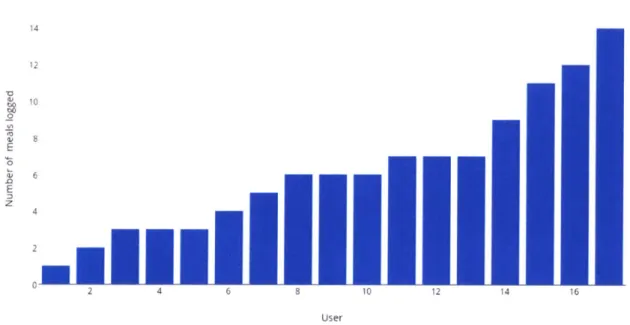
Users engaged with the application freely, and the total user test lasted around three weeks. Each
user's actual engagement was not artificially restricted to a certain time period. The chart below
shows the distribution of users' engagement levels in terms of meals logged, over the course of
the study. Overall, we ended up capturing 122 meals from participants, total.
User Meal Logged Totals
'I, E 0 E z 14 12 10 6 2 0M 10 8 User
Figure 7 Summary of user-meal log totals
Of these 122 meals, 37 meals were of foods that were included in our original training
data (Food-101 dataset [2]) containing 101 classes. Furthermore, of these 37 meals, 34 were
classified correctly within the top
5
results from the image classifier. Therefore, yielding an
overall in-field top
5
classification accuracy of 28%. However, if we take into account the fact
that only 37 meals were of foods belonging to classes in our original training data, and thus even
theoretically possible to classify, then our top 5
accuracy of foods that it theoretically could have
correctly classified was 34/37= 92%.
This is slightly higher than the performance of the classifier on the Food- 101 validation set, which was approximately 87% for top 5, but since the actual validation set had 250*101=
25,250 images, and our trial only yielded 37 theoretically classifiable images, this figure may fall
a bit as during trials of bigger scale. Also, we would like to note that these 37 meals covered a total of 30 classes, meaning they covered only approximately 30% of the classes in Food-101, and since classification accuracies vary across classes, this may also be a reason why our in-field accuracy adjusted for theoretically classifiable cases was slightly higher than the accuracy we got on the validation dataset.
Nonetheless, we cannot ignore the fact that the actual overall accuracy stays at 28%, as it is the actual overall accuracy that translates into the user's experience. From the results above, we deemed that the main factor limiting the in-field recognition performance of the image
classifier is the mismatch between training data and the actual foods that are being eaten by users every day.
We believe that two future steps should be taken, to improve the in-field accuracy of our classifier, according to the results of our user test. The first is simply to include more classes in our training data. This is quite easily understandable, as the classifier cannot recognize
something completely novel that wasn't in its training data. The second, we believe, is the better curation of the training data, that is more in accord with the hierarchy of food semantics. What we mean by this is that there is a hierarchy to the categorization of food entities, for example, spaghetti carbonara being a type of pasta dish, and beef stew and pork stew both being a type of stew, but yet different from each other. Thus if we only increase the number of classes blindly, poorly designed categorization might hinder the performance of our image classifier as if
someone were to be eating a plate of spaghetti, classifying it as spaghetti or pasta would both be plausible, even for humans, and thus creating confusion._The Food-101 dataset's classes have not been meticulously designed, instead relying on rank of appearances on foodspotting.com [2], whereas high quality datasets used for image recognition research such as ImageNet [28] is designed based on the WordNet hierarchy. In other words, the construction of a more holistic and well categorized "FoodNet" food image database should allow image classification approaches to dietary data collection achieve leaps in in-field performance.
However, we have to admit that even with a well curated training dataset, there still might be persistent hardships when it comes to home prepared meals with our current approach.
We believe that this current image classification approach where we recognize the dish from a
picture of a meal is highly viable for restaurant foods, as each food has a stable visual identity,
and we've also tested out our hypothesis on McDonalds foods, which we'll elaborate on shortly.
However, for home cooked foods, there is no standardized and stable visual identity in many
cases, and in some cases, they may be totally new original dishes. Thus, to tackle this problem,
we may have to change our recognition approach to identifying ingredients and learning the
recipe of the dish and subsequently inferring nutrition from this ingredient composition or recipe
instead of learning the name of the dish. Such approaches have already been explored by a
number of researchers [29][30][3 1], very recently beginning from 2016, and seems to be an
interesting approach to explore.
Figure 8 Example of a case where misclassification was due to item not in training data. The Food-]01 dataset did not contain salmon bagels
Figure 9 This particular meal was a homemade mushroom soup, and since it was not a previously widespread dish, our classifier
was not able to correctly classfy it, original homemade foods like this pose a challenge for our current image recognition
approach
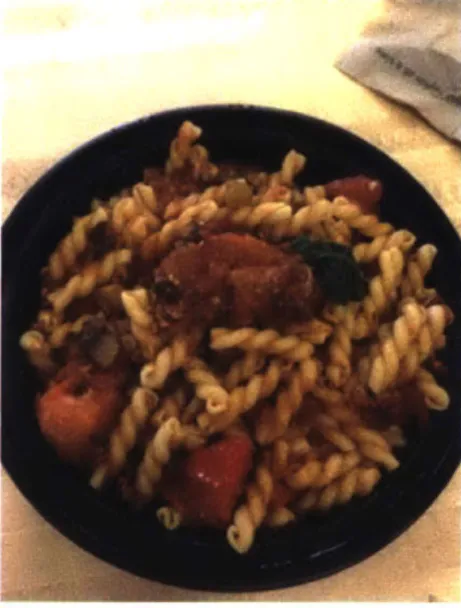
Figure 10 Foods such as this pasta with firm visual identities are easier to recognize for the classifier
4.3 Test for restaurant based approaches using McDonald's
foods
Therefore, we subsequently conducted a smaller test concerning foods at McDonalds. The primary motivation for this test was, as we mentioned above, that the visual identities of restaurant foods tend to be stable, and also, from our trial surveys, we found out that 60% of the 10 participants that responded to our surveys reported eating out for at least 40% of their meals weekly, and 40% of respondents self reported eating out for at least 50% of their meals weekly (this 40% is included in the former 60% too), meaning that a significant portion of our
participant demographic (graduate students) ate a significant portion of their meals out, thus meaning that improving performance on restaurant foods can potentially improve the
performance of our apparatus greatly for users. Therefore, we set out to test this approach on McDonald's foods, due to the fact that the menu for McDonald's was easily available, and also due to the highly similar visual identities of McDonald's hamburgers, performing well for
McDonald's foods should be a promising signal for this restaurant based approach. Seven classes of McDonald's hamburgers (Big Mac, Cheeseburger, Double Cheeseburger, etc.) were the target of our test, with 100 images per class crawled from Google Images. Training was performed through "bottlenecking" where we took off the top layer of the complete CNN architecture with a model based on ImageNet preloaded, and retrained the last layer using our new training set. This is due to the fact that we deemed the scale of training data we had was not large enough to perform high quality training on the full Inception CNN architecture from scratch.
The result was quite promising, where we obtained an 81.2% top 1 accuracy, and a 100% top 5 accuracy, however, we do have to point out that since there was only a total of 7 classes in this scenario. Nonetheless, this shows that there is tangible promise for a restaurant based
approach to improving field recognition performance of image recognition based apparatuses for dietary data collection.
4.4
Subjective evaluations of usability
In this section, we focus on the results returned from our subjective surveys. The focus of the subjective evaluations was on the general usability of the application as a result of the design of the apparatus, we also consciously asked users if they had used a text-input based digital track like MyFitnessPal before, to see how people felt about our apparatus versus trackers like
MyFitnessPal. Overall, we've received 10 responses from our participants, where 60% of our users had used MyFitnessPal before. Additionally, 40% of our total users were engaged users of MyFitnessPal (we defined engaged as self-reporting logging over 80% of meals via
MyFitnessPal), with the rest being unengaged users who did not keep close monitoring of their diets. Out of our total response pool, 50% of our users self-reported having logged more than 50% of their meals via our apparatus.
Regarding our visual approach based on image recognition, 60% of total respondents replied that they preferred this to text input based approaches such as MyFitnessPal, and 20% were neutral. Only 20% responded that they preferred MyFitnessPal. When we asked
respondents for specific reasons that they preferred our visual approach, overwhelmingly they responses we had were not simply about how having an image classifier makes the process more convenient, but surrounding the fact that having a visual diary of foods provided extra visual feedback that allowed users themselves to know more about and be more aware of their diet patterns even without additional information of feedback provided by Al. We also had multiple users report that the visuals help with gauging portion sizes, and helped people be aware of the portions they were eating, even though we did not have a feature to explicitly infer the portion sizes from the image. Currently, portion gauging is an important skill for hardcore users of MyFitnessPal who are looking to precisely monitor their calorie intake in order to reach fitness goals, and this was an interesting piece of feedback that meant even without much AI
intervention, simply having a visual diary rather than a text diary of food has value and meaning for certain users.
Regarding other aspects of general usability, 90% of users felt very good about the speed of the apparatus, even though we were carrying out the image classification from a back-end server, and generally it took around one second for the results to return to the user. In terms of usage scenarios, 60% of all users responded that they felt comfortable using the apparatus in all situations, with 40% reporting that there would be scenarios where they would feel slightly uncomfortable. Specifically, users felt that during family dinners and meals where the theme is
slightly more professional, there were levels of discomfort using the application. Subsequently, some users reflected that they wish there was an option to log their meals via text input
afterwards, so that they can keep their diet record complete, while also avoiding discomfort taking out their phones to take pictures during professional meals or family meals.
We also asked users on what kind of feedback they would like to have, from such a diet tracking apparatus (the version we deployed only had a simple calorie tracker), and 50% of users wanted recommendations on subsequent meals, and 50% of users responded that they would like to see their calorie and nutrition statistics over time.
Chapter
5
Future works
5.1 General
In this section, we would like to reflect on our evaluation results from above, and propose directions for future research in this area. Generally speaking, the positives we have gained from our pilot were that this is definitely an area where we can bring in novel technologies to build and design apparatuses that can contribute towards improvement of people's dietary
management. We believe that, judging from our pilot, computer vision assisted approaches are tangibly feasible in the near future with better curation of training data, enabling production
systems that can be used in-field at larger scales. At the same time, we also saw from our pilot that the design of the apparatus is an important part of the user experience, especially around
formats and mechanisms of feedback to users regarding their own diets.
5.2 Improvements related to machine learning
First of all, as we've also mentioned above, we believe our pilot indicates that with respect to improving image recognition performance in-field, organized curation of data at a
larger scale will probably play the largest role. The Food- 101 dataset that we trained our
classifier upon only contained 101 classes of foods, and therefore 85 out of 122 user meals were of foods not in our original training data. Thus, constructing a more holistic dataset of foods
should be the first step we should take, to improving performance. With respect to architecture, although our Inception-v3 based CNN architecture was not the highest performer on the
ImageNet dataset anymore, the peak accuracies of it on ImageNet were 78% for top-I and 94% for top-5. Thus we deemed that CNN architecture was not the primary heeding factor, however, there are promising new architectures with better performances, and we will introduce them
below. Lastly, with respect to data, we also want to point out that better organization in accord with the hierarchy of the food domain, in a way similar to how ImageNet follows the WordNet hierarchy should also contribute to better performance in-field.
We believe that data is the biggest factor, but this does not mean that we cannot improve upon our machine learning architectures for gains in performance. Just recently, there has been promising work from some Italian researchers achieving top- 1 accuracies of 90.27% and top-5 accuracies of 98.7 1% on the Food- 101 dataset by using a network architecture that was
specifically designed for food recognition by exploiting unique structural tendencies in foods
[32]. Specifically, their design was based on the observation that most foods tended to have a
vertical structure akin to a stack of "slices", such as the structures found in hamburgers and cakes, and thus they designed a special convolution kernel for this task, while concatenating this special convolutional network with a more standard residual network architecture for the representation before final classification, due to the fact that there are also foods without "slice" structures. Therefore, image recognition architectures specifically designed for food recognition should also be an area worth investigating in the future.
Additionally, direct multi-modal learning of recipes or nutritional profiles should be another promising direction to explore, as the end goal of the machine learning application even in our traditional recognition approach is to infer the nutritional intake of users from pictures of their meals. While this problem is relatively novel compared to simple image recognition, and slightly harder as it requires more extensive labeling of image data, there have been early and promising works [29][30][3 1].
5.3 Design improvements
As for improvements in terms of design and not machine learning machinery, feedback and reflection mechanisms are a key area of focus that we should be tackling in the future. In our pilot, natural engagement tapered off quite significantly for at least half of the participant pool as time progressed, as we were only able to implement a simple calorie tracker for feedback.
Tangibly, we believe that exploring the concept of a visual food diary is quite promising, due to subjective feedback regarding visuals, that we received from our pilot. Users reported that simply having pictures of their past meals allowed them to be more aware of their diets, as the
pictures actually stimulate recall, and also that the visuals were very helpful in assisting gauging of the portion size consumed, for those who were conscious about meticulously managing their intake.
Additionally, around 50% of users reported they would welcome actionable feedback in terms of recommendations for upcoming meals, and thus we believe that recommendation mechanisms to provide users with advice on foods that are both healthy for them, and fitting to their taste preferences, should be a meaningful and impactful direction of research.
Bibliography
[1] Thompson, FE and Byers, T. Dietary assessment resource manual. J Nutr. 1994
[2] L. Bossard, M. Guillaumin, and L. Van Gool. Food-101: Mining discriminative components with random forests. In ECCV, 2014
[3] H. He, F. Kong, and J. Tan. DietCam: Multiview Food Recognition Using a MultiKernel
SVM. IEEE J. of Biomedical and Health Informatics, 2015
[4] F. Zhu, M. Bosch, N. Khanna, C. J. Boushey, and E.J. Delp. Multiple hypotheses image
segmentation and classification with application to dietary assessment. IEEE J. of Biomedical
and Health Informatics, 19(1):377-388, Jan. 2015
[5] H Hassannejad, G Matrella, P Ciampolin. Food Image Recognition Using Very Deep Convolutional Networks. Proceedings of the 2nd International Workshop on Multimedia Assisted Dietary Management, Pages 41-49, 2016
[6] Liu C., Cao Y., Luo Y., Chen G., Vokkarane V., Ma Y. (2016) DeepFood: Deep
Learning-Based Food Image Recognition for Computer-Aided Dietary Assessment
[7] Balan, A.K., Gorban, A.N., Guadarrama, S., Huang, J., Johnston, N., Myers, A., Murphy, K., Papandreou, G., Rathod, V., & Silberman, N. (2015). Im2Calories: Towards an Automated
Mobile Vision Food Diary. ICCV.
[8] U.S. Department of Health and Human Services and U.S. Department of Agriculture. 2015
-2020 Dietary Guidelines for Americans. 8th Edition.
[9] Guenther PM, Casavale KO, Reedy J, Kirkpatrick SI, Hiza HA, Kuczynski KJ, Kahle LL, Krebs-Smith SM. Update of the Healthy Eating Index: HEI-20 1 OExternal Web Site Policy. J Acad Nutr Diet. 2013 Apr
[10] K. Sudo, K. Murasaki, J. Shimamura, and Y. Taniguchi. Estimating nutritional value from food images based on semantic segmentation. In CEA workshop, pages 571-576, 13 Sept. 2014.
[11] J. Chae, I. Woo, S. Kim, R. Maciejewski, F. Zhu, E. J. Delp, C. J. Boushey, and D. S. Ebert.
Volume estimation using food specific shape templates in mobile image-based dietary assessment. In Proc. SPIE, 2011.
[12] Y. He, C. Xu, N. Khanna, C. J.Boushey, and E.J. Delp. Food image analysis: Segmentation, identification and weight estimation. In ICME, pages 1-6, July 2013.
[13] Berner LA, Keast DR, Regan RL, Dwyer JT. 2014. Fortified Foods Are Major Contributors to Nutrient Intakes in Diets of US Children and Adolescents. J Acad Nutr Diet. in press.
[14] Fulgoni VL 3rd, Keast DR, Bailey RL, Dwyer J. 2011. Foods, fortificants, and supplements: Where do Americans get their nutrients? J Nutr. 141(10): 1847-54.
[15] Schaefer EJ, Augustin JL, Schaefer MM, et al. Lack of efficacy of a food-frequency questionnaire in assessing dietary macronutrient intakes in subjects consuming diets of known
composition. Am J Clin Nutr 2000;71:746-51.
[16] WC Willett. Accuracy of food-frequency questionnaires. The American journal of clinical nutrition, 2000 -Am Soc Nutrition.
[17] MyFitnessPal. Announcing 75 Million MyFitnessPal Users! [Web log post]. Retrieved from http://blog.myfitnesspal.com/announcing-75-million-myfitnesspal-users/
[18] Ziad Ahmad, Marc Bosch, Nitin Khanna, Deborah A. Kerr, Carol J. Boushey, Fengqing Zhu,
and Edward J. Delp. 2016. A Mobile Food Record For Integrated Dietary Assessment. In Proceedings of the 2nd International Workshop on Multimedia Assisted Dietary Management
(MADiMa '16). ACM, New York, NY, USA, 53-62. DOI: https://doi.org/10. 1145/2986035.2986038
[19] Kerr, Deborah A., Amelia J. Harray, Christina M. Pollard, Satvinder S. Dhaliwal, Edward J.
Delp, Peter A. Howat, Mark R. Pickering et al. "The connecting health and technology study: a 6-month randomized controlled trial to improve nutrition behaviours using a mobile food record and text messaging support in young adults." International Journal of Behavioral Nutrition and
Physical Activity 13, no. 1 (2016): 52.
[20] Szegedy, Christian, Vincent Vanhoucke, Sergey loffe, Jon Shlens, and Zbigniew Wojna. "Rethinking the inception architecture for computer vision." In Proceedings of the IEEE Conference on Computer Vision and Pattern Recognition, pp. 2818-2826. 2016.
[21] Mozaffarian, Dariush, Tao Hao, Eric B. Rimm, Walter C. Willett, and Frank B. Hu. "Changes in diet and lifestyle and long-term weight gain in women and men." N Engl J Med
2011, no. 364 (2011): 2392-2404.
[22] US Department of Agriculture, Agricultural Research Service, Nutrient Data Laboratory. USDA National Nutrient Database for Standard Reference, Release 28 (Slightly revised). Version Current: May 2016. Internet: http://www.ars.usda.gov/ba/bhnrc/ndl
[23] Block, Gladys. "A review of validations of dietary assessment methods." American journal of epidemiology 115, no. 4 (1982): 492-505.
[24] Burke BS, Stuart HC. A method of diet analysis. J Pediatr 1938; 12:493-503.
[25] Arab, Lenore, Kate Wesseling-Perry, Patricia Jardack, Judith Henry, and Ashley Winter.
"Eight self-administered 24-hour dietary recalls using the Internet are feasible in African
Americans and Whites: the energetics study." Journal of the American Dietetic Association 110, no. 6 (2010): 857-864.
[26] Arab, Lenore, Harry Hahn, Judith Henry, Sara Chacko, Ashley Winter, and Mary C.
Cambou. "Using the web for recruitment, screen, tracking, data management, and quality control in a dietary assessment clinical validation trial." Contemporary clinical trials 31, no. 2 (2010): 138-146.
[27] Arab, Lenore, Deborah Estrin, Donnie H. Kim, Jeff Burke, and Jeff Goldman. "Feasibility testing of an automated image-capture method to aid dietary recall." European journal of clinical nutrition 65, no. 10 (2011): 1156-1162. [28] J. Deng, W. Dong, R. Socher, L.-J. Li, K. Li and L. Fei-Fei, ImageNet: A Large-Scale Hierarchical Image Database. IEEE Computer Vision and Pattern Recognition (CVPR), 2009.
[29] Salvador, Amaia and Hynes, Nicholas and Aytar, Yusuf and Marin, Javier and Ofli, Ferda and Weber, Ingmar and Torralba, Antonio. Learning Cross-modal Embeddings for Cooking Recipes and Food Images. Proceedings of the IEEE Conference on Computer Vision and Pattern Recognition, 2017
[30] Chen, Jingjing, and Chong-Wah Ngo. "Deep-based ingredient recognition for cooking recipe retrieval." In Proceedings of the 2016 ACM on Multimedia Conference, pp. 32-41. ACM, 2016.
[31] Chen, Jingjing, Lei Pang, and Chong-Wah Ngo. "Cross-Modal Recipe Retrieval: How to Cook this Dish?." In International Conference on Multimedia Modeling, pp. 588-600. Springer, Cham, 2017.
[32] Martinel, Niki, Gian Luca Foresti, and Christian Micheloni. "Wide-Slice Residual Networks for Food Recognition." arXiv preprint arXiv:1612.06543 (2016).
[33] Donahue, Jeff, Yangqing Jia, Oriol Vinyals, Judy Hoffman, Ning Zhang, Eric Tzeng, and Trevor Darrell. "DeCAF: A Deep Convolutional Activation Feature for Generic Visual
Recognition." In Icml, vol. 32, pp. 647-655. 2014.
[34] Yosinski, Jason, Jeff Clune, Yoshua Bengio, and Hod Lipson. "How transferable are features in deep neural networks?." In Advances in neural information processing systems, pp. 3320-3328. 2014.
[35] Szegedy, Christian, Wei Liu, Yangqing Jia, Pierre Sermanet, Scott Reed, Dragomir Anguelov, Dumitru Erhan, Vincent Vanhoucke, and Andrew Rabinovich. "Going deeper with convolutions." In Proceedings of the IEEE Conference on Computer Vision and Pattern Recognition, pp. 1-9. 2015.
[36] NHANES: Centers for Disease Control and Prevention (CDC). National Center for Health Statistics (NCHS). National Health and Nutrition Examination Survey Data. Hyattsville, MD: U.S. Department of Health and Human Services, Centers for Disease Control and Prevention, [2010] [https://www.cdc.gov/nchs/nhanes/].
[37] Guenther, Patricia M., Kellie 0. Casavale, Jill Reedy, Sharon I. Kirkpatrick, Hazel AB Hiza, Kevin J. Kuczynski, Lisa L. Kahle, and Susan M. Krebs-Smith. "Update of the healthy eating index: HEI-2010." Journal of the Academy of Nutrition and Dietetics 113, no. 4 (2013): 569-580. [38] Barowy, Daniel W., Emery D. Berger, Daniel Goldstein, and Siddharth Suri. "WoCMan: Harnessing the Wisdom of the Crowds for High-Quality Estimates."
[39] Schafer, Hanna. "Personalized Support for Healthy Nutrition Decisions." In Proceedings of the 10th ACM Conference on Recommender Systems, pp. 455-458. ACM, 2016.
[40] Kawano, Yoshiyuki, and Keiji Yanai. "Food image recognition with deep convolutional features." In Proceedings of the 2014 ACM International Joint Conference on Pervasive and Ubiquitous Computing: Adjunct Publication, pp. 589-593. ACM, 2014.
[41] Simonyan, Karen, and Andrew Zisserman. "Very deep convolutional networks for large-scale image recognition." arXiv preprint arXiv:1409.1556 (2014).
[42] Yang, Shulin, Mei Chen, Dean Pomerleau, and Rahul Sukthankar. "Food recognition using statistics of pairwise local features." In Computer Vision and Pattern Recognition (CVPR), 2010 IEEE Conference on, pp. 2249-2256. IEEE, 2010.
[43] He, Hongsheng, Fanyu Kong, and Jindong Tan. "DietCam: Multiview Food Recognition Using a MultiKernel SVM." IEEE journal of biomedical and health informatics 20, no. 3 (2016): 848-855.
![Figure 2 Left is concept of Inception module, right is actual original inception module used [35]](https://thumb-eu.123doks.com/thumbv2/123doknet/14023730.457624/28.917.137.770.149.344/figure-concept-inception-module-actual-original-inception-module.webp)
![Figure 4 larger filters replaced by sequence of asymmetrical convolutions, n=7 was used in our case, module 3 in table [20]](https://thumb-eu.123doks.com/thumbv2/123doknet/14023730.457624/29.917.121.361.116.440/figure-larger-filters-replaced-sequence-asymmetrical-convolutions-module.webp)