OATAO is an open access repository that collects the work of Toulouse
researchers and makes it freely available over the web where possible
Any correspondence concerning this service should be sent
to the repository administrator:
[email protected]
This is an author’s version published in:
http://oatao.univ-toulouse.fr/24662
To cite this version:
Bai, Xue
and Sathiya, Mariyappan and Mendoza-Sánchez, Beatriz and
Iadecola, Antonella and Vergnet, Jean and Dedryvère, Rémi and Saubanère,
Matthieu and Abakumov, Artem M. and Rozier, Patrick
and Tarascon,
Jean-Marie Anionic Redox Activity in a Newly Zn-Doped Sodium Layered Oxide
P2-Na2/3 Mn1− y Zn y O2 (0 < y < 0.23). (2018) Advanced Energy Materials, 8
(32). 1802379. ISSN 1614-6832
Anionic Redox Activity in a Newly Zn-Doped Sodium
Layered Oxide P2-Na
2/3
Mn
1−y
Zn
y
O
2
(0 < y < 0.23)
Xue Bai, Mariyappan Sathiya, Beatriz Mendoza-Sánchez, Antonella Iadecola, Jean Vergnet,
Rémi Dedryvère, Matthieu Saubanère, Artem M. Abakumov, Patrick Rozier,*
and Jean-Marie Tarascon
DOI: 10.1002/aenm.201802379
emerged as the technology of choice for powering electric vehicles.[2] A further
improvement in the specific energy of the electrode material is still in research focus, mainly to provide Li-ion batteries also for mass storage applications. Introducing materials that show cumulative cationic as well as anionic redox activity is identified as one of the best solutions to improve the specific energy of the electrode mate-rials.[3] However, the practical application
of such anionic redox is still limited either due to O2 release or the cation
migra-tion associated with the oxygen redox activity.[4] Similar oxygen redox activity
has also been reported for sodium layered oxides, which are potential candidates for sodium ion batteries.[5] However, the
main difference with the sodium layered oxides is the availability of different lay-ered structures due to various MO2 layer
stacking modes. Thus, a difference has been observed between the oxygen activity reported for O3 (e.g.,
Na[Na1/3(Ru,Sn)2/3]O2) and P2 (e.g., Na0.67[Mg0.28Mn0.72]O2)
type layered oxides.[5,6] Interestingly, the oxygen redox activity of
P2-Na0.67[Mg0.28Mn0.72]O2 is reported to be associated with the
absence of O2 release and cation migration during cycling.[6b]
Since this reasoning is still debatable we decided to expand
The revival of the Na-ion battery concept has prompted intense research activities toward new sustainable Na-based insertion compounds and their implementation in full Na-ion cells. Efforts are parted between Na-based polyanionic and layered compounds. For the latter, there has been a specific focus on Na-deficient layered phases that show cationic and anionic redox activity similar to a Na0.67Mn0.72Mg0.28O2 phase. Herein, a new alkali-deficient P2-Na2/3Mn7/9Zn2/9O2 phase using a more electronegative element (Zn) than Mg is reported. Like its Mg counterpart, this phase shows anionic redox activity and no O2 release despite evidence of cationic migration. Density functional theory (DFT) calculations show that it is the presence of an oxygen nonbonding state that triggers the anionic redox activity in this material. The phase delivers a reversible capacity of 200 mAh g−1 in Na-half cells with such a value be reduced to 140 mAh g−1 in full Na-ion cells which additionally shows capacity decay upon cycling. These findings establish Na-deficient lay-ered oxides as a promising platform to further explore the underlying science behind O2 release in insertion compounds based on anionic redox activity.
X. Bai, Dr. P. Rozier CIRIMAT
UMR CNRS 5085
Université Toulouse 3 – Paul Sabatier
118 Route de Narbonne, 31062 Toulouse Cedex 9, France E-mail: [email protected]
X. Bai, Dr. M. Sathiya, Dr. A. Iadecola, J. Vergnet, Prof. R. Dedryvère, Dr. M. Saubanère, Dr. P. Rozier, Prof. J.-M. Tarascon
Réseau sur le Stockage Electrochimique de l’Energie (RS2E) FR CNRS 3459, 33 rue Saint Leu 80039 Amiens Cedex, France Dr. M. Sathiya, J. Vergnet, Prof. J.-M. Tarascon
Chimie du Solide et de l’Energie UMR CNRS 8260
Collège de France
11 Place Marcelin Berthelot 75231 Paris, France
B. Mendoza-Sánchez, Prof. R. Dedryvère IPREM
UMR CNRS 5254
Université de Pau et des Pays de l’Adour
Hélioparc, 2 Avenue Pierre Angot, 64053 Pau Cedex 9, France Dr. M. Saubanère
Institut Charles Gerhardt UMR CNRS 5253 Université Montpellier
Place Eugène Bataillon 34095 Montpellier, France Prof. A. M. Abakumov
Center for Electrochemical Energy Storage Skolkovo Institute of Science and Technology Nobel Str. 3, 143026 Moscow, Russia
1. Introduction
Energy storage is becoming essential for a sustainable planet and so is the development of better batteries.[1]
Recharge-able Li-ion batteries, by having the highest energy density of any such device, have conquered consumer electronics and
The ORCID identification number(s) for the author(s) of this article can be found under https://doi.org/10.1002/aenm.201802379.
the playground of materials showing anionic redox activity by exploring the substitution of Mg by other metal ions.
Anionic redox has been shown to arise from the occurrence of O(2p) nonbonding orbitals in the material which can be created by substituting part of the transition metal M(d) in Li(Na)M(d) O2 by Li, Na, and more recently Mg. The creation of such O(2p)
nonbonding orbitals relies on the fact that LiO, NaO, and MgO bonds are strongly ionic so that electrons on these bonds are fully localized on the oxygen anions. It was thus tempting to further probe this simple ionic scenario by substituting Mg2+ by a
more electronegative and electrochemically inactive element. We decided to study Na–Zn–Mn–O ternary phase diagram system and succeeded in preparing new Na2/3Mn1−yZnyO2 phases for
0 < y < 0.23. The Zn2+ ion is expected to show enhanced
M-O(2p) interactions in comparison to the previously studied alkali (Li+/Na+) or alkaline earth metals (Mg2+) due to its higher Pauling electronegativity (1.65) as compared to 0.98, 0.93, and 1.33 for Li, Na, and Mg, respectively, but also to the fact that d10
-O(2p) orbital overlap could exist with Zn as opposed to Li+, Na+,
or Mg2+ for which there is no d-orbital. So literally speaking, Zn2+ is expected to lead to an intermediate situation between
systems having perfectly ionic (Li+/Na+/Mg2+) and mainly cova-lent (M(d)) bonds with oxygen.
Here we show that the synthesized P2-Na2/3Mn1−yZnyO2
phases exhibit oxygen ion redox activity and, from density func-tional theory (DFT) calculations, we confirm that such oxygen activity is again associated with the presence of nonbonding O(2p) orbitals. However, in contrast to the reported P2-Na0.67
Mg0.28Mn0.72O2, the non-nil bonding Zn(d)-O(p) leads to cation
migration, and the corresponding structural evolution is pro-gressive on cycling thus leads to poor capacity retention.
2. Results
2.1. Synthesis and Structure
Na2/3Mn2/3 23+−yZn Mny2+ 41/3++yO2 samples with targeted
composi-tions 0 < y < 1/3 were synthesized by a two-heating-steps solid state reaction from stoichiometric amounts of Na2CO3, Mn3O4,
and Zn[OOCCH3]2 reactants that were ball-milled altogether for
30 min (SPEX-miller; 1725 rpm, rball/powder weight ratio of 7).
The ball-milled powders were initially calcined in air at 900 °C for 12 h, cooled to room temperature and hand-grinded for 10 min prior to be reannealed in air at 700 °C for 12 h followed by quenching. Once quenched, the powders were immediately transferred and stored in an argon filled glove-box to avoid any reaction with moisture. The collected X-ray diffraction (XRD) patterns for the Na2/3(Mn1−yZny)O2 samples with the nominal
composition y = 1/18, 1/9, 2/9, and 1/3 (Figure S1a, Supporting Information) show that till the composition y = 2/9, all the Bragg peaks could be indexed in a P2-type structure (S.G. P63/mmc).[7]
In contrast, the XRD pattern for the y = 1/3 sample reveals the presence of extra Bragg peaks corresponding to ZnO impuri-ties. The evolution of the lattice parameters (Figure S1b, Sup-porting Information) shows that with increasing Zn content both the a and c lattice parameters increase. This disagree with the fact that no large ionic radii changes are expected when replacing Mn3+ (0.65 Å) by the couple Zn2+/Mn4+ which
exhibits an average ionic radius of 0.64 Å. As the Na content is known to highly influence the cell parameters (screening the O–O repulsive effect), the Na occupancy was refined for each composition and shows a good agreement with the one deter-mined experimentally by ICP. The identification of the subtle structural changes induced by the progressive substitution of Zn to Mn is out of the scope of this paper and will be com-mented elsewhere. To characterize the effect of Zn doping on the electrochemical behavior of P2-Na2/3MnO2 the
composi-tion Na2/3Mn Zn Mn2/93+ 2/92+ 5/94+O2 with highest Zn2+ (and so Mn4+)
content is selected.
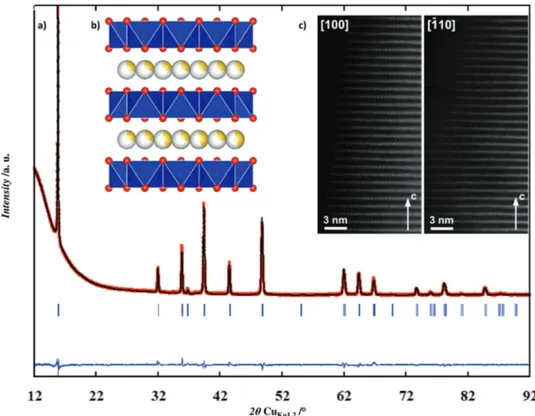
The refinement of the structure (Figure 1a; Table S1, Sup-porting Information) confirms that Na2/3[Mn7/9Zn2/9]O2 adopts
the typical P2-type structure indicating that Zn doping does not lead to structure distortion (no need to describe the structure in an orthorhombic system) and that the Mn/Zn distribution is not ordered (no evidence of superstructure peaks). Electron diffraction (ED) patterns (Figure S2, Supporting Informa-tion) can be indexed with a hexagonal unit cell with a ≈ 2.9 Å,
c ≈ 11.2 Å, and the reflection condition hhl, l = 2n corroborates
the space group P63/mmc characteristic of the P2-type structure
in accordance with the XRD data. Diffuse lines of modulated intensity along the h/3,k/3,l reciprocal lattice rows, usually asso-ciated with a 2D “honeycomb” ordering in the transition metal layer, are clearly visible in the [−110] ED pattern. However, both [−110] high angle annular dark field scanning transmission electron microscopy (HAADF-STEM) image (Figure 1c) and XRD data disprove this typical “honeycomb” ordering implying that the diffuse intensity lines might originate from 2D local ordering of Na and vacancies in the interlayer space. [100] and [−110] HAADF-STEM images (Figure 1c) clearly show perfectly ordered layered structure without any stacking faults and con-firm the absence of vacancies and Na ions in the transition metal layers.
2.2. Electrochemistry
The electrochemical properties of P2-Na2/3Mn7/9Zn2/9O2,
ball-milled with 20% w/w super P carbon for 30 min, was tested versus Na in Swagelok cells. Unless otherwise specified, loadings of ≈6 mg cm−2 of active material were used. The
voltage composition trace for a Na/ P2-Na2/3Mn7/9Zn2/9O2 cell
(Figure 2a) cycled between 4.2 and 1.5 V at a C/10 rate (1 Na in 10 h) shows that around 0.50 sodium can be removed from the material which is much higher than the 0.22 Na expected solely from the oxidation of Mn3+ to Mn4+. During the subsequent discharge to 1.5 V, the electrode uptake more sodium (0.83) than has been released on charge (0.5), hence leading to form Na0.99Mn7/9Zn2/9O2. The insertion of extra sodium is
associ-ated with a redox process locassoci-ated at ≈2 V that is reversible on subsequent cycling. Thus, the overall sodiation process leads to a specific capacity of ≈195 mAh g−1 (Figure 2b), with almost
75% of capacity being accessible at 1C rate (inset of Figure 2b). Moreover, when tested for its cycling capability the material shows a poor capacity retention (Figure 2b), retaining only 60% of its initial capacity after 50 cycles.
Interestingly, the corresponding derivative plot (inset Figure 2a) shows that the existence of two oxidation peaks
at ≈4.1 and 4.16 V during the first charge which are partially irreversible and associated to a large hysteresis since the first reduction peak solely appear at 2.6 V. Such large hysteresis was shown as the electrochemical fingerprint of materials having oxygen redox activity, thus providing the first hint for the possible participation of oxygen anion in the redox pro-cess of P2-Na2/3Mn7/9Zn2/9O2. To further explore this point a
series of cyclic voltammograms were collected by first applying a positive polarization with scan rate of 0.1 mV s−1 from OCV
until 2.9 V followed by a negative polarization till 1.5 V. The polarization is then gradually enlarged sequentially to 3.2, 3.5, 3.8, 4.1, 4.3, and 4.5 V with each step followed by negative polarization always to 1.5 V. In each color area in Figure 2c, oxidation capacity is equal to reduction capacity, meaning 100% columbic efficiency. The blue shade part indicates that the acti-vation capacity on oxidation (≈4.2 V) is further equalized by the capacity on reduction around 2.6 V. To make sure of the meaningfulness of this result, the system was cycled five times to reach electrochemical stability, prior to collect cyclic voltam-mograms (Figure 2d) following the same protocol as above. By gradually opening the voltage window, we observe first that the cathodic peak Ec around 2.3 V is compensated by the anodic
peak Ea around 2 V while at high voltage the capacity from Ec
around 4.2 V is compensated by Ea around 2.6 V, hence
con-firming the large hysteresis of the high voltage redox activity as compared to the low voltage one. Owing to the similitude of these results to those obtained for Li-rich NMC phases,[8]
we can deduce with certainty that the low voltage and high voltage peaks are related respectively to the cationic (Mn3+/Mn4+)
and anionic (O2−/(O2)n−) redox processes.
Interestingly, the monitoring of the variation of the P2-Na2/3Mn7/9Zn2/9O2/ Na cell pressure upon cycling did not
show any pressure increase during the first oxidation neither on the subsequent charges (Figure S4, Supporting Informa-tion). This implies the absence of O2 release alike what has
been recently found for the homologue Na0.67Mg0.28Mn0.72O2
phase,[6b] but in contrast with Li-rich NMC phases.
Turning to the poor capacity retention of the Na/ P2-Na2/3Mn7/9Zn2/9O2 cells, it could either be the result of
side reactions due to the sodium counter electrode or specific to complex structural changes associated to the uptake and release of Na by the P2-Na2/3Mn7/9Zn2/9O2 phase. To decipher
between these two possibilities, full coin cells (CR 2032 type) were assembled using P2-Na2/3Mn7/9Zn2/9O2 positive
elec-trode and hard carbon negative elecelec-trode. The corresponding charge–discharge curves are plotted in Figure 2e with the capacity retention plot in Figure 2f. Note that the achiev-able reversible capacity in full cell is limited to maximum of 105 mA h g−1 in contrast to the ≈195 mA h g−1 obtained with
sodium half cells (Figure 2a,b). This is simply the result of Na shortage in the full-cell (absence of the Na metal reservoir) so that the reduction of Na2/3Mn7/9Zn2/9O2 to Na1Mn7/9Zn2/9O2 is
not any longer accessible. Besides, a huge voltage difference of ≈1 V is observed between the charge and discharge process and this leads to a low energy efficiency of 80% in the first cycle (inset in Figure 2f). The energy efficiency increases to ≈95% in the second cycle as the oxidation path of the second charge is relatively different from the first charge. Upon further cycling, the cell shows a smoothed and progressive improvement till 50 cycles where it reaches a maximum of 99%. Similarly, the
Figure 1. a) Observed and calculated XRD patterns (red circles: observed; black line: calculated; blue line: difference plot; bars: Bragg reflections),
capacity of the full Na-ion cell decays and reaches values of 85% of the initial capacity after 50 cycles. Altogether, these results raise questions regarding the origin of the poor performance of P2-Na2/3Mn7/9Zn2/9O2 as a sodium positive electrode.
2.3. Structural Evolution along Cycling
Operando measurements were performed using the Na/P2-Na2/3Mn7/9Zn2/9O2 half-cells to check whether
the capacity decay could be due to Na-driven structural changes. XRD patterns were collected for every change in Na
stoichiometry of 0.05 at a C/20 rate. Their evolution is reported in Figure 3a together with the voltage-composition curve and the corresponding lattice parameters evolution (Figure 3b). During charge, the extraction of the first 0.2 Na occurs via a solid solution mechanism showing an increase and decrease of the c and a lattice parameters, respectively. Along the extraction of around 0.2 extra Na, and despite no evidence of the growing of a new phase, both the a and c lattice param-eters remain constant. At highest charged state, the growing of a broad Bragg peak located at 17° at the expense of pristine XRD pattern (mainly visible following the intensity of the (002) Bragg peak located at 15.8°) shows the typical P-type to O-type
Figure 2. (i) Galvanostatic charge–discharge analysis of P2-Na2/3[Mn7/9Zn2/9]O2 in Na half-cells a) charge– discharge cycles with the derivative plot as inset b) capacity retention plot and rate capability signature as inset. (ii) Voltammetric analysis of the P2-Na2/3[Mn7/9Zn2/9]O2 versus Na half cells in which the sweep potential is gradually increased to analyze the contribution of different redox centers c) first cycle and d) after five cycles. (iii) Gal-vanostatic charge–discharge analysis of P2-Na2/3[Mn7/9Zn2/9]O2 in full cell assembly e) charge–discharge cycles f) capacity retention plot. The inset in (f) shows the energy efficiency of the full cells.
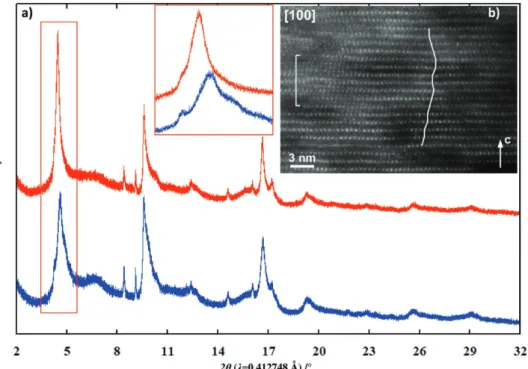
structure change.[6a,9] To get more information on this
struc-tural change, a charged sample was prepared and character-ized ex situ using synchrotron XRD and transmission electron spectroscopy (TEM) techniques. The synchrotron XRD pattern (Figure 4a) shows asymmetric broad Bragg peaks composed of several peaks (Figure 4a inset) which, while preventing for a full structure refinement, indicate mixture of P-type and O-type stacking intergrowths as usually observed in the case of charged layered compounds. The examination of the ED pat-terns of the fully charged sample (Figure S2, Supporting Infor-mation) confirms the large degree of stacking disorder as only (00l) reflections remain visible while the reflections with h,k ≠ 0 are smeared into diffuse intensity lines. [100] HAADF-STEM image (Figure 4b) shows in addition that the MO2 layers are
corrupted, acquiring wavy shape, and that a fraction of the M cations migrated to the vacant Na positions.
During the subsequent discharge, the examination of the operando XRD patterns (Figure 4a) shows that the (00l) broad peak characteristic of the charged phase shifts toward lower angles indicating a progressive increase of the interlayer dis-tance and reach, for the composition x = 0.43, the diffraction angle corresponding to the (002) Bragg peak of the P2-type structure. Interestingly, further reduction leads to the contin-uous decrease and increase of, respectively, the c and a lattice parameter over a large composition range (from 0.43 to 0.83) in
contrast to what was observed on charge. This does not come as a surprise owing to the drastic voltage-profile difference between the first charge and first discharge. Upon an insertion of greater than x = 0.83 Na+, there is an asymmetric broadening
of (002) Bragg peaks of P2-Nax[Mn7/9Zn2/9]O2 suggesting the
growing of an extra P-type compound which is then kept until the end of the discharge. The ex situ synchrotron XRD pattern of fully discharged sample (Figure S5 and Table S2, Supporting Information) reveals a distorted P’2-Na1Mn7/9Zn2/9O2 structure
(S.G. Cmcm a = 2.919(1) Å, b = 5.395(3) Å, c = 10.814(6) Å).[7]
TEM experiments (Figure S5b,c, Supporting Information) confirm the restoration of the long-range ordered stacking of MO2 layers without evidence of the reminiscence of the
tran-sition metal migration. Along the second charge (Figure S6, Supporting Information) the observed evolutions shows the processes occurring along the first discharge to be reversible confirming that, once the first cycle achieved the process is fully reversible structural-wise. The synchrotron XRD data col-lected ex situ on a sample prepared at the charged state after ten cycles is reported in Figure 4a. The similarities with the one obtained at the first charge shows that no large structure evolu-tion occurs along cycling except the decrease of the number of phases contributing to the broadening of the (00l) Bragg peaks (Figure 4 inset) which however does not allow single identifica-tion of the charged phase as already reported.[10]
Figure 3. In situ XRD analysis a) structural evolution of P2-Na2/3[Mn7/9Zn2/9]O2 as a function of sodium deinsertion and reinsertion. The corresponding time versus voltage plot is shown on the right. b) lattice parameter variation as a function of sodium stoichiometry in the material.
2.4. HAXPES and Home-XPS Analyses
To better access and quantify the charge compensation mecha-nism in P2-Na2/3Mn7/9Zn2/9O2 through the absorption and
release of Na+, five samples corresponding to different states of charge (Figure 5a) were analyzed ex situ using hard X-ray photo-electron spectroscopy (HAXPES) and home-X-ray photoelec-tron spectroscopy (XPS) analyses. The combination of HAXPES (hν = 6.9 keV) and home-XPS (hν = 1486.6 eV) allows a depth-resolved characterization since the probe depth is much greater for HAXPES (around 30 nm) than for home-XPS (around 6 nm) as estimated from TPP-2M model.[11]
The two Mn(2p) spectra (Figure 5b,c) of the pristine mate-rial display a maximum at 642 eV corresponding to Mn4+, and
a shoulder at lower binding energy (641 eV) attributed to Mn3+. The fitting of the spectra, using as a reference for Mn4+ and
Mn3+ respectively, the spectrum of the fully charged sample and of α-NaMnO2, gave 26% of Mn3+ from HAXPES data and 28%
from home-XPS data, to compare with the expected value 29% of Mn3+ in the pristine material, i.e., Na
2/3Mn3+2/9Mn4+5/9Zn2/9O2.
In HAXPES Mn(2p) spectra, the Mn3+ shoulder disappears as 0.2 Na+ are removed from the sample (mid-charged) implying the full
oxidation of Mn3+ into Mn4+, with the binding energy of Mn4+ signal remaining constant upon further removal of Na+ till 4.5 V.
In home-XPS spectra the same observation could be done but a small contribution of Mn3+ still remained after mid-charge (9% of
Mn3+), revealing that the surface is not strictly identical to the bulk. The O(1s) HAXPES spectrum of the pristine material (Figure 5d) shows a narrow component at 529.5 eV which is characteristic of O2− anions from the crystalline network of
lay-ered oxides.[11] Additional peaks are attributed to contamination
by oxygenated species at the surface of the sample as confirmed by home-XPS analysis (not shown). After mid-charge (removal of 0.2 Na+) no significant change is observed in the O(1s)
HAXPES spectrum except the nature of surface species due to contact with the electrolyte. After full charge the O(1s) spectrum could not be fitted correctly, to account for the asymmetric shape of the O(1s) main peak, without the introduction of an addi-tional component at 530.5 eV. This addiaddi-tional O(1s) component was previously observed in lithium-rich layered oxides and could be explained by the participation of the O2− anion in the redox process, leading to an “oxidized” oxygen (O2)n− with a decreased
negative charge.[8d,12] The fitting of HAXPES spectrum shows
that the relative amount of (O2)n− is 14% with respect to the
ini-tial O2− component at the end of charge.
This extra O(1s) component was not observed in the mid- discharged (reinsertion of 0.6 Na+) and in the fully discharged samples while in the Mn(2p) HAXPES spectra (Figure 5b) a drastic increase of the Mn3+ contribution from 56% in the sample discharged at 2.4 V up to 74% in the fully dis-charged sample is observed confirming the involvement of the Mn4+/Mn3+ redox process. The refinement of home-XPS
spectra leads, compared to HAXPES results, to greater amounts of Mn3+ with 65% at mid-discharge up to 93% at full discharge
the later needing to use Mn2O3 as a reference contrary to all
other samples which were successfully fitted using NaMnO2.
Recalling the respective probe depths 30 nm versus 6 nm of HAXPES versus home-XPS, the existence of an additional process occurring at the extreme surface of the material (i.e., the first nanometers) upon discharge can be suspected in accordance with an issue frequently discussed with Li-rich NMC.[13]
2.5. Electron Energy Loss Spectroscopy (EELS) Measurements
EELS measurements corroborate the HAXPES and XPS observations. The distribution of the Mn oxidation state
Figure 4. a) Ex situ synchrotron XRD pattern of samples collected at the 1st and 10th charged state (inset enlargement of the low range angle).
in the pristine, charged to 4.5 V and discharged to 1.5 V Na2/3Mn7/9Zn2/9O2 samples is demonstrated in Figure S6
(Supporting Information) and the values averaged over six crystallites in each samples are provided in Table S3 in the Supporting Information. The ≈5 nm thick surface layer in the pristine sample is enriched with Mn3+ (the average Mn
oxidation state VMn = +3.2(2)), whereas the more bulky part
contains more Mn4+ (V
Mn = +3.7(1)), in good agreement with
26%–29% of Mn3+ found with HAXPES and XPS. Charging to 4.5 V oxidizes bulk manganese to Mn4+ (V
Mn = +3.9(1)), but
substantial amount of Mn3+ still remains in the surface layer (VMn = +3.6(2)). Subsequent discharge to 1.5 V reduces
sur-face Mn back to trivalent state (VMn = +3.1(1)) and significantly
increases the Mn3+ fraction in the bulk (V
Mn = +3.40(8)).
2.6. X-Ray Absorption Spectroscopy (XAS) Measurements
A last question regards the role of the Zn substituting element with respect to the charge compensation mechanism that we explored using XAS. The Figure 6a,b shows XANES spectra at
Mn K-edge and at Zn K-edge respectively collected on the ex situ samples at different states of charge (Figure 6c). The Mn oxidation state in the pristine material is slightly lower than +4 as expected for the Zn2+ substitution. At the end of the first
pseudo-plateau, the edge position of the XANES spectrum at Mn K-edge is shifted toward higher energy in agreement with the full oxidation to Mn4+ and the shoulder feature at 6551 eV is suppressed, indicating a redistribution of the elec-tronic density of states. In discharge, the shape and edge posi-tion of the XANES spectra are maintained until the potential reaches 2.5 V then the shoulder feature is restored and a shift toward lowest energy shows that the Mn is reduced and found to be at +3 oxidation state only for the fully discharged sample at 1.5 V. These findings are confirmed also by the analysis of the EXAFS oscillations (Table S4, Supporting Infor-mation) showing constant Mn–O distances around 1.90 Å as long as Mn is in +4 valence state and longer ones character-istic of smaller oxidation state of Mn in the full discharged sample. The inset in Figure 6a shows an enlarged pre-edge region of the spectra which is characterized by a splitting of Mn(3d) orbitals into t2g and eg orbitals.[14] The prepeak position
Figure 5. a) Galvanostatic charge–discharge curve showing the representative points at which the ex situ samples were collected for HAXPES and XPS
analysis. b) HAXPES Mn(2p), c) XPS Mn(2p), and d) HAXPES O(1s) spectra of samples upon the first cycle. HAXPES data were recorded with 6.9 keV photon energy and XPS data with 1487 eV. All Mn(2p) spectra were fitted with the NaMnO2 reference (grey curve) except for the XPS spectrum of the discharged sample (see text).
remains constant during the charge and the discharge, while a rigid shift toward the lower energy is observed for the fully discharged sample at 1.5 V. On the other hand, the prepeak intensity increases upon charging then remains constant until the sample is discharged to 2.5 V, and decreases again at 1.5 V. The increased intensity of the prepeak indicates a change in the environment around Mn attributed to distor-tions of the MnO6 octahedra, as already reported in several
compounds exhibiting anionic redox activity.[15] Because the
Mn(3d) orbitals are hybridized with the O(2p) orbitals, the changes in the prepeak intensity, at least till 2.5 V, are related to the direct participation of O(2p) states in the overall redox process, because no changes of the Zn edge position are observed, hence revealing that Zn is electrochemically inac-tive (Figure 6b). The differences in the XANES features above the Zn edge and in the prepeak region are related to the changes of its local environment, as confirmed by TEM which evidences some cation migration.
The redox activity of Mn was equally monitored by XAS measurements performed in operando conditions during the first cycle. The principal component analysis (PCA) combined
with multivariate-curve resolution alternating least-square (MCR-ALS) method was applied separately to the charge and the discharge, revealing that five orthogonal components are needed to capture all variations in the dataset of XAS spectra (Figure S8, Supporting Information). The electrochemical curve is shown together with the evolution of the relative concentrations of the reconstructed PCA components in Figure 6c,d. Accordingly to previous experiment, the Mn oxida-tion state of the starting electrode (PC1) is lower than +4. Along the charge, there is consumption of component PC1 to produce PC2 which shows oxidation of Mn3+ to Mn4+ and reaches its maximum concentration at the end of the first voltage plateau at 3.7 V. Further oxidation leads to the appearance of PC3 with the same Mn oxidation state of PC2, revealing that the obtained extra capacity is not ascribable to the cationic redox activity. Upon Na reintercalation, the component PC4, with same Mn oxidation state of PC1, gains intensity at the expense of PC3 and below 2.5 V, the component PC5 with Mn3+ oxidation state
replaces PC4 and its relative concentration is 100% at 1.5 V. The evolution of the XANES spectra and the EXAFS results on the reconstructed components are in agreement with those
Figure 6. a) Mn K-edge XANES spectra of the ex situ P2-Na2/3[Mn7/9Zn2/9]O2 compared with some selected references for Mn3+ (Mn2O3) and Mn4+ (LiMn2O4 delithiated). The inset shows a zoom of the prepeak region. b) Zn K-edge XANES spectra of the ex situ P2-Na2/3[Mn7/9Zn2/9]O2. c) The voltage profile with selected points related to the ex situ samples (the colour code is the same as insets (a) and (b). d) The relative concentrations of the five principal components reconstructed using the MCR-ALS method. Summation of concentrations equals unity.
on the ex situ samples (Tables S5 and S4, Supporting Informa-tion), underlying the robustness of the proposed mechanism that enlists cumulative cationic and anionic redox processes.
3. Discussion
In summary we have reported the feasibility to stabilize a new P2-Na2/3Mn7/9Zn2/9O2 phase, via the partial substitution of Mn
by an electrochemical inert element Zn, that can reversibly release and uptake Na+ ions via a charge compensation mecha-nism enlisting both cationic and anionic redox process but no O2 release. This Zn-substituted phase behaves
electrochemically-wise alike P2-Na0.67Mg0.33Mn0.66O2 with the exception that it
shows Na-driven cation migration as opposed to the Mg-substi-tuted phase.[6b] This finding further enlarges the family of
com-pound which in contrast to Li-rich layered oxides shows anionic redox activity while being alkali deficient. Practically, this defi-ciency in alkali content constitutes a penalty in terms of capacity that is related to the amount of Na+ that can be removed from the
positive electrode in Na-ion full cells. However, fundamentally, these Na-deficient layered phases provide additional examples to test the robustness of our present theoretical understanding of anionic redox processes in oxides that is mainly rooted in the presence of oxygen nonbonding 2p orbitals on top of the bonding M–O orbital.[16] The anionic redox activity observed in
P2-Na0.67Mg0.33Mn0.66O2 obeys this concept as well since MgO
bond is nearly as ionic as the LiO one, hence implying that the presence of either Li or Mg within the metal layer does not substantially modify the involvement of the O(2p) nonbonding orbitals. In contrast, the presence of anionic redox activity in the Zn-substituted phase is at first more surprising from a chemical point of view owing to the greatest electronegativity of Zn with respect to Mg that leads to the expectation of a greater covalence of the ZnO bond as compared to MgO bond.
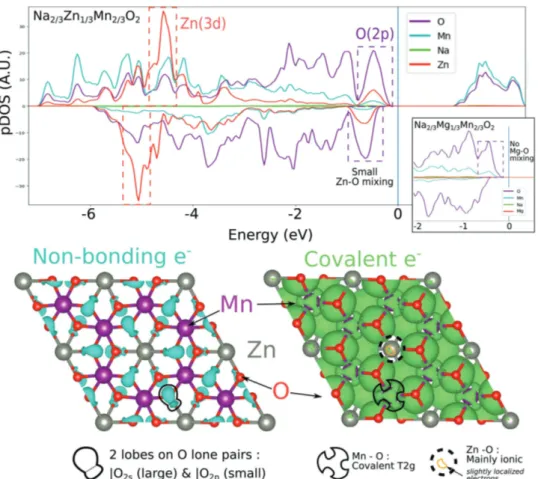
To rationalize this finding, we thus decided to perform DFT calculations. As can be seen in the projected density of states of Na2/3Zn1/3Mn2/3O2 (Figure 7), the highest occupied states,
highlighted by a dashed purple rectangle, are mainly com-posed of O(2p) states with a slight but non negligible contribu-tion from the Zn orbitals. Similarly, the density peak in the Zn filled d band, marked by a dashed red rectangle, also contains some oxygen participation. This orbital recombination is due to the non-nil, however weak, overlap between filled Zn(3d10)
and O(2p2) orbitals (the four other electrons of the O(2p) are
involved in covalent MnO bonds). Although the ZnO cova-lence is higher than in the MgO or the LiO bonds, the ZnO interaction is weak enough to consider one O(2p) states as a quasi-localized nonbonding state lying above the rest of the MO band. These nonbonded O(2p) lone pairs can be visualized (Figure 7, Bottom, Left) from the electron localization function (ELF) using a high ELF isovalue of 0.7. Two lobes can easily be distinguished in the model compound Na2/3Mn2/3Zn1/3O2,
one lobe corresponding to the nonbonded O(2s) state and another small one pointing along the ZnO bond indicative of the quasi nonbonded O(2p) states. Moreover, ELF isosurfaces with a medium value of 0.07 (Figure 7, Right) feature local minima corresponding to covalent MnO bond whereas the ZnO bond does not appear. Consequently, the nonbonding
O(2p) allows anionic oxidation in charge in a similar manner than in the cousin material Na2/3Mg1/3Mn2/3O2.[6] Such a
con-clusion can be reconciled with our chemical view. Due to its large electronegative character with respect to other metals, Zn will have its filled d10 band below the oxygen states so that only
4p orbitals of Zn can interact and Zn behaves like a s/p metal with the oxygen. Thus oxidation of the O(2p) nonbonding states in charge is reversible since Zn(4p) reduction is discarded. This explanation is also quite consistent with the existence of stable zinc peroxide (ZnO2) alike either alkali (Li2O2) or alkali-earth
(MgO2) peroxides meaning that the valence orbitals of M =
Li+, Na+, Mg2+, and Zn2+ are high enough in energy to remain
above the filled π* orbital of the peroxide (O2)2− thus avoiding
decomposition through charge transfer between the peroxide to M accompanied with O2 release.
While both Li-rich or Na-deficient layered phases show ani-onic redox activity, an intrinsic difference relies on the exist-ence of O2 release for the former and not the latter.[17] Besides
being function of the nature of the d-metal this O2 release
in Li-rich layered oxides (O2 release greater for 3d > 4d > 5d)
was associated to the onset of cation migration triggered by the electrochemical oxidation of the phase at high potential.[18]
Consistent with this explanation was the absence of O2 release
in the Li2IrO3 for which no cation migration could be detected
as compared to Li-rich NMC.[19] This belief was further
sup-ported by the absence of O2 release in the Na2/3Mg1/3Mn2/3O2
phase that does not apparently enlist cationic migration.[6b]
However, caution must be exercised here as such a compar-ison is not truly relevant as the structure of Li-rich and Na-deficient phases are not strictly identical. Li-rich materials stabilize in O3-type phase while the reported alkali-deficient sodium phases crystallize in P2-type structure with such a difference being essential on the energetics of the migration paths. Moreover, the comparison between Mg and the Zn-sub-stituted phases challenges the empirically established cation migration-O2 release relationship,[19] since the Zn-substituted
phase does not show O2 release upon electrochemical
oxida-tion, but is shown to involve cation migration upon cycling. Turning to the Mg-substituted phase it is presently difficult to conclude since cationic migration on long cycling has not been tested and the change in the voltage profile of the first cycle and the subsequent cycles not hardly discussed, hence calling for further investigation of this system. The greater cation migrations observed in the Zn-substituted phase com-pare to the Mg-substituted phase might also originate from the preference of Zn2+ to lie on tetrahedral sites more than
octahedral sites supported by the fact that ZnO crystallizes in the wurtzite structural type (Zn in Td) rather than in the rock-salt type as MgO (Mg in Oh). Indeed our DFT computation shows that the wurtzite structure is ≈300 meV per formula unit (FU) more stable than the rock-salt structure for ZnO while the rock-salt structure is ≈150 meV/FU more stable than the wurtzite structure for MgO. Consequently, it is probable that along desodiation migration path opens for Zn to migrate into more favorable tetrahedral sites while tetrahedral sites remain less favorable in the case of Mg.
Finally, the different behavior between the Li-rich and Na-deficient layered oxides in terms of O2 release, may simply be
which is solely of 14% for the P2 phases as compared to 33% for the Li-rich phases. In short, fewer holes will be created on the oxygen and therefore the tendency to peroxo-like recombi-nation will be lowered, explaining most likely why no oxygen release is observed even under harsh oxidizing conditions.
4. Conclusion
We have reported an Na-deficient layered P2-Na2/3Mn7/9Zn2/9O2
phase having no alkali/alkaline earth in the MO2 layer but rather
a divalent Zn2+ that shows anionic redox activity still due to the presence of nonbonding O(2p) orbitals as demonstrated by DFT calculations. We show that the anionic redox activity originally reported for improving the specific capacity with Li-rich phases may not give effective improvements with the P2-type sodium layered oxides as the amount of sodium is limited to 0.67 in most of the reported phases. Fundamentally-wise, the Zn-sub-stituted phase (P2-Na2/3Mn7/9Zn2/9O2) stands as an additional
example to the Mg substituted P2-Na0.67Mg0.33Mn0.66O2
com-pound and constitutes a solid platform for theorists to clearly decipher between migration or distortion as the possible cause
of O2 release in compounds showing anionic redox reactivity.
This theoretical aspect aiming to determine which phenom-enon at play regarding O2 release is being pursued in our
groups and will be the subject of a forth coming paper.
5. Experimental Section
Materials: Na2CO3 (>99.5% Aldrich), Mn3O4 (99% Aldrich), and (CH3CO2)2 Zn (99.99% Aldrich) were used as reactants for all synthesis of Na0.67Mn1−yZnyO2 samples.
Electrochemical Characterizations: The electrochemical tests were
carried out in Swagelok type sodium half cells and CR2032 coin type full cells. The powder Na2/3Mn7/9Zn2/9O2 material was ball-milled with 20% super P carbon black for 30 min to insure a homogeneous mixture and to prevent for large polarization and used as positive electrode in all analysis. A sodium metal foil pressed into stainless steel current collector or a hard carbon electrode coated on Al foil with a mass loading of ≈5.5 mg cm−2 was used as a negative electrode for half-cell and full-cell studies respectively. The galvanostatic charge–discharge cycling experiments were carried out using Biologic potentiostat/ galvanostat. The cycling rates were calculated using the theoretical capacity to remove one sodium as 1 C rate. The half-cells and full-cells were cycled at C/10 and C/20 rate respectively, unless otherwise
Figure 7. (Top) Element projected Density of states of Na2/3Zn1/3Mn2/3O2: discussed bands are highlighted in dotted rectangle (red : Zn(3d10), purple: O(2p2)). The inset show the pDos of Na
2/3Mg1/3Mn2/3O2 for comparison, where Mg does not mix at all with the O2p nonbonding states. (Bottom) Electron Localization Function isosurface for bottom right) high (0.7) and bottom left) medium (0.07) value: High ELF value reflects a high concentra-tion of paired localized electrons. If the basin is centered on 1 atom, the electrons are nonbonding. The two lobes around each oxygen corresponds to |O2s and the |O2p lone pair states. In contrast: a local basin shared between two atoms at medium ELF value indicates the occurrence of covalent bonds between these two atoms. While MnO bond is clearly covalent, ZnO bond appears mainly ionic.
mentioned. Voltage scans (cyclic voltammetry and linear voltammetry) experiment were conducted in three electrodes Swagelok cell with both Na metal casted on the stainless steel plungers as reference and counter electrodes. All the electrochemical tests were duplicated at least twice to get the reproducible results. The operando X-ray diffraction analysis was conducted using a Swagelock-type cell equipped with a Beryllium window protected by an aluminum foil as current collector. The ex situ samples for synchrotron XRD, XPS, XAS, and TEM studies were prepared by cycling the material at C/40 rate and washing it with DMC before drying under vacuum to remove the solvents. The prepared ex situ samples were carefully handle, stored, and shipped without exposing the material to air.
Characterization Techniques: The phase purity of the synthesized
powders was analyzed by powder X-ray diffraction analysis in Bruker D8 Advance diffractometer using Cu Kα radiation source. The ex situ synchrotron XRD measurements were done at 11 BM synchrotron beamline, Argonne National Laboratory. All XRD patterns were refined using Fullprof program.[20] ED patterns, high angle annular dark field scanning transmission electron microscopy (HAADF-STEM) images, energy-dispersive X-ray (EDX) spectra, and electron energy loss spectra (EELS) were obtained with an aberration-corrected Titan G3 electron microscope operated at 200 kV and equipped with a Super-X EDX system and a Gatan Enfinium ER spectrometer. Operando XAS measurements at the Mn K-edge and ex situ measurements at the Mn and Zn K-edges were performed in transmission mode at the ROCK beamline of synchrotron SOLEIL (France).[21] HAXPES measurements were carried out using photon excitation energy hν = 6.9 keV at the GALAXIES beamline, of synchrotron SOLEIL (France).[22] Home-XPS measurements were performed with an Escalab 250 Xi spectrometer using a focused monochromatized Al Kα radiation (hν = 1486.6 eV). Detailed description of the experiments and data analysis are reported in the Supporting Information.
Calculation: For spin-polarized DFT+U calculations, a model layered P2-Na2/3Mn2/3Zn2/3O2 structure with Zn lying at the center of Mn honeycomb in the Mn layer was used. All structures were fully relaxed, using the plane wave code “Vienna Ab-Initio Simulation Package” with PAW pseudo-potentials and the PBE functional.[23] Additional D3 correction accounting for the van der Waals interaction where considered,[24] as well as a U
eff = 4 eV to account for electron–electron interactions on Mn was introduced.[25] The forces on the atoms were converged to 1E-3 eV Å−1 with a plane-wave energy cut-off of 600 eV and a well converged set of Kpoints.
Supporting Information
Supporting Information is available from the Wiley Online Library or from the author.
Acknowledgements
X.B. thanks the French National network “Réseau sur le Stockage Electrochimique de l’Energie” (RS2E) FR CNRS 3459 for PhD funding. J.-M.T. and J.V. acknowledge funding from the European Research Council (ERC) (FP/2014)/ERC Grant-Project 670116-ARPEMA. This research received funding from the European Union’s Horizon 2020 research and innovation programme under grant agreement 646433-Naïades. The authors also thank the synchrotron SOLEIL (France) for funding HAXPES experiments (Proposal No. 20171035) and for providing beamtime at the ROCK beamline (financed by the French National Research Agency (ANR) as a part of the “Investissements d’Avenir” program (ANR-10-EQPX-45; proposal #20171234). This research used resources of the Advanced Photon Source (11-BM and 4-ID-C), a U.S. Department of Energy (DOE) Office of Science User Facility operated for the DOE Office of Science by Argonne National Laboratory under Contract No. DE-AC02-06CH11357. The authors are grateful to James Ablett and Jean-Pascal Rueff for their assistance during the HAXPES experiment.
Conflict of Interest
The authors declare no conflict of interest.
Keywords
anionic redox, layered oxides, Na-ion batteries, oxygen activity
[1] D. Larcher, J.-M. Tarascon, Nat. Chem. 2015, 7, 19.
[2] V. Etacheri, R. Marom, R. Elazari, G. Salitra, D. Aurbach, Energy
Environ. Sci. 2011, 4, 3243.
[3] a) M. Sathiya, G. Rousse, K. Ramesha, C. P. Laisa, H. Vezin, M. T. Sougrati, M.-L. Doublet, D. Foix, D. Gonbeau, W. Walker, A. S. Prakash, M. Ben Hassine, L. Dupont, J.-M. Tarascon, Nat.
Mater. 2013, 12, 827; b) A. Grimaud, W. T. Hong, Y. Shao-Horn,
J.-M. Tarascon, Nat. Mater. 2016, 15, 121; c) N. Yabuuchi, Chem.
Lett. 2017, 46, 412; d) B. Li, D. Xia, Adv. Mater. 2017, 29, 1701054.
[4] G. Assat, J.-M. Tarascon, Nat. Energy 2018, 3, 373.
[5] a) P. Rozier, S. Mariyappan, A.-R. Paulraj, D. Foix, T. Desaunay, P.-L. Taberna, P. Simon, J.-M. Tarascon, Electrochem. Commun. 2015,
53, 29; b) B. Mortemard de Boisse, G. Liu, J. Ma, S. Nishimura,
S. Chung, H. Kiuchi, Y. Harada, J. Kikkawa, Y. Kobayashi, M. Okubo, A. Yamada, Nat. Commun. 2016, 7, 11397; c) A. J. Perez, D. Batuk, M. Saubanère, G. Rousse, D. Foix, E. McCalla, E. J. Berg, R. Dugas, K. H. W. van den Bos, M.-L. Doublet,D. Gonbeau, A. M. Abakumov, G. Van Tendeloo, J.-M. Tarascon, Chem. Mater. 2016, 28, 8278. [6] a) N. Yabuuchi, R. Hara, K. Kubota, J. Paulsen, S. Kumakurad,
S. Komaba, J. Mater. Chem. A 2014, 2, 16851; b) U. Maitra, R. A. House, J. W. Somerville, N. Tapia-Ruiz, J. G. Lozano, N. Guerrini, R. Hao, K. Luo, L. Jin, M. A. Pérez-Osorio, F. Massel, D. M. Pickup, S. Ramos, X. Lu, D. E. McNally, A. V. Chadwick, F. Giustino, T. Schmitt, L. C. Duda, M. R. Roberts, P. G. Bruce, Nat.
Chem. 2018, 10, 288.
[7] a) J. P. Parant, R. Olazcuage, M. Devalette, C. Fouassier, E. P. Hagenmuller, J. Solid State Chem. 1971, 3, 1; b) S. Kumakura, Y. Tahara, K. Kubota, K. Chihara, S. Komaba, Angew. Chem., Int. Ed.
2016, 55, 12760.
[8] a) K. Luo, M. R. Roberts, R. Hao, N. Guerrini, D. M. Pickup, Y. S. Liu, K. Edström, J. Guo, A. V. Chadwick, L. C. Duda, P. G. Bruce.
Nat. Chem. 2016, 8, 684; b) M. Oishi, C. Yogi, I. Watanabe, T. Ohta,
Y. Orikasa, Y. Uchimoto, Z. Ogumi, J. Power Sources 2015, 276, 89; c) D. Foix, S. Mariyappan, E. McCalla, J.-M. Tarascon, D. Gonbeau,
J. Phys. Chem. C 2016, 120, 862; d) G. Assat, D. Foix, C. Delacourt,
A. Iadecola, R. Dedryvère, J.-M. Tarascon, Nat. Commun. 2017, 8, 2219; e) W. E. Gent, K. Lim, Y. Liang, Q. Li, T. Barnes, S.-J. Ahn, K. H. Stone, M. McIntire, J. Hong, J. H. Song, Y. Li, A. Mehta, S. Ermon, T. Tyliszczak, D. Kilcoyne, D. Vine, J.-H. Park, S.-K. Doo, M. F. Toney, W. Yang, D. Prendergast, W. C. Chueh, Nat. Commun.
2017, 8, 2091.
[9] a) N. Yabuuchi, M. Kajiyama, J. Iwatate, H. Nishikawa, S. Hitomi, R. Okuyama, R. Usui, Y. Yamada, S. Komaba, Nat. Mater. 2012,
11, 512; b) Z. Lu, J. R. Dahn, J. Electrochem. Soc. 2001, 148, A1225;
c) D. H. Lee, J. Xu, Y. S. Meng, Phys. Chem. Chem. Phys. 2013, 15, 3304.
[10] a) B. Mortemard de Boisse, D. Carlier, M. Guignard, L. Bourgeois, C. Delmas, Inorg. Chem. 2014, 53, 11197; b) R. J. Clément, P. G. Bruce, C. P. Grey, J. Electrochem. Soc. 2015, 162, A2589.
[11] L. Dahéron, R. Dedryvère, H. Martinez, M. Ménétrier, C. Delmas, D. Gonbeau, Chem. Mater. 2008, 20, 583.
[12] D. Foix, M. Sathiya, E. McCalla, J.-M. Tarascon, D. Gonbeau, J. Phys.
Chem. C 2016, 120, 862.
[13] F. Lin, I. M. Marcus, D. Nordlund, T.-C. Weng, M. D. Asta, H. L. Xin, M. M. Doeff, Nat. Commun. 2014, 5, 3529.
[14] D. Buchholz, L. Jie, S. Passerini, G. Aquilanti, D. Wang, M. Giorgetti, ChemElectroChem 2015, 2, 85.
[15] a) H. Koga, L. Croguennec, M. Ménétrier, P. Mannessiez, F. Weill, C. Delmas, S. Belin, J. Phys. Chem. C 2014, 118, 5700; b) K. Luo, M. R. Roberts, R. Hao, N. Guerrini, D. M. Pickup, Y.-S. Liu, K. Edstrom, J. Guo, A. V. Chadwick, L. C. Duda, P. G. Bruce,
Nat. Chem. 2016, 8, 684; c) T.-Y. Chen, B. Han, C.-W. Hu,
Y.-F. Su, Y.-X. Zhou, H.-Y. Chen, P. Pan, C.-M. Wu, A. Hu, J.-J. Kai, Y.-D. Juang, C.-C. Chang, J. Phys. Chem. C 2018, 122, 12623.
[16] Y. Xie, M. Saubanère, M.-L. Doublet, Energy Environ. Sci. 2017, 10, 266.
[17] J. Xu, M. Sun, R. Qiao, S. E. Renfrew, L. Ma, T. Wu, S. Hwang, D. Nordlund, D. Su, K. Amine, J. Lu, B. D. McCloskey, W. Yang, W. Tong, Nat. Commun. 2018, 9, 947.
[18] A. J. Perez, Q. Jacquet, D. Batuk, A. Iadecola, M. Saubanère, G. Rousse, D. Larcher, H. Vezin, M.-L. Doublet, J.-M. Tarascon, Nat.
Energy 2017, 2, 954.
[19] E. McCalla, A. M. Abakumov, M. Saubanère, D. Foix, E. J. Berg, G. Rousse, M.-L. Doublet, D. Gonbeau, P. Novák, G. Van Tendeloo, R. Dominko, J.-M. Tarascon, Science 2015, 350, 1516;
[20] a) J. Rodriguez-Carvajal, Phys. B 1993, 192, 55; b) J. Rodriguez-Carvajal,
Comm. Powder Diffr. (IUCr) Newsl. 2001, 26, 12.
[21] V. Briois, C. La Fontaine, S. Belin, L. Barthe, Th. Moreno, V. Pinty, A. Carcy, R. Girardot, E. Fonda, J. Phys.: Conf. Ser. 2016, 712, 012149. [22] J.-P. Rueff, J. M. Ablett, D. Céolin, D. Prieur, Th. Moreno, V. Balédent, B. Lassalle, J. E. Rault, M. Simon, A. Shukla, J.
Synchro-tron Radiat. 2015, 22, 175.
[23] a) G. Kresse, J. Furthmüller, Phys. Rev. B 1996, 54, 11169; b) G. Kresse, D. Joubert, Phys. Rev. B 1999, 59, 1758; c) J. P. Perdew, K. Burke, M. Ernzerhof, Phys. Rev. Lett. 1996, 77, 3865.
[24] a) S. Grimme, A. Jens, S. Ehrlich, H. Krieg, J. Chem. Phys. 2010,
132, 154104; b) S. Grimme, S. Ehrlich, L. Goerigk, J. Comput. Chem.
2011, 32, 1456.
[25] S. L. Dudarev, G. A. Botton, S. Y. Savrasov, C. J. Humphreys, A. P. Sutton, Phys. Rev. B 1998, 57, 1505.
![Figure 2. (i) Galvanostatic charge–discharge analysis of P2-Na 2/3 [Mn 7/9 Zn 2/9 ]O 2 in Na half-cells a) charge– discharge cycles with the derivative plot as inset b) capacity retention plot and rate capability signature as inset](https://thumb-eu.123doks.com/thumbv2/123doknet/2973710.82847/5.892.183.710.125.316/galvanostatic-discharge-analysis-discharge-derivative-retention-capability-signature.webp)
![Figure 3. In situ XRD analysis a) structural evolution of P2-Na 2/3 [Mn 7/9 Zn 2/9 ]O 2 as a function of sodium deinsertion and reinsertion](https://thumb-eu.123doks.com/thumbv2/123doknet/2973710.82847/6.892.179.720.110.595/figure-analysis-structural-evolution-function-sodium-deinsertion-reinsertion.webp)

![Figure 6. a) Mn K-edge XANES spectra of the ex situ P2-Na 2/3 [Mn 7/9 Zn 2/9 ]O 2 compared with some selected references for Mn 3+ (Mn 2 O 3 ) and Mn 4+ (LiMn 2 O 4 delithiated)](https://thumb-eu.123doks.com/thumbv2/123doknet/2973710.82847/9.892.128.760.111.640/figure-xanes-spectra-compared-selected-references-limn-delithiated.webp)