HAL Id: inria-00536556
https://hal.inria.fr/inria-00536556
Submitted on 16 Nov 2010
HAL is a multi-disciplinary open access
archive for the deposit and dissemination of
sci-entific research documents, whether they are
pub-lished or not. The documents may come from
teaching and research institutions in France or
abroad, or from public or private research centers.
L’archive ouverte pluridisciplinaire HAL, est
destinée au dépôt et à la diffusion de documents
scientifiques de niveau recherche, publiés ou non,
émanant des établissements d’enseignement et de
recherche français ou étrangers, des laboratoires
publics ou privés.
Self-Adaptative Distributed Data Management System
Alexandra Carpen-Amarie, Jing Cai, Alexandru Costan, Gabriel Antoniu, Luc
Bougé
To cite this version:
Alexandra Carpen-Amarie, Jing Cai, Alexandru Costan, Gabriel Antoniu, Luc Bougé. Bringing
Intro-spection into BlobSeer: Towards a Self-Adaptative Distributed Data Management System. [Research
Report] RR-7452, INRIA. 2010, pp.22. �inria-00536556�
a p p o r t
d e r e c h e r c h e
0 2 4 9 -6 3 9 9 IS R N IN R IA /R R --7 4 5 2 --F R + E N GBringing Introspection into BlobSeer: Towards a
Self-Adaptative Distributed Data Management
System
Alexandra Carpen-Amarie — Jing Cai — Alexandru Costan — Gabriel Antoniu — Luc Bougé
N° 7452
Centre de recherche INRIA Rennes – Bretagne Atlantique
System
Alexandra Carpen-Amarie, Jing Cai, Alexandru Costan, Gabriel
Antoniu, Luc Bougé
Thème : Calcul distribué et applications à très haute performance Équipe-Projet KerData
Rapport de recherche n° 7452 — Septembre 2010 — 22 pages
Abstract: Introspection is the prerequisite of an autonomic behavior, the first
step towards a performance improvement and a resource-usage optimization for large-scale distributed systems. In Grid environments, the task of observing the application behavior is assigned to monitoring systems. However, most of them are designed to provide general resource information and do not consider specific information for higher-level services. More precisely, in the context of data-intensive applications, a specific introspection layer is required to collect data about the usage of storage resources, about data access patterns, etc.
This paper discusses the requirements for an introspection layer in a data-management system for large-scale distributed infrastructures. We focus on the case of BlobSeer, a large-scale distributed system for storing massive data. The paper explains why and how to enhance BlobSeer with introspective ca-pabilities and proposes a three-layered architecture relying on the MonALISA monitoring framework. Then we propose a preliminary approach for enabling self-protection for the BlobSeer system, through a malicious clients detection component. The introspective architecture has been evaluated on the Grid’5000 testbed, with experiments that prove the feasibility of generating relevant in-formation related to the state and the behavior of the system.
Key-words: Distributed system, storage management, large-scale system,
Résumé : L’introspection est une condition nécessaire à l’autonomie: c’est
la première étape vers l’amélioration des performances et l’optimisation de l’utilisation des ressources pour les systèmes repartis à grande échelle. Dans les grilles de calcul, la surveillance du comportement des applications est à la charge des systèmes de monitoring. Néanmoins, la plupart d’entre eux sont conçus pour produire des informations génériques concernant les ressources et ils ne prennent pas en considération les informations spécifiques aux ser-vices de plus haut niveau. Plus précisément, dans le contexte des applications où les données sont utilisées de façon intensive, une couche spécifiquement dédiée à l’introspection est nécessaire pour recueillir des informations liées à l’utilisation des ressources de stockage, aux principaux schémas d’accès aux données, etc.
Ce travail propose de relever les défis posés par le développement d’une couche d’introspection pour des systèmes de gestion des données réparties à large échelle comme BlobSeer. Ce rapport analyse les raisons et les moyens d’ajouter une capacité d’introspection à BlobSeer et propose une architecture à trois niveaux basée sur la plateforme de surveillance MonALISA. Nous proposons ensuite une approche préliminaire pour introduire une capacité d’autoprotection dans BlobSeer grâce à un nouveau module de détection des clients malveillants.
Cette architecture introspective a été évaluée sur la plate-forme expérimen-tale Grid’5000 à travers des tests qui démontrent la faisabilité de la génération des informations pertinentes liées à l’état et au comportement du système.
Mots-clés : Systèmes repartis, gestion des données, système à large échelle,
1
Introduction
Managing data at a large scale has become a critical requirement in a wide spec-trum of research domains, ranging from data-mining to high-energy physics, biology or climate simulations. Grid infrastructures provide the typical envi-ronments for such data-intensive applications, enabling access to a large num-ber of resources and guaranteeing a predictable Quality of Service. However, as the exponentially growing data is correlated with an increasing need for fast and reliable data access, data management continues to be a key issue that highly impacts on the performance of applications.
More specifically, storage systems intended for very large scales have to address a series of challenges, such as a scalable architecture, data location transparency, high throughput under concurrent accesses and the storage of massive data with fine grain access. Although these requirements are the pre-requisites for any efficient data-management system, they also imply a high degree of complexity in the configuration and tuning of the system, with pos-sible repercussions on the system’s availability and reliability.
Such challenges can be overcome if the system is outfitted with a set of self-management mechanisms that enable autonomic behavior, which can shift the burden of understanding and managing the system state from the human ad-ministrator to an automatic decision-making engine. However, self-adaptation is impossible without a deep and specific knowledge of the state of both the system and the infrastructure where the system is running on. It heavily re-lies on introspection mechanisms, which play the crucial role of exposing the system behavior accurately and in real time.
On existing geographically-distributed platforms (e.g. Grids), introspec-tion is often limited to low-level tools for monitoring the physical nodes and the communication interconnect: they typically provide information such as CPU load, network traffic, job status, file transfer status, etc. In general, such low-level monitoring tools focus on gathering and storing monitored data in a scalable and non-intrusive manner [27].
Even though many Grid monitoring applications have been developed to address such general needs [18] [9], little has been done when it comes to en-abling introspection for large-scale distributed data management. This is par-ticularly important in the context of data-intensive applications distributed at a large scale. In such a context, specific parameters related to data storage need to be monitored and analyzed in order to enable self-optimization in terms of resource usage and global performance. Such parameters regard physical data distribution, storage space availability, data access patterns, application-level throughput, etc.
This paper discusses the requirements of a large-scale distributed data-management service in terms of data-management. It explains which self-adaptation directions can serve a data-management service designed for large-scale infrastructures. Furthermore, it focuses on introspection, identifying the specific ways in which introspection can be used to enable an autonomic be-havior of a distributed data storage system.
As a case study, we focus on BlobSeer [19], a service for sharing massive data at very large scale in a multi-user environment. We propose a three-layered architecture enabling BlobSeer with introspection capabilities. We val-idate our approach through an implementation based on the generic
MonAL-ISA [16] monitoring framework for large-scale distributed services. Moreover, we provide an application for the introspection layer, by developing a self-protection module that takes advantage of the introspective features that Blob-Seer is equipped with.
The remainder of the paper is organized as follows. Section 2 summarizes existing efforts in the Grid monitoring systems field, emphasizing their limita-tions when it comes to enabling specific introspection requirements. Section 3 explains which self-management directions fit the needs of data-management systems. Section 4 provides a brief description of BlobSeer, while Section 5 describes the specific self-adaptation goals that can be served by introspection mechanisms in such a data-management system. It also describes the data that need to be collected and the solution we designed and implemented, based on the MonALISA monitoring framework. Section 6 provides an application for the introspective features of BlobSeer, namely the preliminary steps towards a self-protection component. In Section 7 we discuss the feasibility and effi-ciency of our approach, by presenting a visualization tool and a set of experi-ments realized on the Grid’5000 testbed. Finally, Section 8 draws conclusions and outlines directions for future developments.
2
Related work
The autonomic behavior of large scale distributed systems aims to deal with the dynamic adaptation issues by embedding the management of complex systems inside the systems themselves, alleviating the users and administra-tors from additional tasks. A distributed service, like a storage service, is said to be autonomic if it encapsulates some autonomic behavior [10] such as self-configuration, self-optimization, self-healing, and self-protection [15]. The fo-cus of our ongoing research is to transparently introduce autonomic behavior within a distributed storage system in order to make it more resilient to the failure of the component nodes (self-healing behavior), to enforce the meth-ods used to deal with malicious clients (self-protection behavior) as well as to optimize the overall performance based on various computed metrics derived from an introspection layer (self-optimization behavior).
In this context, performance evaluation becomes a critical component of any dynamic system that requires high throughput, scheduling, load balancing or analysis of applications’ performances and communications between nodes. In Grid environments, previous research has often limited to using historical information to create models on which various analysis and mining techniques are applied. The results were thereafter used for performing more efficient job mappings on available resources. The autonomic behavior depends on moni-toring the distributed system to obtain the data on which decisions are based. Experience with production sites showed that in large distributed systems with thousands of managed components, the process of identifying the causes of faults in due time by extensive search through the potential root failure injec-tors proves rather time-consuming and difficult. This process may interrupt or obstruct important system services. Several techniques were used to address these issues.
One approach relies on Bayesian Networks (BNs) [6], often used to model systems whose behaviors are not fully understood. We investigated some
con-sistent work already done on the probabilistic management in distributed sys-tems. Hood et. al utilize Bayesian networks for the proactive detection of ab-normal behavior in a distributed system [11]. Steinder et al. apply Bayesian reasoning techniques to perform fault localization in complex communication systems [23]. Ding et al. present the probabilistic inference in fault man-agement based on Bayesian networks [7]. However, the Bayesian Network paradigm used within all these works does not provide direct mechanisms for modeling the temporal dependencies in dynamic systems [22], which is essen-tial for enhancing the autonomic behavior.
Another approach takes time into consideration by identifying the dynamic changes in distributed systems as a discrete nonlinear time series. One can in-vestigate time series data aiming at finding some patterns that can trigger spe-cific actions. In order to identify these patterns, time series are often viewed as consisting of several components: trend, cycle and irregular fluctuations. However, recent research showed that it is a challenging task to provide both scalable and precise continuous system monitoring in large-scale settings to serve as a data injector for these pattern discovery systems. Existing produc-tion system monitoring soluproduc-tions typically use long informaproduc-tion updates to tradeoff information precision for low monitoring cost. Most of autonomic systems call for more fine-grained, up-to-date, monitoring data.
Previous research work on scalable distributed monitoring for autonomous systems can be broadly classified into two categories: relying on decentralized architectures such as hierarchical aggregation [25] or peer-to-peer structure [1] to distribute monitoring workload; and trading off information coverage [17] or information precision [13] for lower monitoring cost. In contrast, our re-search focuses on identifying the relevant parameters for an autonomic intro-spection layer, while relying on the extension and adaptation of some exist-ing monitorexist-ing tools for trackexist-ing these parameters. The monitorexist-ing solution should further meet our needs for non-intrusiveness and minimized monitor-ing costs.
Exploring correlation patterns among distributed monitoring data sources has been extensively studied in various contexts such as sensor network mon-itoring [26], distributed event tracking [12], and resource discovery [4]. While the general idea of exploring temporal and spatial correlations is not new, we shall emphasize applying the idea to distributed information tracking over large-scale networked systems requires non-trivial system analysis and design. In our case, it means discovering dynamic correlation patterns (for some prede-fined targeted events: node failures, malicious clients intrusions, etc.) among distributed information sources, using light-weight methods instead of assum-ing a specific probabilistic model, as in wireless sensor networks, for instance. The works mentioned above, although they are able to provide some means of monitoring for singular or aggregate services, they do not dynamically re-place the faulty service once failure has been detected, or take automated ac-tions to optimize the overall system’s performance, as our work aims to within a large scale distributed storage system.
3
Self-adaptation for large scale data-management
systems
A large scale data-management platform is a complex system that has to deal with changing rates of concurrent users, the management of huge data spread across hundreds of nodes or with malicious attempts to access or to damage stored data. Therefore, such a system can benefit from a self-adaptation com-ponent that enables an autonomic behavior. We refine the set of self-adaptation directions that best suit the the requirements of data-management systems: they match the main self-management properties defined for autonomic sys-tems [15] [21].
Self-awareness is the feature that enables a system to be aware of the resource
usage and the state of its components and of the infrastructure where they are running. This is mainly achieved through monitoring and inter-preting the relevant information generated by the usage of the system.
Self-optimization is the ability to efficiently allocate and use resources, while
dealing with changing workloads. It aims at optimizing the system’s per-formance and increasing data availability.
Self-configuration is the property that addresses the dynamic adaptation of
the system’s deployment scheme as a response to changing environment conditions. The system has to be able to reconfigure on the fly, when its state requires or allows for a change in the number of managed nodes.
Self-protection addresses the detection of hostile or intrusive actions directed
towards the system’s components and enables the system to automat-ically take appropriate measures to enforce security policies and make itself less vulnerable to subsequent similar attacks.
In order to improve the performance and the efficiency of the resource us-age in a data-sharing system, we define a set of goals that justify the need for the aforementioned properties:
Monitoring The constant surveillance of the state of a system and of the
events that trigger system reactions is the prerequisite of all the other self-adaptation directions. Thus, the self-awareness property is of utmost impor-tance for providing support for an autonomous behavior.
Dynamic dimensioning The performance of data-access primitives is
influ-enced by the number of running nodes of the data-sharing system. Moreover, the load of each component that stores data is also dependent on the available storage nodes and on their capacity to serve user requests. On the other hand, the workload is often unpredictable, and the deployment of the system on a large number of physical nodes can lead to underused storage nodes when the number of clients is low or the stored data is not large enough.
These reasons account for the need to enhance a large-scale storage system with a mechanism that dynamically adjusts the number of deployed storage nodes. This is equivalent to taking advantage of the real-time indicators of the
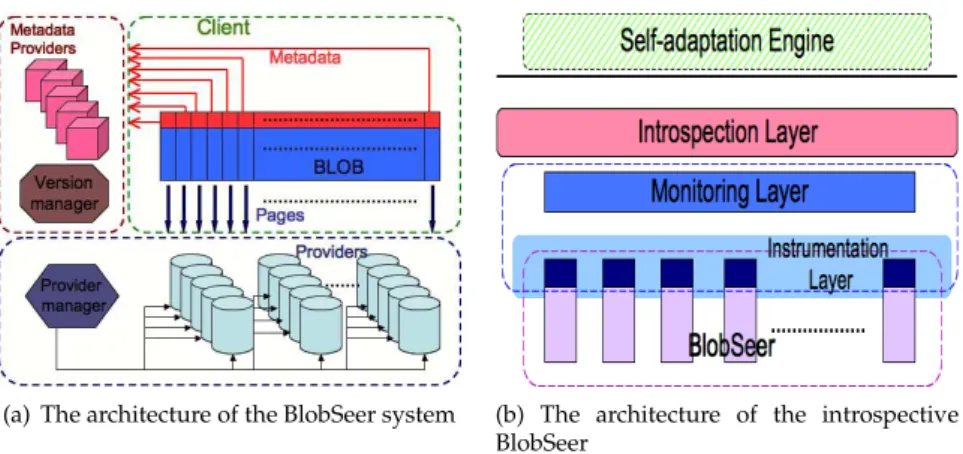
(a) The architecture of the BlobSeer system (b) The architecture of the introspective BlobSeer
Figure 1: BlobSeer
state of the system within a self-configuration component that can observe a heavy load or underutilized components.
Adaptive allocation algorithms and replication strategies Data striping is
an essential requirement of a system that deals with huge data sequences. In addition, the placement strategies for the data chunks play a key role in achiev-ing a high throughput when accessachiev-ing the stored data. Data replication is an-other important feature of a data-sharing system, since many applications re-quire a high data availability. The appropriate replication degree for a given data block is not always the same, as the needs of the application can evolve along with the amount of stored data and with the number of clients concur-rently accessing it. These two aspects justify the need for a self-optimization building block within a large-scale storage system. It has to address both the automatic adaptation of the allocation algorithms for the storage nodes corre-sponding to the data chunks and the dynamic adjustment of the replication degree, according to the load of the storage nodes and to data access patterns.
Malicious clients detection A data-sharing system distributed on a large
number of nodes can fit the needs of applications that generate important amounts of data only if it can provide a degree of security for the stored in-formation. For this reason, the system has to be able to recognize malicious requests generated by unauthorized users and to block illegal attempts to in-ject or to modify data. Therefore, a self-protection component that enforces these requirements has to be integrated into the system.
4
BlobSeer
BlobSeer is a data-sharing system which addresses the problem of efficiently storing massive, unstructured data blocks called binary large objects (referred to as BLOBs further in this paper), in large-scale, distributed environments. The BLOBs are fragmented into small, equally-sized chunks, called pages. BlobSeer provides an efficient fine-grained access to the pages belonging to each BLOB,
as well as the possibility to modify them, in distributed, multi-user environ-ments.
The architecture of BlobSeer (Figure 1(a)) includes multiple, distributed entities. Clients initiate all BLOB operations: CREATE, READ, WRITE and APPEND. There can be many concurrent clients accessing the same BLOB or different BLOBs in the same time. The support for concurrent operations is en-hanced by storing the pages belonging to the same BLOB on multiple storage
providers. The metadata associated with each BLOB are hosted on other
com-ponents, called metadata providers. BlobSeer provides versioning support, so as to prevent pages from being overwritten and to be able to handle highly-concurrent WRITE and APPEND operations. For each of them, only a patch composed of the range of written pages is added to the system. Finally, the system comprises two more entities: the version manager that deals with the serialization of the concurrent WRITE/APPEND requests and with the assign-ment of version numbers for each new WRITE/APPEND operation; the provider
manager, which keeps track of all storage providers in the system.
As far as this paper is concerned, an APPEND operation can be considered as a special case of WRITE. Therefore, we disregard this distinction in the rest of the paper. Everything stated about WRITEs is also true for APPENDs, unless explicitly specified.
A typical setting of the BlobSeer system involves the deployment of a few hundreds storage providers, storing BLOBs of the order of the TB. The typi-cal size for a page within a blob can be smaller that 1 MB, whence the chal-lenge of dealing with hundreds of thousands of pages belonging to just one BLOB. BlobSeer provides efficient support for heavily-concurrent accesses to the stored data, reaching a throughput of 6.7 GB/s aggregated bandwidth for a configuration with 60 metadata providers, 90 data providers and 360 concur-rent writers, as explained in [20].
5
Towards an introspective BlobSeer
Our goal is to enhance BlobSeer with introspection capabilities, in order to en-able this data-sharing platform with an autonomic behavior. To meet this goal, we have designed a three-layered architecture aiming at identifying and gen-erating relevant information related to the state and the behavior of the sys-tem (Figure 1(b)). Such information is then expected to serve as an input to a higher-level self-adaptation engine. These data are yielded by an (1) introspection layer, which processes the raw data collected by a (2) monitoring layer. The low-est layer is represented by the (3) instrumentation code that enables BlobSeer to send monitoring data to the upper layers.
5.1
Self-adaptation: what to adapt?
To introduce an autonomic behavior in BlobSeer, we considered several as-pects.
Dynamic dimensioning Extensive performance evaluations [20] carried out
for BlobSeer reveal that the aggregate bandwidth of concurrent WRITE or READ operations grows as the number of data providers and metadata
providers increases. However, deploying BlobSeer’s providers on a large ber of physical nodes can be an expensive approach, and their optimum num-ber is often unpredictable, as it depends on the load of the providers and on the number of clients concurrently accessing them.
These aspects justify the need for a mechanism enabling a dynamic adjust-ment of the number of running data/metadata providers, according to the state of the system and its real-time requirements in terms of load and number of client requests and available nodes.
State-dependent allocation algorithms for storage providers Currently,
each time a client writes some data on a BLOB, it receives a set of providers from the provider manager, and writes each page on one of them. The provider manager allocates the providers in a round-robin manner; therefore a balanced storage-space load among providers is expected.
Nevertheless, the behavior may deviate from the expected one, as several factors can impact the efficiency of such a straightforward load-balancing algo-rithm. The number of concurrent clients requesting access to the same provider plays a major role in the performance of the WRITE or READ operations. Con-current data accesses have to be serialized, leading to slow or even unrespon-sive providers. A more advanced provider-allocation algorithm, taking into account such factors that influence the behavior of the providers, would bring an improvement of the overall performance of BlobSeer.
Adaptive data replication strategies BlobSeer is designed to be used by
data-intensive applications, such as the ones related to astronomy, data mining or multimedia processing. To fully fit the needs of these applications, it also has to ensure that a number of replicas is maintained for the stored data. When a BLOB is created, the client has to specify the number of replicas that will be generated for each of its pages. But the “optimal” number of replicas may vary across the BLOB’s versions and even across pages, as their usage patterns may be different. As a consequence, BlobSeer can benefit from a self-tuning mechanism for dynamic selection of the replication level for each BLOB.
5.2
Introspection: what data to collect?
All the improvement directions stated above can only be effective if the self-adaptation engine receives accurate data from the introspection layer. The lat-ter generates data ranging from general information about the running nodes to specific data regarding the stored BLOBs and their structure.
General information These data are essentially concerned with the physical
resources of the nodes that act as storage providers. They include CPU usage, network traffic, disk usage, storage space or memory.
A self-adapting system has to take into account information about the val-ues of these parameters across the nodes that make up the system, as well as about the state of the entire system. For instance, the used and available storage space at each single provider play a crucial role in deciding whether additional providers are needed or not. Besides the values for these basic data belonging
to each provider, the system also needs access to aggregated data, such as the value of the total storage space occupied/available for the entire system.
Individual BLOB-related data The most significant information for a single
BLOBis its access pattern, i.e. the way the pages and the versions are accessed through READ and WRITE operations. The basic data are the number of read accesses for each page that the BLOB version consists of, and the number of WRITEoperations performed on the BLOB for each page. Since each WRITE or READ operation consists in accessing a range of consecutive pages, it is ex-pected that some ranges of pages will have the same number of accesses. As a consequence, these data facilitate the identification of the regions of the BLOB comprising pages with a similar number of accesses, information that can in-fluence the adopted replication strategy.
From another viewpoint, the number of accesses can be associated with the version of the BLOB that they refer to. This approach enables a comparison between the sizes of the versions and their usage, i.e. the number of READ requests for each of them. This is a valuable information for the replication algorithms, which can assign more replicas to the versions highly accessed by the clients.
Global state Even though the provider-allocation algorithm or the
replica-tion strategy have access to the details within each BLOB, it is not irrelevant to have an overview of the whole data stored in the BlobSeer system, from a higher-level point of view. Some of the key data at this global level are the to-tal number of accesses associated with each provider. This is a measure of the load of each of them and can directly influence the selection of the providers that will be allocated new pages, depending on their deviation from the aver-age load within the system.
The other system-wide data refer to the distribution of all the BLOBs across providers. The number of BLOB pages hosted on each provider, as well as their sizes, comprise a compact information about the way the data are man-aged. It can trigger a response from the provider manager, in case there are load variations between the providers with respect to one or more BLOBs. It can be equally useful to expose the BLOBs that have a high rate of change or growth, as opposed to the BLOBs that contain data that is seldom modified. The dynamic growth of the BLOBs can be emphasized through the number of WRITEoperations performed on each BLOB, which is equivalent to the num-ber of versions, or through the numnum-ber of pages written for each BLOB, i.e. the total size of its versions.
5.3
Monitoring: how to collect?
The input for the introspective layer consists of raw data that are extracted from the running nodes of BlobSeer, collected and then stored, a set of operations realized within the monitoring layer. Therefore, it can rely on a monitoring system designed for large-scale environments that implements these features. Such a monitoring framework has to be both scalable and extensible, so as to be able to deal with the huge number of events generated by a large-scale
data-management system, as well as to accommodate system-specific monitoring information and to offer a flexible storage schema for the collected data.
The monitoring framework – MonALISA The Global Grid Forum [8]
pro-posed a Grid Monitoring Architecture (GMA) [24], which defines the compo-nents needed by a scalable and flexible Grid monitoring system: producers, consumers, and a directory service. A wide variety of Grid monitoring sys-tems [27], such as Ganglia [18], RGMA [5], GridICE [3], comply with this ar-chitecture.
Among them, we selected MonALISA (Monitoring Agents in a Large
Inte-grated Services Architecture) [16] for our data-monitoring tasks, as it is a
general-purpose, flexible framework, which provides the necessary tools for collect-ing and processcollect-ing monitorcollect-ing information in large-scale distributed systems. Moreover, it is an easily-extensible system, which allows the definition and processing of user-specific data, by means of an API for dynamically-loadable modules. MonALISA is currently used to monitor large high-energy physics facilities; it is deployed on over 300 sites belonging to several experiments, such as CMS or ALICE [2].
MonALISA is based on four layers of services, the Lookup and Discovery
Ser-vices, the MonALISA services – the components dealing with the data-collection
tasks, the Proxy services that make possible the communication between the services and the clients and the MonALISA clients and repositories, which act as consumers.
In BlobSeer, the main challenge the monitoring layer has to cope with, is the large number of storage provider nodes and therefore the huge number of BLOBpages, versions and huge BLOB sizes. Furthermore, it has to deal with hundreds of clients that concurrently access various parts of the stored BLOBs, as they generate a piece of monitoring information for each page accessed on each provider. MonALISA is suitable for this task, as it is a system designed for large-scale environments and it proved to be both scalable and reliable.
Instrumenting BlobSeer The data generated by the instrumentation layer
are relayed by the monitoring system and finally fed to the introspection layer. The instrumentation layer is implemented as a component of the monitoring layer. The MonALISA framework provides a library called ApMon that can be used to send the monitoring data to the MonALISA services. At the providers, the instrumentation code consists in listeners located on each of them, which report to the monitoring system each time a page is written or read. The mon-itoring information from the version manager is collected using a parser that monitors the events recorded in the logs. The state of the physical resources on each node is monitored through an ApMon thread that periodically sends data to the monitoring service.
6
Introducing self-adaptation for BlobSeer -
mali-cious clients detection
In order to provide a proof of concept for the introspective BlobSeer, we de-signed a component that makes use of the user activity history yielded by the
introspection layer to identify illegal or harmful client actions. Detecting ma-licious clients is the first step towards enabling self-protection for the BlobSeer system. However, such a feature has to take into account several types of secu-rity threats and to react when such attacks occur.
In this section, we discuss the directions that should be addressed by such a self-protection component and propose a simple malicious clients detection module that focuses on protocol breaches within BlobSeer.
6.1
Scenarios for malicious user behavior
Detecting malicious accesses within data-management systems consists of two phases. The first one implies the creation of a history of the users’ actions and the constant monitoring of their real-time data-accesses. The second phase corresponds to the detection of the malicious user behavior. In this section, we consider the problem of detecting illegal user actions and focus on a set of malicious behavior scenarios:
Protocol breach. A malicious user can try to compromise the system by
delib-erately breaking the data-insertion protocols. This kind of behavior is a starting point for DoS attacks, in which the user attempts to overload the system through large numbers of malformed or incomplete requests. To cope with this security risk, advanced mechanisms have to be developed to quickly detect the illegal accesses and isolate the user that initiated them.
Breaking existing policies. Enabling data-access policies is a key design
prin-ciple for accountability in a data-management system. The policies de-fine a set of restrictions associated with users or with groups of users, such as transfer-bandwidth limitations or storage quotas. By monitoring the user activity, any attempt to break these policies can be detected and the user’s access rights can be restricted accordingly.
Abnormal client activity. Whereas the first two scenarios emphasize
misbe-havior detection, another approach is to analyze the user’s access pat-terns and to identify anomalies in their activity, even though it is correct with respect to the access protocols and policies. In this case, a deviation from the previously observed behavior can be a symptom of an unautho-rized access to data or an attempt to affect the system.
6.2
Protocol breach scenarios for BlobSeer
We focus on detecting protocol breaches, as this approach is a critical feature of a data-management system that has to face malicious users. Its goal is to identify the known forms of protocol misuse, and thus to maintain a consistent state for the data stored into the system.
In BlobSeer, accesses to data can be classified into three categories:
BLOB creation is achieved through a request to the version manager, which
The READ operation consists of two phases. First, the metadata associated
with the required BLOB id and version are gathered from the metadata providers. Second, the stored pages are read from the data providers, whose locations were contained within the fetched metadata.
The WRITE operation implies several steps. The user connects to the
provider manager and requests a list of data providers that can host the pages to be written. Then, the pages are written in parallel on the data providers. Finally, after this step is successfully completed, the client writes the metadata to the metadata providers and then publishes the new version to the version manager.
The creation of new BLOBs cannot be the target of a data-access protocol attack, since it consists of only one request that is atomically handled by the version manager. Furthermore, the read operation is not concerned with this type of attack either; the users are allowed to read as many metadata as they want. They may read just a part of the pages corresponding to the metadata they fetched, or the metadata can be cached for further use. Therefore, no assumption can be made on the relationship between the collected metadata and the read pages, since the protocol does not require the user to read a fixed number of metadata records and all the associated pages.
In contrast, the WRITE operation imposes a strict protocol to the user that wants to correctly insert data into the system. For simplicity we can assume that it consists of two independent phases that have to be executed consecu-tively:
The data-writing step comprises the user’s request for a list of data providers
and the transfer of the page range to be written to those providers.
The data-publication step is represented by the creation of the metadata
asso-ciated with the written data and the publication of the written page range as a new version.
A correct WRITE operation is defined as the successful completion of the aforementioned steps, with the constraint that the published information con-cerning the written page range is consistent with the actual data sent to the data providers. As a consequence, there are three types of protocol breaches that can be detected for the WRITE operation:
Data written and not published. In this case, a malicious user obtains a list of
providers from the provider manager and then starts writing data to the providers. The second step is never issued and thus the version man-ager, which keeps track of all the BLOBs and their versions, will never be aware of the data inserted into the system. This kind of protocol breach can be developed into a Denial of Service (DoS) attack, targeted to the overloading of one or more data providers.
Data published without being written. This scenario is representative for a
user who attempts to compromise the system by making available data that does not actually exist. Thus, other users might try to read the pub-lished data without being aware that the metadata contain fake refer-ences.
Publication of inconsistent data. The attack that corresponds to this situation
aims to disrupt the computations that use data stored by the BLOBs. As an example, the user might write just the data corresponding to the be-ginning of the published range. Therefore, an application can start read-ing and processread-ing the data and discover only later that the used BLOB version is incomplete. Hence the computation would be compromised and the application forced to restart the processing.
6.3
The detection mechanism
Enabling self-protection in BlobSeer relies on coupling a malicious-clients de-tection module with the introspection layer. On the one hand, such a module has to identify the malicious activities that attempt to compromise the system and to isolate users that initialize them. On the other hand, it should not inter-fere with BlobSeer operations, so as to preserve the efficient data-accesses for which BlobSeer is optimized. The introspection layer processes informations monitored independently of the interactions between the user and the system, and thus it is an ideal candidate to provide input data for a malicious clients detection module.
We implemented a simple detection module that addresses the protocol-breach attacks and generates blacklists with the users that attempt them. Its input data are provided as a user history database by the introspection layer. The database is updated each time a user accesses data in BlobSeer and the monitoring system receives corresponding notifications. The detection mod-ule comprises several components, each of them dealing with a specific type of protocol breach. Each component performs the following operations: it pe-riodically requests updates from the history database and identifies the incon-sistencies between the data collected from the providers and the data that orig-inates from the version manager. Then, a score associated with each client is computed, so as to identify the clients that repeatedly misbehave. Finally, the system generates a blacklist with the detected clients and their associated score. The goal of the detection mechanism is to keep track of the malicious users and to feed this information back into the BlobSeer system, so as to enable it to react when receiving new requests from the users identified as malicious. The malicious users can be made available to the provider manager as a blacklist where each user’s score shows the amount of fake data that the user intro-duced into the BlobSeer system. The provider manager implements the allo-cation strategy that assigns providers for each user WRITE operation. Being aware of the blacklist, the provider manager can decide to block the malicious users by not granting the providers when they want to write again into the system. The behavior of the provider manager can be further refined by tak-ing into account the score associated with each client. In this case, there are several other constraints that can be enforced on the users, such as a decreased bandwidth for their WRITE operations, a waiting time imposed before being assigned the necessary list of providers or a size limit for the data written.
(a) Number of WRITE accesses on the
logi-cal address pages for a BLOB (b) Version access patterns
Figure 2: BLOB accesses visualization
7
Experimental evaluation
We evaluated the feasibility of gathering and interpreting the BlobSeer-specific data needed as input data for the different self-optimizing directions. Our approach was to create an introspection layer on top of the monitoring sys-tem, able to process the raw data collected from BlobSeer and to extract sig-nificant information regarding the state and the behavior of the system. We performed a series of experiments that evaluate the introspection layer and also provide some preliminary results concerning the introduction of self-protection capabilities in BlobSeer. The experiments were conducted on the Grid’5000 [14] testbed, a large-scale experimental Grid platform, with reconfig-uration and control capabilities, that covers 9 sites geographically distributed across France.
7.1
Visualization tool for BlobSeer-specific data
We implemented a visualization tool that can provide a graphical representa-tion of the most important parameters yielded by the introspecrepresenta-tion layer.
We show the outcome of the introspection layer through an evaluation per-formed on 127 nodes belonging to a Grid’5000 cluster in Rennes. The nodes are equipped with x86_64 CPUs and at least 4 GB of RAM. They are interconnected through a Gigabit Ethernet network. We deployed each BlobSeer entity on a dedicated node, as follows: two nodes were used for the version manager and the provider manager, 10 nodes for the metadata providers, 100 nodes for the storage providers and 10 nodes acted as BlobSeer clients, writing data to the BlobSeer system. Four nodes hosted MonALISA services, which transferred the data generated by the instrumentation layer built on top of the BlobSeer nodes to a MonALISA repository. The repository is the location where the data were stored and made available to the introspection layer.
In this experiment, we used 10 BLOBs, each of them having the page size of 1 MB and a total size larger than 20 GB. We started the 10 clients, each of them having to create a BLOB and to write 10 data blocks of 2 GB each on it. Each data block overlaps the previous one by 10%. Next, we started the clients
Figure 3: BLOBs versions and sizes
in parallel and each of them performed a number of WRITE operations on a randomly selected BLOB. The blocks were written on the BLOB at random off-sets and they consisted of a random number of pages, ranging between 512 MB and 2 GB in size. This experiment lasted for a dozen minutes. All figures below are real graphical representations of data provided by the introspection layer at the end of this experiment.
We processed the raw data collected by the monitoring layer and extracted the higher-level data within the introspection layer. Some results are presented below, along with their graphical representations.
Access patterns They represent a significant information that the
introspec-tion layer has to be aware of. It can be obtained by computing the number of READ/WRITE accesses. The access patterns can be examined from two points of view. The first one regards the access patterns for each BLOB. It considers the number of read accesses for each page, for a specified version or for the whole BLOB and it identifies the regions of the BLOB composed of pages with the same number of accesses (Figure 2(a)). The other one refers to the number of READ or WRITE operations performed on each provider, allowing a classi-fication of the providers according to the pressure of the concurrent accesses they have to withstand.
The distribution of READ/WRITE accesses across the BLOB versions The
versions can be weighted by counting the number of read accesses or of phys-ical memory pages for each of them, as shown in Figure 2(b). This approach exposes the tendencies of the READ operations over the versions or the various sizes of the WRITE operations, as the number of write accesses for a specified version is equivalent with the number of pages written.
The structure and sizes of all the stored BLOBs The differences between
BLOBs, in terms of size or number of versions, highlight the BLOBs that have the most important growth (Figure 3). This information, along with the num-ber of accesses for each BLOB, emphasize the most valuable BLOBs in the sys-tem.
0 1000 2000 3000 4000 5000 0 10 20 30 40 50 60 70 80 Aggregated throughput (MB/s) Number of clients BSmon BS
(a) The aggregated throughput of the
WRITEoperation for BlobSeer (BS) and for
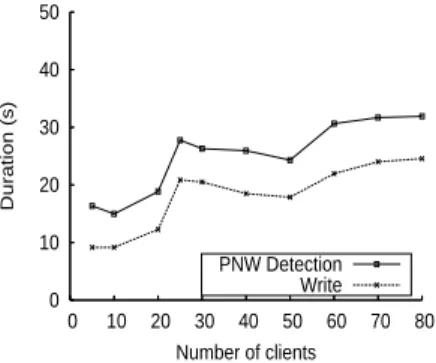
BlobSeer with the monitoring support en-abled (BSMON) 0 10 20 30 40 50 0 10 20 30 40 50 60 70 80 Duration (s) Number of clients PNW Detection Write
(b) The WRITE duration and the detection delay when concurrent clients that publish data without writing it (PNW) access the BlobSeer system
Figure 4: Performance evaluations
7.2
Impact of the introspection architecture on the Blobseer
data-access performance
This experiment is designed to evaluate the impact of using the BlobSeer sys-tem in conjunction with the introspection architecture. The introspective layer collects data from BlobSeer without disrupting the interactions between its components, and thus no constraint is enforced on the user’s accesses to the BlobSeer entities. In this way the throughput of the BlobSeer system is not in-fluenced by the detection module. The only downside of such a system is the intrusiveness of the instrumentation layer that runs at the level of the BlobSeer components and is susceptible of decreasing their performance.
For this experiment we used the Grid’5000 clusters located in Rennes and Orsay. The nodes are equipped with x86_64 CPUs and at least 2 GB of RAM. We used a typical configuration for the BlobSeer system, which enables the system to store massive amounts of data that can reach the order of TB. It con-sists of 150 data providers, 20 metadata providers, one provider manager and one version manager. Both data and metadata providers store data on their hard disks and they are configured to store up to 64 GB and 8 GB, respectively. The MonALISA monitoring services are deployed on 20 nodes and they col-lect monitoring data from all the providers, each of them being dynamically assigned to a monitoring service in the deployment phase. The repository that gathers all the monitored parameters is located outside Grid’5000, as well as the detection module that interacts only with the repository’s database. Each entity is deployed on a dedicated physical machine.
This test consists of deploying a number of concurrent clients that make a single WRITE operation. Each client writes 1 GB of data in a separate BLOB, using a page size of 8 MB. Since the introspective layer computes its output based on the monitored data generated for each written page, the more fine-grained BLOBs we use, the more monitoring information has to be processed. Therefore, we allocate 128 pages for each client to show the ability of the intro-spective system to deal with a large number of monitored parameters.
We compare the aggregated throughput of the BlobSeer WRITE operation obtained when deploying BlobSeer alone and with the introspection layers on top of it. The throughput is measured for a number of clients ranging from 5 to 80 and the experiment was repeated 3 times for each value of the number of clients deployed.
Figure 4(a) shows that the BlobSeer system enhanced with the introspective components performs well even when the number of generated monitoring parameters reaches 10, 000, as it is the case when testing with more than 80 clients. Note that the duration of the WRITE operations performed by these 80 clients in parallel is under 5 seconds. Therefore the system is able to cope with a high rate of monitoring data generated when a wave of clients concurrently access the system.
7.3
Malicious clients detection
We aim to explore the first step towards a self-protecting BlobSeer system, by building a component that can detect illegal actions and prevent malicious users from damaging the stored data. To reach this goal, the detection mech-anism for the malicious users has to deliver an accurate image of the users’ interaction with BlobSeer. Moreover, it has to expose the illegal operations as fast as possible, so as to limit the size of data illegally injected into the sys-tem and to prevent the malicious users from carrying on the harmful accesses. We define the detection delay as the duration of the detection phase after the end of the client’s operations. We use the detection delay as a measure of the performance of the detection module.
The aim of this experiment is to analyze the performance of the detec-tion module when the system is accessed by multiple concurrent malicious clients that publish data without actually writing them. This access pattern corresponds to a scenario where a number of clients access a reputation-based data-storage service. Each client can increase his reputation by sharing a large amount of data with the other users of the system. To achieve this goal, a mali-cious client may pretend to share huge data, while it only skips the data writing phase of the WRITE operation and publishes inexistent data.
The deployment settings are identical to the previous experiment. We want to assess the behavior of the system under illegal concurrent accesses. Thus we deploy only malicious clients, repeating the test with an increasing number of clients, ranging from 5 to 80. We measure both the duration of the WRITE operation of the client and the delay between the beginning of the WRITE and the detection of the client that initiated it as being malicious. All the clients start writing at the same time, thus having the same start time. For each point in the chart, we compute the average time between all the clients deployed for that run.
The results obtained in Figure 4(b) show that the detection process is able to cope with a large number of concurrent clients and to deliver results in a short amount of time after the end of the WRITE operation.
8
Conclusions and future work
This paper addresses the challenges raised by the introduction of introspec-tion into a data-management system for large-scale, distributed infrastruc-tures. Such a feature aims at exposing general and service-specific data to a higher-level layer, in order to enable the system to evolve towards an auto-nomic behavior. We propose a layered architecture built on top of the BlobSeer data-management system, a service dedicated to large-scale sharing of massive data. The goal of this architecture is to generate a set of specific data that can serve as input for a self-adaptive engine. The architecture consists of 3 layers: 1) an instrumentation layer that extracts the low-level, raw data from the dif-ferent components of BlobSeer; 2) a monitoring layer that deals with collecting and storing the monitoring data from the instrumentation layer; and 3) an in-trospective layer that processes the gathered data into higher-level information describing the state and the behavior of the system.
We also proposed a malicious clients detection component that relies on data yielded by the introspection layer. It focuses on identifying data-access protocol breaches in BlobSeer, thus being the first step towards enhancing this system with self-protection.
To build the monitoring layer, we relied on the MonALISA general-purpose, large-scale monitoring framework, for its versatility and extensibility. Our experiments showed that it was able to scale with the number of BlobSeer providers and to cope with the huge amount of monitoring data generated by a large number of clients. Moreover, it allowed us to define and to col-lect BlobSeer-specific data, and to extend the existing visualization charts with new ones that met the requirements of BlobSeer. The experiments performed confirm the outcome of the introspection layer, by means of graphical repre-sentations associated with the various high-level data extracted.
The next step will consist in developing the malicious clients detection module into a generic security component that can handle a greater number of security threats and can take actions to prevent harmful client activities, thus enabling self-protection for BlobSeer. Furthermore, we will equip Blob-Seer with other self-adaptive components that will employ the output of the introspection layer to optimize the system’s performance and resource usage. As an example, by allowing BlobSeer to dynamically dimension the number of each of its entities, this engine will help improving the storage resource alloca-tion strategy. Besides, it can also provide informaalloca-tion based on which adaptive data replication strategies can be implemented. Together, such features will enable an autonomic behavior of the BlobSeer data-management platform.
Acknowledgments
Experiments presented in this paper were carried out using the Grid’5000 ex-perimental testbed, being developed under the INRIA ALADDIN develop-ment action with support from CNRS, RENATER and several Universities as well as other funding bodies (see http://www.grid5000.org/).
References
[1] Jeannie Albrecht, David Oppenheimer, Amin Vahdat, and David A. Pat-terson. Design and implementation tradeoffs for wide-area resource dis-covery. In In Proceedings of 14th IEEE Symposium on High Performance,
Re-search Triangle Park, pages 113–124. IEEE Computer Society, 2005.
[2] ALICE. The MonALISA Repository for ALICE. http://pcalimonitor.cern.ch/map.jsp, 2010.
[3] S. Andreozzia, N. De Bortoli, S. Fantinel, et al. GridICE: a monitoring service for grid systems. Future Generation Computer Systems, 21(4):559– 571, April 2005.
[4] Michael Cardosa and Abhishek Chandra. Resource bundles: Using ag-gregation for statistical wide-area resource discovery and allocation. In
28th IEEE International Conference on Distributed Computing Systems (ICDCS
2008), pages 760–768, Beijing, China, 2008.
[5] A. Cooke, A. Gray, W. Nutt, et al. The relational grid monitoring archi-tecture: Mediating information about the grid. Journal of Grid Computing, 2(4):323–339, 2004.
[6] R. G. Cowell, A. P. Dawid, S. L. Lauritzen, and D. J. Spiegelhalter.
Proba-bilistic Networks and Expert Systems. Springer-Verlag, New York, 1999.
[7] Jianguo Ding, Bernd J. Krämer, Yingcai Bai, and Hansheng Chen. Proba-bilistic inference for network management. In Universal Multiservice
Net-works: Third European Conference, ECUMN 2004, pages 498–507, 2004.
[8] GGF. The Global Grid Forum. http://www.ggf.org/, 2010.
[9] Dan Gunter, Brian Tierney, Brian Crowley, Mason Holding, and Jason Lee. Netlogger: A toolkit for distributed system performance analysis. In MASCOTS ’00: Proceedings of the 8th International Symposium on
Mod-eling, Analysis and Simulation of Computer and Telecommunication Systems,
page 267, Washington, DC, USA, 2000. IEEE Computer Society.
[10] S. Gurguis and A. Zeid. Towards autonomic web services: Achieving self-healing using web services. In Proceedings of DEASÕ05, Missouri, USA, May 2005.
[11] C. Hood and C. Ji. Automated proactive anomaly detection. In Proceedings
of IEEE International Conference of Network Management (IM97), pages 688–
699, San Diego, California, May 1997.
[12] Ankur Jain, Edward Y. Chang, and Yuan-Fang Wang. Adaptive stream resource management using Kalman filters. In SIGMOD ’04: Proceedings
of the 2004 ACM SIGMOD international conference on Management of data,
pages 11–22, New York, NY, USA, 2004. ACM.
[13] Navendu Jain, Dmitry Kit, Prince Mahajan, Praveen Yalagandula, Mike Dahlin, and Yin Zhang. STAR: self-tuning aggregation for scalable moni-toring. In VLDB ’07: Proceedings of the 33rd international conference on Very
[14] Y. Jégou et al. Grid’5000: a large scale and highly reconfigurable exper-imental grid testbed. Intl. Journal of High Performance Comp. Applications, 20(4):481–494, 2006.
[15] Jeffrey O. Kephart and David M. Chess. The vision of autonomic comput-ing. Computer, 36(1):41–50, 2003.
[16] I. Legrand, H. Newman, R. Voicu, et al. MonALISA: An agent based, dynamic service system to monitor, control and optimize grid based ap-plications. In Computing for High Energy Physics, Interlaken, Switzerland, 2004.
[17] Jin Liang, Xiaohui Gu, and Klara Nahrstedt. Self-configuring informa-tion management for large-scale service overlays. In INFOCOM 2007. 26th
IEEE International Conference on Computer Communications, Joint Conference
of the IEEE Computer and Communications Societies, pages 472–480, 2007.
[18] M. Massie, B. Chun, and D. Culler. The Ganglia distributed monitor-ing system: design, implementation, and experience. Parallel Computmonitor-ing, 30(7):817–840, 2004.
[19] B. Nicolae, G. Antoniu, and L. Bougé. BlobSeer: How to enable efficient versioning for large object storage under heavy access concurrency. In
Data Management in Peer-to-Peer Systems, St-Petersburg, Russia, 2009.
[20] B. Nicolae, G. Antoniu, and L. Bougé. Enabling high data throughput in desktop grids through decentralized data and metadata management: The BlobSeer approach. In Proceedings of the 15th International Euro-Par
Conference, pages 404–416, Delft, Netherlands, 2009.
[21] Manish Parashar and Salim Hariri. Autonomic computing: An overview. In Unconventional Programming Paradigms, pages 247–259. Springer Verlag, 2005.
[22] Eugene Santos, Jr. and Joel D. Young. Probabilistic temporal networks: A unified framework for reasoning with time and uncertainty. International
Journal of Approximate Reasoning, 20(3):263–291, 1999.
[23] Ma?gorzata Steinder and Adarshpal S. Sethi. Probabilistic fault localiza-tion in communicalocaliza-tion systems using belief networks. IEEE/ACM
Trans-actions on Networking, 12(5):809–822, October 2004.
[24] B. Tierney, R. Aydt, and D. Gunter. A grid monitoring architecture. Grid Working Draft GWD-PERF-16-3, August 2002. http://www.gridforum.org/. [25] Robbert Van Renesse, Kenneth P. Birman, and Werner Vogels. Astro-labe: A robust and scalable technology for distributed system monitoring, management, and data mining. ACM Transactions on Computer Systems, 21(2):164–206, May 2003.
[26] Mehmet C. Vuran and Ian F. Akyildiz. Spatial correlation-based collab-orative medium access control in wireless sensor networks. IEEE/ACM
[27] Serafeim Zanikolas and Rizos Sakellariou. A taxonomy of grid monitoring systems. Future Generation Computing Systems, 21(1):163–188, 2005.
Centre de recherche INRIA Grenoble – Rhône-Alpes : 655, avenue de l’Europe - 38334 Montbonnot Saint-Ismier Centre de recherche INRIA Lille – Nord Europe : Parc Scientifique de la Haute Borne - 40, avenue Halley - 59650 Villeneuve d’Ascq
Centre de recherche INRIA Nancy – Grand Est : LORIA, Technopôle de Nancy-Brabois - Campus scientifique 615, rue du Jardin Botanique - BP 101 - 54602 Villers-lès-Nancy Cedex
Centre de recherche INRIA Paris – Rocquencourt : Domaine de Voluceau - Rocquencourt - BP 105 - 78153 Le Chesnay Cedex Centre de recherche INRIA Saclay – Île-de-France : Parc Orsay Université - ZAC des Vignes : 4, rue Jacques Monod - 91893 Orsay Cedex
Centre de recherche INRIA Sophia Antipolis – Méditerranée : 2004, route des Lucioles - BP 93 - 06902 Sophia Antipolis Cedex
Éditeur
INRIA - Domaine de Voluceau - Rocquencourt, BP 105 - 78153 Le Chesnay Cedex (France)