HAL Id: hal-02072471
https://hal.archives-ouvertes.fr/hal-02072471
Submitted on 19 Mar 2019
HAL is a multi-disciplinary open access
archive for the deposit and dissemination of
sci-entific research documents, whether they are
pub-lished or not. The documents may come from
teaching and research institutions in France or
abroad, or from public or private research centers.
L’archive ouverte pluridisciplinaire HAL, est
destinée au dépôt et à la diffusion de documents
scientifiques de niveau recherche, publiés ou non,
émanant des établissements d’enseignement et de
recherche français ou étrangers, des laboratoires
publics ou privés.
Web View: Measuring & Monitoring Representative
Information on Websites
Antoine Saverimoutou, Bertrand Mathieu, Sandrine Vaton
To cite this version:
Antoine Saverimoutou, Bertrand Mathieu, Sandrine Vaton. Web View: Measuring & Monitoring
Representative Information on Websites. ICIN 2019 - QOE-MANAGEMENT 2019 : 22nd
Con-ference on Innovation in Clouds, Internet and Networks and Workshops, Feb 2019, Paris, France.
�10.1109/ICIN.2019.8685876�. �hal-02072471�
Web View: Measuring & Monitoring
Representative Information on Websites
https://webview.orange.com
Antoine Saverimoutou, Bertrand Mathieu
Orange Labs Lannion, France
Email: {antoine.saverimoutou,bertrand2.mathieu}@orange.com
Sandrine Vaton
Institut Mines Telecom Atlantique Brest, France
Email: [email protected]
Abstract—Web browsing is a fast-paced and changing domain which delivers a wide set of services to users. While end-users’ QoE (Quality of Experience) is the main focus of large service companies and service providers, websites’ structure on the one hand change relentlessly. There is therefore a strong need to measure the temporal quality of web browsing by using user-representative web browsers, different Internet protocols and types of residential network access. We present in this paper our tool, Web view, which performs automated desk-top web browsing sessions where each measurement provides 61 monitoring parameters. An analysis of 8 Million different measurements of web pages’ homepage indicate which and how different parameters can impact today’s web browsing quality. Web measurement campaigns conducted since February 2018 are represented through a monitoring website. Our analysis and monitoring of measurements on a 10-month period show that Google Chrome brings increased web browsing quality.
Keywords— Web Browsing, Web Monitoring, QoE, QoS I. INTRODUCTION
Web browsing is the most important Internet service and offering the best experience to end-users is of prime impor-tance. The Web was originally meant to deliver static contents but has dramatically changed to dynamic web pages offering built-in environments for education, video streaming or social networking [1]. Content is nowadays served over different Internet protocols, namely HTTP/1.1, HTTP/2 (Version 2 of the HyperText Transfer Protocol) [2] or QUIC (Quick UDP Internet Connections) [3] where the latter is paving its way to standardization. Network operators and service providers on the other hand bring along innovative networking architectures and optimized CDN (Content Delivery Networks) to enhance the offered QoS (Quality of Service). Focused at measuring the induced quality when performing web browsing, the W3C (World Wide Web Consortium) and research community have also brought along different web metrics providing information regarding when and what objects are downloaded.
Various tools have also been laid out by the research com-munity to measure web browsing quality but are either not embarked with latest updated browsers, cannot execute JavaScript which is nowadays the de facto web technology or collect a limited amount of measurement and monitoring parameters. Wanting to objectively quantify and qualify web
browsing, there is a clear need to finely reproduce an end-user environment and habitual actions. Our first contribution in this paper is to present our tool, Web View which performs automated web browsing sessions and collects 61 different quality indicators for every measurement. Our second contri-bution is to present the different parameters that can increase or decrease web browsing quality upon different browsers. Last but not the least, we present through our monitoring website the temporal evolution of a set of websites and how different residential network access and Internet protocols can leverage web browsing quality.
The paper is structured as follows: We first go through in section II the existing web metrics and related work meant to quantify and qualify web browsing, followed by section III which describes our tool, Web View. Through section IV we expose the different parameters that can increase or im-pact web browsing quality following different web browsers. Section V presents our monitoring website and we finally conclude in section VI.
II. BACKGROUND ANDRELATEDWORK
Policies and processing algorithms used by web browsers to render web pages are different among them. In order to bring uniform benchmarking indicators, standardization bodies such as the W3C, in collaboration with large service companies have brought along a set of web metrics to better measure web page loading. The Page Load Time1(PLT) is the time between the start of navigation and when the entire web page has been loaded. The Resource Timing2 provides information upon the downloaded resources unit-wise, such as the transport protocol used, size and type of the downloaded object or some low level networking information. The Paint Timing3 exposes the First
Paint (FP) which is the time for a first pixel to appear on the end-user’s browser screen since web navigation start. The Above-The-Fold (ATF) [4] exposes the time needed to fully load the visible surface area of a web page at first glance. The Speed Index and RUM (Real User Monitoring) expose a score
1https://www.w3.org/TR/navigation-timing/ 2https://www.w3.org/TR/resource-timing-2/ 3https://www.w3.org/TR/paint-timing/
representing the visible surface area occupancy of a web page. The TFVR (Time for Full Visible Rendering) [5] is an ATF browser-based technique which is calculated by making use of the web browser’s networking logs and processing time.
To measure QoE during web browsing sessions, several tools have been developed by the research community. FPDe-tective [6] uses a PhantomJS4 and Chromium based
automa-tion insfrastructure, OpenWPM [7] performs automated web browsing driven by Selenium5 while supporting stateful and stateless measurements and the Chameleon Crawler6 is a Chromium based crawler used for detecting browser finger-printing. XRay [8] and AdFisher run automated personalization detection experiments and Common Crawl7 uses an Apache Nutch based crawler. All these tools (among others) have largely contributed to the research field but when wanting to objectively quantify and qualify web browsing, latest on-market web browsers, different Internet protocols and network access need to be used. We have thus developed our own tool, Web View (where the root architecture is the same as OpenWPM), which offers fine-grained information through the latest implemented web metrics by different web browsers and data obtained from network capture and web browser’s HAR8. We also collect information on remote web servers spreaded all over the globe, the downloaded objects’ type, size and Internet protocols through which they are downloaded at different stages of the web page loading process.
While some research work [9], [10] provide headlines how to better qualify user-experience, other studies investigate the impact of different Internet protocols on web browsing quality [11], [12], [13], [14]. Other research studies question the versatility and objectiveness of the PLT to measure end-user’s QoE [15], [16], [17], [18] putting emphasis that what the end-user sees on its screen should be primarily measured. While [19] presents through a website the evolution of the HTTP/2 protocol in today’s Web, to the best of our knowledge, no public monitoring website focused at web browsing quality exists, which we present in this paper. When studying web browsing quality, the induced quality delivered by different web browsers, Internet protocols, network bandwidths and types of websites need to be taken into account.
III. OUR TOOL
Web View9 offers 61 different indicators when performing automated web browsing sessions in graphical or headless mode on unitary or list of websites’ main web page. Mea-surement campaigns can be performed upon a wide set of customizable parameters such as a requested Internet protocol, use of different real on-market web browsers, select a specific device network interface and use different types of ad blockers.
4http://phantomjs.org/ 5https://www.seleniumhq.org/ 6https://github.com/ghostwords/chameleon 7https://commoncrawl.org/ 8HTTP Archive 9https://webview.orange.com/WebViewArchi
Our tool embarks the Google Chrome browser (v.63 or v.68) and the Mozilla Firefox browser (v.62).
A. What information Web View collects?
Among the different collected parameters, Web View offers networking and web browser’s processing time and fine-grained information on the different remote web servers serving contents. While Google Chrome supports HTTP/1.1, HTTP/2 and QUIC, the Mozilla Firefox browser does not support the QUIC protocol. Service providers or corporate companies might disable certain Internet protocols in their network and content servers might deliver contents to end-users through a specific Internet protocol; thus increasing the need to study induced web browsing quality following different Internet protocols.
When performing automated web browsing sessions, request-ing HTTP/1.1 deactivates the HTTP/2 and QUIC protocol in the browser; when requesting HTTP/2, QUIC is deactivated but fallback to HTTP/1.1 is allowed (not all content-servers are HTTP/2-enabled); when requesting QUIC, we allow fallback to HTTP/1.1 and HTTP/2 for non-UDP web servers; when requesting QUIC Repeat, we favor 0-RTT UDP and 1-RTT TCP by firstly performing a navigation to the website, close the browser, clear the resources’ cache but keep the DNS (Domain Name System) cache and navigate once more to the website where measurements are collected. The resources’ cache is always emptied at the start and end of web browsing sessions and a timeout of 18 seconds is set.
The tool collects 4 different loading times for each measure-ment, namely the FP, TFVR, the processing time and the PLT. Real network traffic is also collected from which is investigated the corresponding DNS time for the main web page domain and through the collected HAR is assessed the overall number of objects downloaded and their MIME (Mul-tipurpose Internet Main Extensions) type. From the exposed remote servers’ IP address correlated to MaxMind10 database is identified the continents from which these resources are downloaded (in HTTP or HTTPS), the number of domains serving the contents and the category of the website as referenced by Alexa. As per the different collected timings, which indicate a web page loading progression through time, the number of resources downloaded in these lapses of time are assessed as well as the Internet protocol through which they are delivered.
B. How Web View collects information?
Automated web browsing sessions can be conducted on unitary, a list of pre-defined websites or by indicating the Top N Alexa websites. If an integer N is specified, the Alexa Pluginmodule automatically retrieves the list of Top N Alexa websites to be assessed.
The Test Configuration module verifies the correctness of all the input parameters before starting the measurement campaign. The Test Engine module two-fold purpose is to
Web browsers
Benchmarks Chromev.63 Chromev.68 Chromev.70 Firefoxv.62 Firefoxv.64 SunSpider 1.0.2 1 2 3 5 4 Octane 2.0 2 5 3 1 4 Kraken 1.1 1 3 2 4 5 JetStream 1.1 1 2 4 3 5 MotionMark 1.1 3 5 4 1 2 Speedometer 2.0 2 4 5 1 3 Basemark 3 5 4 2 1 3 WebXPRT 3 1 3 4 5 2 HTML5Test 2 3 5 1 4 ARES-6 1 4 2 3 5
TABLE I: Web browser obtaining highest score provides increased efficiency upon different benchmarking techniques
initialize and collect measurements’ data. Upon the selected web browser, the Test Initialization sub-module calls the corresponding web driver, loads the ad blocker standalone if requested and sets the different desired options e.g activating the QUIC protocol, setting the browser window-size, select the corresponding device network interface, etc. The Data Collectionsub-module retrieves measurements’ data which is then handed to the Data Computation & Interpretation module to perform additional assessment.
The Test Execution & Display Module executes the measure-ment of a specific website through the desired web browser in graphical or headless mode and retrieves the corresponding HAR file. In parallel through a JavaScript, different web browsing embedded metrics (FP, DOM, PLT) exposed by the browser are retrieved and the TFVR is calculated. The Data Computation & Interpretation module then performs further computation on the obtained web browsing results. From the obtained HAR file, information regarding the different remote web servers serving contents is calculated, namely through which protocol is every resource downloaded or the continent from which they are delivered. The Results Visualization mod-ule automatically parses collected data to a JSON Grafana11 format and is uploaded to our monitoring website. The Data Storagemodule then compresses all measurements which are uploaded to a remote server.
IV. MEASURINGWEBBROWSINGQUALITY Automated web browsing sessions are performed 24/7/365 by five different desktop machines (CPU Intel Core i5 and 8 Go RAM) under Ubuntu 16.0.4 over three different residential network access, i.e ADSL (10Mbps down, 1Mbps up), WIFI (200Mbps down, 160Mbps up) and FIBER (800Mbps down, 300Mbps up). Google Chrome v.63 and v.68 is driven by Chromedriver and Mozilla Firefox v.62 driven by Geckodriver. We present in this section the analysis of 8 Million different measurements12collected from 68 different websites (from the
Top 50 Alexa websites and 18 additional websites put forth by the ARCEP13) since February 2018. We take into consideration
11https://grafana.com/
12https://webview.orange.com/public/sampleDataset.zip
13Independent French agency regulating telecommunications in France.
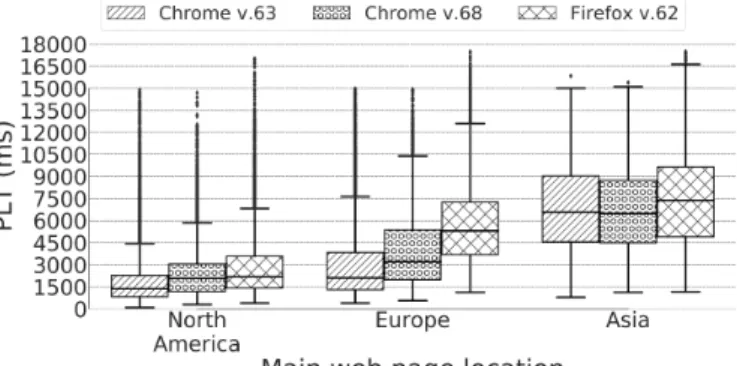
Fig. 1: Observed PLT from different web browsers
the impact of the requested protocol on the PLT and TFVR among the different collected metrics. Among the assessed websites, 32 websites have their main web page domain located in North America (55.35% of the measurements), 22 in Europe (25.36% of the measurements) and 14 in Asia (19.26% of the measurements).
A. Which browser should deliver enhanced user-experience? Different benchmarking tools are available in order to define which browser can bring better experience in terms of responsiveness, graphics performance, latency and throughput. As illustrated in Table I, 5 different web browsers have been benchmarked by 10 benchmarking techniques and the browser obtaining the highest score is considered as delivering best user-experience. When assessing the responsiveness of web applications through Speedometer, Google Chrome v.70 wins by delivering increased speed of the DOM APIs, JavaScript engine and CSS style resolution. When assessing graphics performance through MotionMark, Google Chrome v.68 has higher scores (Firefox is slower at image processing and drawing canvas line segments). Through JetStream, Firefox v.64 delivers best latency and throughput scores. Basemark identifies Chrome v.63 as starting up the fastest and using least computing power.
Putting apart web browser versions, the overall benchmark-ing match between Chrome and Firefox is declared as a 5-5 draw where each assessed web browser functionality can outperform the other through different benchmarking tools.
B. Impact of web browsers on the Page Load Time
Websites are all disparate among them and can be hosted by different web servers all over the globe. Our measurements being made from a fixed location (France), taking into account the main web page geographic location is of prime importance. As depicted in Fig.1, PLT times range from 216.05 ms to 17859 ms. When the main web page is located in North America less than 25% of the measurements have a PLT less than 2274.2 ms when using Chrome v.63, 3041.7 ms when using Chrome v.68 and 3570.3 ms when using Firefox v.62. Due to increased functionalities of Chrome v.68 versus Chrome v.63, on average 3 more resources are downloaded
(a) Requesting HTTP/1.1 (b) Requesting QUIC (c) Requesting QUIC Repeat
Fig. 2: TFVR loading time upon requested protocol with window size 1400x900
(a) ADSL (b) WIFI (c) FIBER
Fig. 3: Networking time when requesting HTTP/2 through Google Chrome v.63
(pre-fetching of Google objects), which contribute to a longer processing and networking time. Measured websites located in North America are mainly Google websites having a PLT ranging from 216.05 ms to 4500 ms and the outliers are non-Google Shopping websites where a greater number of objects need to be downloaded. When the main web page is in Asia, the median PLT for Chrome v.63 is 6575.2 ms, 6469.5 ms for Chrome v.68 and 7379 ms for Firefox v.62. Due to our geographic position, the total networking time mainly contributes to this increase in loading times.
Among the measured websites, 61.02% are Google websites and when using Chrome, although the resources’ cache is emptied, an average number of 3 resources (Google favicon and css) are pre-fetched. When these 3 resources are needed on a web page, Chrome v.68 loads these objects from its cache, reducing its overall networking time.
C. Impact of requested protocol on TFVR
The TFVR which provides the loading time of the visible portion of a web page is correlated to the end-user’s browser window size. When performing automated web browsing sessions, four different window sizes are assessed and when a main web page is located in North America, with a window size of 1920x1080, less than 75% of the websites have a visible portion less than 81.26%.
HTTP/1.1 When requesting HTTP/1.1 as shown in Fig.2a, less than 80% of the websites have a TFVR less than 3301 ms with a Chrome v.63, less than 5600 ms with a Chrome v.68 and less than 7021 ms with a Firefox v.62. While Chrome v.68 downloads on average 3 more resources compared to Chrome v.63, the TFVR is higher. On the other hand, Firefox v.62 downloads 4 more resources compared to Chrome v.68 (no pre-fetching from Google web servers at startup) which increases its processing and networking time.
QUIC Fig.2b depicts the TVFR when requesting the QUIC protocol and less than 80% of the websites have a TFVR less than 3496.23 ms with Chrome v.63, less than 4902.87 ms with Chrome v.68 and less than 6915 ms with Firefox v.62. While Chrome v.63 negotiates QUIC version 37-39 and Chrome v.68 negotiates QUIC v.43 with remote UDP-enabled web servers, the Firefox web browser does not support QUIC and a fallback is automatically made to HTTP/2.
QUIC Repeat When requesting QUIC Repeat through Chrome v.63, for less than 80% of the measured websites, the TFVR is decreased by 25.58% (from 3496.23 ms to 2601.76 ms) compared to requesting the QUIC protocol. This decrease is mainly due to no DNS lookups and non-UDP enabled web servers downloading objects in 1-RTT. On the other hand, Firefox does take advantage of the 1-RTT TCP and the overall networking times are reduced, but the processing times are increased due to the selected window size of 1400x900, where the css-transformed elements take more time to be processed. Requesting QUIC Repeat favors the download of objects in 0-RTT UDP and 1-RTT TCP. While Chrome brings increased web quality, the Firefox web browser does not support the QUIC protocol and only benefits from 1-RTT TCP.
D. Impact of the network access
Web metrics bring along web page loading times as a whole, composed of networking time (time to download objects from remote content servers) and processing time (time for the corresponding web browser to parse and render elements).
1) Networking time: The Fig.3 illustrates the overall net-working time when a web page is fully loaded through the Chrome v.63 web browser and requesting the HTTP/2 protocol. While main web pages located in North America and Europe take full advantage of the increased bandwidth when moving from ADSL to FIBER, main web pages located in
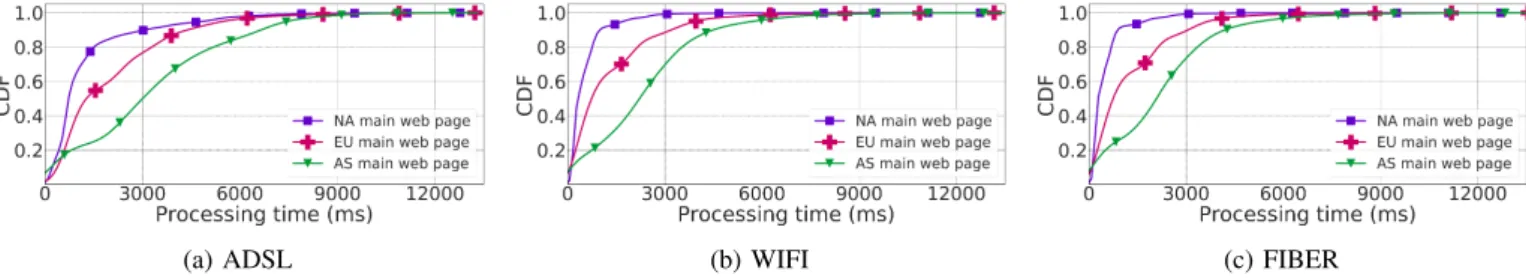
(a) ADSL (b) WIFI (c) FIBER
Fig. 4: Processing time when requesting HTTP/2 through Google Chrome v.63
Fig. 5: Websites’ structure changing over time
Asia suffer from waiting time. Requesting HTTP/2 and main web page being in Asia, on average 67.58% of the resources are downloaded in HTTP/1.1 and due to a maximum of six parallel connections to the same host, waiting time stays the same and perceived web browsing quality does not change.
2) Processing time: The Fig.4 illustrates the overall pro-cessing time when requesting HTTP/2 through Chrome v.63. With the increase in use of JavaScript in web pages’ structure, the corresponding network access has a direct impact on the processing time. When objects are downloaded through higher bandwidths, the blocking and waiting time is reduced; downloaded objects can be processed faster. When a main web page is located in North America, the processing time is reduced on average by 26.13% from ADSL to WIFI and by 7.56% from WIFI to FIBER. When a main web page is located in Asia, the processing time reduction is mean when moving from ADSL to WIFI.
The perceived end-user’s web browsing quality is tightly linked to the used network access. Increased bandwidth re-duces accordingly networking and processing time.
V. MONITORINGWEBBROWSINGQUALITY Monitoring websites over long periods of time can shed more light on websites’ structure evolution, from which conti-nent objects are downloaded or loading times at different hours of the day. We highlight in this section through our monitoring website, the implications of the requested protocol, network access and used web browser since February 2018 on web browsing quality.
Fig. 6: Website baidu.com PLT over time
A. How often does websites’ structure change?
The perceived end-user’s web browsing quality is largely dependent upon the type of the visited website. As depicted in Fig.5, obtained from our monitoring website, four different websites are represented, showing the number of objects downloaded when using an ad blocker through Chrome v.68 during the month of September 2018. While the website google.com and 360cn.com download the same number of objects, the websites youtube.com and reddit.com download different number and types of objects at different times of the day. Regarding youtube.com the change in number of objects downloaded is mainly due to different types of advertisement banners (a banner may be composed of one or several images). The website reddit.com has a social networking web page structure, where at different times of the day, users may posts texts, images or videos, thus making the overall number of downloaded objects to greatly fluctuate.
Upon the remote website category, web pages have different inner structures, composed of different MIME type objects and the downloaded number of objects can greatly fluctuate.
B. Can websites’ performance be assessed on the fly? Through our monitoring website, an end-user can graph-ically verify on the fly the different loading times of web pages when requesting an Internet protocol following a specific network access. The Fig.6 illustrates the PLT of the website baidu.com from October 13 to October 23 2018 when re-questing HTTP/1.1 through Chrome v.68. From October 13 to October 17 (06H00 UTC), the average PLT is 4516.2 ms and abruptly decreases to 1712.9 ms (decrease of 62.1%) from
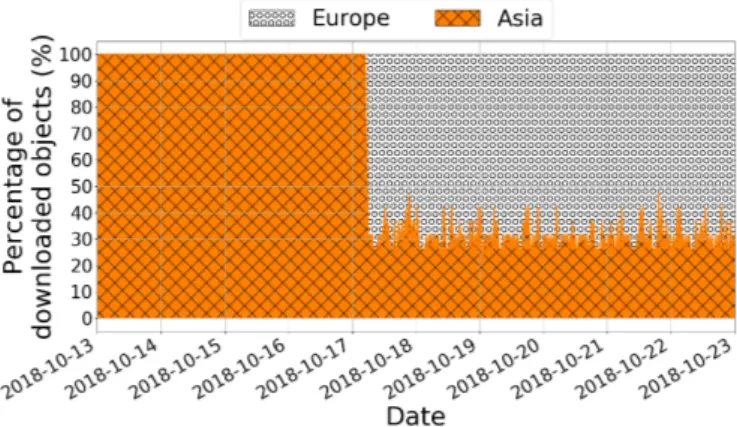
Fig. 7: Continent-wise downloaded objects for baidu.com
October 17 (07H00 UTC) to October 23. Through the different monitoring panels, an end-user can see that the number of downloaded objects or FP stays the same. When scrolling through the other panels, we can see that the processing time decreases accordingly (although the objects’ MIME types stay the same). When investigating from which continent the resources are downloaded, depicted in Fig.7, we can identify that during the period October 13 to October 17, on average 18 objects are downloaded from Asia, but in the period October 18 to October 23, on average 12 objects are downloaded from Europe and 6 objects from Asia. The decrease in PLT (networking and processing time) is thus due to resources being delivered from Europe instead of Asia.
Our monitoring website helps in monitoring a set of web-sites by assessing the web page loading times, number of objects downloaded, from where objects are downloaded and also helps in troubleshooting end-users’ web browsing quality.
VI. CONCLUSION
In this paper we have shown the importance of performing automated web browsing sessions through real on-market different web browsers, use different Internet protocols and user-representative residential network access to bring light on the parameters which can increase or decrease web browsing quality. Our monitoring website helps in monitoring a set of websites and the induced temporal web browsing quality i.e the remote websites’ structure evolution, through which Internet protocol the objects are delivered and from where they are downloaded. Among the measured websites, 61.02% are Google websites and when using Google Chrome, an average of 3 resources are pre-fetched on the browser’s start-up, thus decreasing the overall download time and through benchmarking techniques, Google Chrome is best at graphical rendering and contributes at increased web browsing quality (compared to Mozilla Firefox).
Measurements have been performed in France and an ongo-ing and future work is to perform measurements from different locations all over the globe. The used web browsers will also be updated to Chrome v.70 and Firefox v.64 and new browsers
such as Brave or Safari will be introduced, together with MOS (Mean Opinion Score) studies.
ACKNOWLEDGEMENT
This work is partially funded by the French National Re-search Agency (ANR) BottleNet project, No ANR-15-CE25-0013-001.
REFERENCES
[1] S. Ihm and V. S. Pai, “Towards understanding modern web traffic,” in Proceedings of the 11th ACM SIGCOMM Internet Measurement Conference, IMC ’11, Berlin, Germany, November 2-, 2011.
[2] M. Belshe, R. Peon, and M. Thomson, “Hypertext Transfer Protocol Version 2 (HTTP/2),” Internet Requests for Comments, RFC 7540, 2015. [3] J. Iyengar and M. Thomson, “QUIC: A UDP-Based Multiplexed and Secure Transport,” Internet Engineering Task Force, Internet-Draft draft-ietf-quic-transport-17, Dec. 2018, work in Progress.
[4] I. Grigorik. (2012, jul) Above the fold time: Measuring web page performance visually. [Online]. Available: http://conferences.oreilly. com/velocity/velocity-mar2011/public/schedule/detail/18692
[5] A. Saverimoutou, B. Mathieu, and S. Vaton, “Web browsing mea-surements: An above-the-fold browser-based technique,” in 38th IEEE International Conference on Distributed Computing Systems, ICDCS 2018, Vienna, Austria, July 2-6, 2018.
[6] G. Acar, M. Ju´arez, N. Nikiforakis, C. D´ıaz, S. F. G¨urses, F. Piessens, and B. Preneel, “Fpdetective: dusting the web for fingerprinters,” in 2013 ACM SIGSAC Conference on Computer and Communications Security, CCS’13, Berlin, Germany, November 4-8, 2013, 2013, pp. 1129–1140. [7] S. Englehardt and A. Narayanan, “Online tracking: A 1-million-site measurement and analysis,” in Proceedings of the 2016 ACM SIGSAC Conference on Computer and Communications Security, Vienna, Austria. [8] M. L´ecuyer, G. Ducoffe, F. Lan, A. Papancea, T. Petsios, R. Spahn, A. Chaintreau, and R. Geambasu, “Xray: Enhancing the web’s trans-parency with differential correlation,” in Proceedings of the 23rd USENIX Security Symposium, San Diego, CA, USA, August 20-22, 2014. [9] M. Seufert, N. Wehner, and P. Casas, “Studying the impact of HAS qoe factors on the standardized qoe model P.1203,” in IEEE International Conference on Distributed Computing Systems, ICDCS 2018, Vienna. [10] A. Sackl, P. Casas, R. Schatz, L. Janowski, and R. Irmer, “Quantifying
the impact of network bandwidth fluctuations and outages on web qoe,” in Seventh International Workshop on Quality of Multimedia Experience, QoMEX 2015, Pilos, Messinia, Greece, May 26-29, 2015, 2015, pp. 1–6. [11] S. Cook, B. Mathieu, P. Truong, and I. Hamchaoui, “QUIC: Better For What And For Whom?” in Proceedings of IEEE International Conference on Communications (ICC), May 2017.
[12] J. Ruth, I. Poese, C. Dietzel, and O. Hohlfeld, “A first look at QUIC in the wild,” in Passive and Active Measurement - 19th International Con-ference, PAM 2018, Berlin, Germany, March 26-27, 2018, Proceedings. [13] A. M. Kakhki, S. Jero, D. R. Choffnes, C. Nita-Rotaru, and A. Mislove, “Taking a long look at QUIC: an approach for rigorous evaluation of rapidly evolving transport protocols,” in Proceedings of the 2017 Internet Measurement Conference, IMC 2017.
[14] T. Zimmermann, J. Ruth, B. Wolters, and O. Hohlfeld, “How HTTP/2 pushes the web: An empirical study of HTTP/2 server push,” in IFIP Networking Conference, Networking and Workshops.
[15] E. Bocchi, L. D. Cicco, and D. Rossi, “Measuring the quality of experience of web users,” Computer Communication Review, 2016. [16] C. Kelton, J. Ryoo, A. Balasubramanian, and S. R. Das, “Improving user
perceived page load times using gaze,” in 14th USENIX Symposium on Networked Systems Design and Implementation, NSDI 2017, Boston. [17] T. Hobfeld, F. Metzger, and D. Rossi, “Speed index: Relating the
industrial standard for user perceived web performance to web qoe,” in Tenth International Conference on Quality of Multimedia Experience, 2018.
[18] M. Varvello, J. Blackburn, D. Naylor, and K. Papagiannaki, “EYEORG: A platform for crowdsourcing web quality of experience measurements,” in Proceedings of the 12th International on Conference on emerging Networking EXperiments and Technologies, CoNEXT 2016, Irvine, Cal-ifornia, USA, December 12-15, 2016, 2016, pp. 399–412.
[19] M. Varvello, K. Schomp, D. Naylor, J. Blackburn, A. Finamore, and K. Papagiannaki, “Is the web HTTP/2 yet?” in Passive and Active Measurement - 17th International Conference, PAM 2016, Greece.