A compact proton spectrometer for measurement of
the absolute DD proton spectrum from which yield and
The MIT Faculty has made this article openly available.
Please share
how this access benefits you. Your story matters.
Citation
Rosenberg, M. J. et al. “A Compact Proton Spectrometer for
Measurement of the Absolute DD Proton Spectrum from Which Yield
and ρR Are Determined in Thin-Shell Inertial-Confinement-Fusion
Implosions.” Review of Scientific Instruments 85, 10 (October 2014):
103504 © 2014 American Institute of Physics (AIP)
As Published
http://dx.doi.org/10.1063/1.4897193
Publisher
American Institute of Physics (AIP)
Version
Author's final manuscript
Citable link
http://hdl.handle.net/1721.1/111164
Terms of Use
Article is made available in accordance with the publisher's
policy and may be subject to US copyright law. Please refer to the
publisher's site for terms of use.
June, 2014
Plasma Science and Fusion Center
Massachusetts Institute of Technology
Cambridge MA 02139 USA
This work was supported by the U.S. Department of Energy, Grant No. DE-NA0001857,
NLUF, Grant No. DE-NA0002035, LLE, Grant No. 415935-G, and LLNL, Grant No.
B600100. Reproduction, translation, publication, use and disposal, in whole or in part,
by or for the United States government is permitted.
Submitted for publication to Review of Scientific Instruments.
PSFC/JA-14-12
A compact proton spectrometer for measurement of
the absolute DD proton spectrum from which yield
and ρR are determined in thin-shell
inertial-confinement-fusion implosions
Rosenberg, M. J., Zylstra, A. B., Frenje, J. A., Rinderknecht, H. G.,
Gatu Johnson, M., Waugh, C. J., Seguin, F. H., Sio, H., Sinenian,
N., Li, C. K., Petrasso, R. D., Glebov, V. Yu.*, Hohenberger, M.*,
Stoeckl, C.*, Sangster, T. C.*, Yeamans, C. B.**, LePape, S.**,
Mackinnon, A. J.**, Bionta, R. M.**, Talison, B.**, Casey, D.
T.**, Landen, O. L.**, Moran, M. J.**, Zacharias, R. A.**,
Kilkenny, J. D.***, and Nikroo, A.***
* Laboratory for Laser Energetics, University of Rochester, Rochester, NY ** Lawrence Livermore National Laboratory, Livermore, CA
A compact proton spectrometer for measurement of the absolute DD proton
spectrum from which yield and ρR are determined in thin-shell
inertial-confinement-fusion implosions
M. J. Rosenberg,a) A. B. Zylstra, J. A. Frenje, H. G. Rinderknecht, M. Gatu Johnson, C. J. Waugh, F. H.
S´eguin, H. Sio, N. Sinenian, C. K. Li, and R. D. Petrasso
Plasma Science and Fusion Center, Massachusetts Institute of Technology, Cambridge, MA 02139, USA
V. Yu. Glebov, M. Hohenberger, C. Stoeckl, and T. C. Sangster
Laboratory for Laser Energetics, University of Rochester, Rochester, NY 14623, USA
C. B. Yeamans, S. LePape, A. J. Mackinnon, R. M. Bionta, B. Talison, D. T. Casey, O. L. Landen, M. J. Moran, and R. A. Zacharias
Lawrence Livermore National Laboratory, Livermore, CA 94550, USA
J. D. Kilkenny and A. Nikroo
General Atomics, San Diego, CA 92186, USA (Dated: 5 June 2014)
A compact, step range filter (SRF) proton spectrometer has been developed for measurement of the absolute DD proton spectrum, from which yield yield and areal density (ρR) are inferred for deuterium-filled thin-shell inertial confinement fusion implosions. This spectrometer, which is based on tantalum step-range filters, is sensitive to protons in the energy range 1-9 MeV and can be used to measure proton spectra at mean energies of ∼1-3 MeV. It has been developed and implemented using a linear accelerator and applied to experiments at the OMEGA laser facility and the National Ignition Facility (NIF). Modeling of the proton slowing in the filters is necessary to construct the spectrum, and the yield and energy uncertainties are ±10% in yield and ±120 keV, respectively. This spectrometer can be used for in situ calibration of DD-neutron yield diagnostics at the NIF.
PACS numbers: 29.30.Ep, 29.40.Wk, 52.70.Nc
I. INTRODUCTION
Charged-particle spectroscopy is a powerful tool for diagosing fusion yield (Y ), areal density (ρR), and ion temperature (Ti) in inertial confinement fusion (ICF)
implosions.1–4 Several diagnostic techniques have been used, including magnet-based spectrometers1,5,6 and
ranging filters,7 with detection substrates consisting of
image plates8 or the solid-state nuclear track detector
CR-39.7
Though the existing suite of charged-particle spec-trometers is able to detect protons over a wide range of energies, from ∼0.1 to ∼30 MeV, and at a variety of incident particle fluences,9 there are limitations to their
usage that render them unavailable for certain applica-tions. In particular, the charged particle spectrometers (CPS)5,7 operated at the OMEGA laser facility10 are
positioned at fixed locations and are limited to proton yields above 108. The wedge range filter (WRF) proton
spectrometers7,11 are compact and portable, and can be
fielded simultaneously at multiple positions around im-plosions at OMEGA and the National Ignition Facility (NIF),12 but their energy range for proton detection is
limited to 4-20 MeV. The operating parameters of
exist-a)Electronic mail: mrosenbe@mit.edu
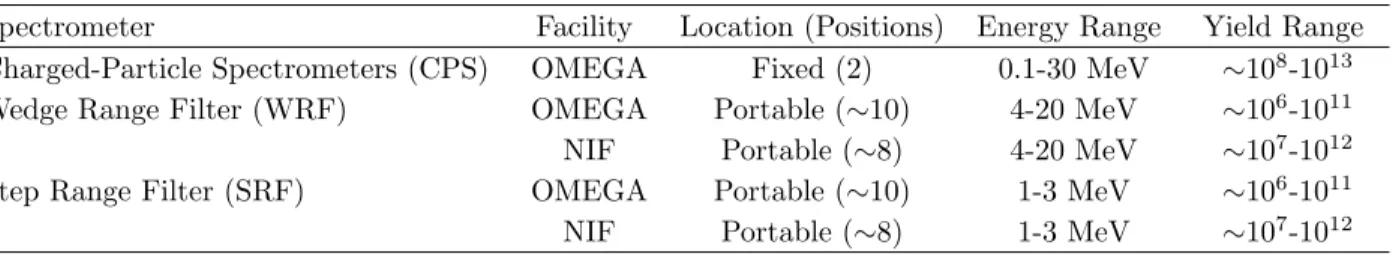
ing proton spectrometers used at OMEGA and NIF, in comparison to the step range filter (SRF) proton spec-trometer presented in this work, are summarized in Table I.
The SRF combines the ease-of-use advantages of the WRFs with the ability to measure proton spectra at en-ergies as low as 1 MeV. Using steps of thin tantalum foils in front of a piece of CR-39, protons in the range of 1-9 MeV can be detected. For low-energy (∼1-3 MeV) protons produced via the DD reaction,
D + D → T(1.01 MeV) + p(3.02 MeV), (1) the SRF can be used to measure the energy downshift of the proton spectrum, from which the total ρR is in-ferred. This detector is intended to diagnose thin-shell, deuterium-filled (D2or D3He) implosions with a ρR less
than 30 mg/cm2, at which point the protons are ranged
out. In addition to having utility in physics studies of shock-driven implosions,13 these proton detectors can be
used for an in situ calibration of DD-neutron detectors on OMEGA or NIF,14 using a technique described by Waugh et al.15
This paper is organized as follows: Section II discusses the SRF detector design and principles of spectral mea-surement; Section III presents initial data obtained using a linear accelerator16and on the OMEGA and NIF laser
Spectrometer Facility Location (Positions) Energy Range Yield Range
Charged-Particle Spectrometers (CPS) OMEGA Fixed (2) 0.1-30 MeV ∼108-1013
Wedge Range Filter (WRF) OMEGA Portable (∼10) 4-20 MeV ∼106-1011
NIF Portable (∼8) 4-20 MeV ∼107-1012
Step Range Filter (SRF) OMEGA Portable (∼10) 1-3 MeV ∼106-1011
NIF Portable (∼8) 1-3 MeV ∼107-1012
TABLE I. Operating parameters for the charged particle spectrometers (CPS),5,7 wedge range filter (WRF) proton spectrometers,7,11 and the new step range filter (SRF) proton spectrometer. CPS has a wide energy range, but is limited to two fixed positions on OMEGA. The WRFs are portable, but are limited to proton energies above 4 MeV. The SRF com-bines the portability of the WRF with a lower energy range. It should be noted that although the current SRF is limited to proton spectral measurements in the range of ∼1-3 MeV, it is capable of detecting protons up to ∼9 MeV.
Section V presents possible applications of this detector and concluding remarks.
II. DESIGN AND ANALYSIS PRINCIPLES
The SRF detector, designed to fit into a WRF spec-trometer casing, consists of a thick aluminum frame (background plate), to which are adhered steps of thin tantalum filters, followed by a piece of CR-39. Pho-tographs of a sample SRF setup and a cartoon front view of the foils, as seen from an implosion, are shown in Fig-ure 1. Two separate designs have been implemented to make spectral measurements at slightly different energy ranges: a thicker set of foils, with quadrants covered by nominally 10, 14, 19, and 23 µm of tantalum, and a thin-ner set of foils, with quadrants covered by nominally 5, 10, 15, and 20 µm of tantalum. These particular fil-ters were chosen to optimize measurement of DD pro-tons in the energy range ∼1-3 MeV. The SRF is con-ceptually similar to the wedge range filter (WRF) proton spectrometers,7,11,17which use a continuous ramp, rather
than discrete steps of different thicknesses. In each de-sign, the aluminum background plate is 3180 µm thick to fully stop protons up to 25 MeV and to provide a re-gion for characterization of intrinsic background in the CR-39.18
The proton signal measured behind the four step fil-ters is used to infer the total proton yield and to con-struct a spectrum based on modeling of the energy rang-ing through each Ta foil. Consider an example usrang-ing the thick detector package, with an incident Gaussian pro-ton spectrum at a peak energy of E0 = 2.5 MeV and
a spectral width of σ = 0.25 MeV, representative of a downshifted DD-proton spectrum. Figure 2 shows this incident spectrum (black) and the resulting spectra (red) after ranging through the different Ta filters. The SRIM stopping power tables19were used for these calculations,
as well as a zeroth order treatment of energy straggling, which further broadens the spectrum. 100% of the pro-tons pass through the 10-µm Ta foil above the ∼100 keV detection cutoff.7 99% are detected by the CR-39 be-hind the 14-µm-thick foil. The 19-µm foil permits 57%
FIG. 1. (Color online) (a) Front and (b) side view of a repre-sentative step range filter (SRF) setup. Two different configu-rations, the (c) thick and (d) thin SRF, have been developed. The thickness of the different tantanlum filters is indicated. The aluminum background plate, 3180 µm thick, covers the upper ∼1/3 of the module and provides a background region on the CR-39 behind the filter stack.
of the protons to be detected, while the 23-µm foil per-mits only 7% of the protons. The number of protons de-tected per cm2behind each filter, S
10, S14, S19, and S23,
are used to constrain the three parameters describing a Gaussian spectrum – the total yield Y , mean energy E0,
and the spectral width σ. Thus, in contrast to the WRF, which uses information about the number and diameter of proton tracks behind a filter with a continuous range of thicknesses, the SRF infers properties of the proton spectrum simply from the number of proton tracks be-hind discrete filters of different thicknesses. This analy-sis principle using four filters applies for any 3-parameter
3 model spectrum, though for simplicity, the
interpreta-tion and discussion of the SRF results herein assume a Gaussian spectrum. For DD-protons around ∼1-3 MeV, affected by a small energy downshift, the assumption of a Gaussian spectrum is usually valid.
FIG. 2. (Color online) Simulated proton spectra behind 10 µm, 14 µm, 19 µm, and 23 µm Ta filters (red curves). The black curve represents the incident proton spectrum, with an average energy of 2.5 MeV and a Gaussian σ of 0.25 MeV. The CR-39 detection cutoff energy is 0.1 MeV.
III. RESULTS
The SRF proton spectrometer has been tested on the Linear Electrostatic Ion Accelerator (LEIA)16 and used
to diagnose thin-shell D2 and D3He-filled implosions at
OMEGA and the NIF.
A. Demonstration of the SRF Principle Using LEIA
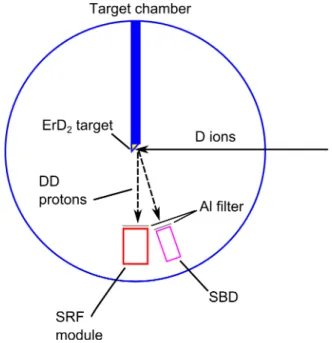
Initial testing of the SRF was conducted on LEIA, as depicted schematically in Figure 3.16 LEIA generates
a beam of deuterons at energies up to 150 keV, which impinges on an ErD2 target. The resulting DD fusion
reactions (Equation 1) produce a spectrum of protons around 3.0 MeV, which are detected by the SRF and by a surface barrier detector (SBD) that records the energy and number of individual particles. Having an indepen-dent measurement of the DD-p energy20and yield allows for careful verification and uncertainty assessment of the SRF measurements.
Experiments on LEIA demonstrate the sensitivity of the SRF to proton spectra of different average energies. Figure 4 shows the resulting signal based on the proton fluence transmitted through each filter for a variety of incident proton spectra, ranging from E0 = 3.04 MeV
to E0= 1.80 MeV. The lower proton energies, measured
by the SBD, are achieved by placing an additional filter in front of the SRF to range down DD protons that are born at 3.04 MeV.
FIG. 3. (Color online) Diagram of experimental setup on the Linear Electrostatic Ion Accelerator (LEIA). A deuteron beam incident on a ErD2target generates DD protons, which are detected by both a surface barrier detector (SBD) and the SRF. Aluminum filters are used sometimes to range down DD protons to lower energies, as discussed in the text.
At E0 = 3.04 MeV (no additional filtering), nearly all
protons pass through each filter and are detected on the CR-39. Only 5% fewer protons are detected behind the 19-µm and 23-µm filters than behind the 10-µm and 14-µm filters, though this measured loss of protons is only slightly outside of measurement uncertainty. Protons at the low-energy tail of the spectrum are ranged out in the thicker filters.
At E0= 2.13 MeV (∼40 additional µm Al filtering), all
protons are ranged out by the 23-µm filter, while 98% of protons are ranged out in the 19-µm filter. The 14-µm fil-ter permits 98% of the protons, within measurement un-certainty of 100%, while the 10-µm filter transmits 100% of the protons.
At E0= 1.92 MeV (∼45 µm additional Al filtering), no
protons are detected behind the 23-µm or 19-µm filters, 88% of protons are detected behind the 14-µm filter, and 100% of the protons are detected behind the 10-µm filter. The data using 1.80-MeV protons (∼50 additional µm Al filtering) further illustrates the effects of ranging, as only 71% of protons are detected behind the 14-µm filter and 100% of the protons are detected behind the 10-µm filter. For these fairly narrow spectra, σ∼0.10-0.13 MeV as measured by the SBD, the ranging out of part of the proton spectrum is observed behind only a single filter at a time. As at most one filter transmits a non-zero, non-unity fraction of the protons, the relative signal be-hind each filter is a sensitive measurement of the average energy of the proton spectrum.
analy-sis technique (inferring the incident proton spectra based on the measured signal ratios) to compare to the known, SBD-measured spectral parameters. By contrasting the SBD spectral measurements to the SRF data, it is possi-ble to estimate the uncertainties in the SRF-determined incident proton energy. A summary of the SRF-inferred spectral quantities and measured proton signals, and ac-tual, SBD-measured spectral quantities, is presented in Table II. Given an incident proton mean energy and spectral width, a model of proton ranging19through each
of the SRF filters produces modeled proton spectra and modeled proton signal behind each filter. The model used to analyze the LEIA data includes spectral dispersion and a zeroth order treatment of energy straggling.
The SRF data taken on LEIA show that the analysis captures the incident proton energy as measured by the SBD to within 150 keV, and to within 50 keV at energies of 2-3 MeV. It is shown in Section IV that this ∼100 keV error in the SRF energy measurement is roughly consistent with the energy uncertainty determined from uncertainty inherent in the modeling. Some of the un-certainty in the SRF-inferred energy based on the signal ratios stems from the degeneracy between E0and σ when
matching one signal ratio. For example, in the 1.92 MeV experiment, it is only necessary to match one relative signal ratio (S14/S10) with two incident spectral
param-eters (E0 and σ). The ranging model is able to produce
S14/S10 = 0.88 for several combinations of (E0,σ)
cen-tered around (2.04, 0.12) MeV, within ±0.04 MeV for both E0 and σ. This degeneracy issue is illustrated in
Figure 5. It is a particular concern for inferring narrow spectra, as discussed further in Section IV.
Additionally, it is inferred from the spectral modeling that in these experiments, all protons are detected behind the 10-µm Ta filter, which means that the yield of the incident protons is simply that inferred behind the 10-µm Ta filter. Even though only one ratio is used and there is some degeneracy between E0and σ, the range of possible
solutions is constrained by the fact that none of them allow for any fraction of the spectrum to be ranged out in the 10-µm Ta filter. For broader spectra, often observed at OMEGA and, especially, in NIF implosions, there can be multiple filters that allow through a zero, non-unity fraction of protons. Under these conditions, the inferred proton energy and linewidth are simultaneously constrained by multiple signal ratios. For a sufficiently low incident proton mean energy or sufficiently broad incident spectrum, a fraction of the proton spectrum may be ranged out even in the thinnest (e.g. 10-µm) Ta filter and modeling is necessary to infer the incident proton yield.
B. Use on OMEGA and NIF Implosions
The SRF was also used to diagnose thin-glass-shell ICF implosions at OMEGA and the NIF. Three exper-iments at OMEGA used ∼850-µm diameter,
∼2.3-µm-FIG. 4. SRF-measured DD-proton signal in LEIA experi-ments at incident mean proton energies of (a) 3.04 MeV, (b) 2.13 MeV, (c) 1.92 MeV, (d) 1.80 MeV, as determined by the SBD. Darker signifies a greater proton fluence. As the pro-ton energy decreases, the relative signal between each window changes: S14/S10decreases as a larger fraction of the protons is ranged out in the 14-µm Ta filter. The relative signal ratios are presented in Table II.
FIG. 5. (Color online) Simulated proton spectra incident on the SRF (black) and transmitted through the 14 µm Ta filter (red). For both a higher-energy, broader spectrum (dashed, E0= 2.08 MeV, σ = 0.16 MeV) and a lower-energy, narrower spectrum (dotted, E0= 2.01 MeV, σ = 0.09 MeV), 88% of the protons are transmitted through the 14 µm Ta filter. Thus, there is a degeneracy in inferring both E0 and σ from one relative signal ratio (S14/S10).
5
SRF Measured Proton Signal Ratios SRF E0 SRF σ SBD E0 SBD σ
S14/S10 S19/S10 S23/S10 (MeV) (MeV) (MeV) (MeV)
0.99 0.95 0.94 3.10±0.05 0.10±0.03 3.04 0.10
0.98 0.02 0 2.13±0.03 0.11±0.02 2.13 0.11
0.88 0 0 2.04±0.04 0.12±0.03 1.92 0.12
0.71 0 0 1.97±0.03 0.13±0.05 1.80 0.13
TABLE II. Measured SRF ratios of proton signal behind each of the four filters and the SRF-inferred average energy and spectral width based on modeling of spectral ranging through the different filters in LEIA experiments. The SBD-measured average energy and spectral width are shown for comparison. The difference between the SBD and SRF energy measurement helps identify uncertainties in the SRF analysis. Uncertainty in the SRF-inferred E0 and σ represents degeneracy between those two quantities, as the two fitting parameters need to match only one proton signal ratio (the others being either 0 or ∼1 and, therefore, not highly sensitive to the incident proton energy). The overall difference between the SBD-measured E0 and the SRF-inferred E0characterizes uncertainty in the SRF measurement, which is ∼100 keV. The uncertainty estimates are discussed in more detail in Section IV.
thick SiO2shells filled with ∼15 atm D3He gas, imploded
by 13.8-15.8 kJ laser energy in a ∼0.6 ns laser pulse. These implosions generated 2-3×10¹⁰ DD protons with
an average energy of 3.1 MeV, which were detected by the “thin” SRF configuration at a distance of 175 cm from the implosion. At this position, the fluence was 5-8×10⁴ protons per cm2 at the SRF spectrometer. On
these implosions, and in general, 14.7-MeV D3He
pro-tons were not detected by the SRF, as they pass through the CR-39 at an energy above the upper limit for proton detection.
FIG. 6. DD-proton signal measured using the “thin” SRF (5, 10, 15, 20-µm Ta filters) on three D3He-filled thin-glass-shell implosions on OMEGA (shots 70400, 70561, 70562). Dark signifies a greater proton fluence. In each experiment, the pro-ton spectrum exiting the implosion has a mean energy ∼3.1 MeV, energetic enough that the entire spectrum is transmit-ted through each filter. The 5-µm Ta filter also transmits D3He-α particles, which on shot 70400 produced significant track overlap21and loss of ∼20% of the proton signal.
DD-proton signal images obtained on three implosions on OMEGA, shots 70400, 70561, and 70562, are shown in Figure 6. All three images show a near-uniform pro-ton signal behind the four different filters, which were made of 5 µm, 10 µm, 15 µm, and 20 µm thick Ta. On shot 70400, the signal behind the 5-µm Ta filter shows a reduced proton signal as a result of track overlap,21
between D3He-α and the DD protons. On the two sub-sequent shots, 70561 and 70562, the data were processed in such a fashion that track overlap behind the 5-µm Ta
filter was insignificant. The fact that a nearly identical fluence was observed behind each filter suggests that no significant part of the proton spectrum was ranged out in any of the filters. The incident proton mean energy and spectral width can therefore be constrained to those solu-tions that permit 100% of protons through the 20-µm Ta filter. Furthermore, the determination of the proton yield is straightforward, and can be computed entirely based on the measured proton signal behind any of the filters. For example, on shot 70400, the proton fluence behind the 10-µm Ta filter fluence was S10 = 6.63×10⁴/cm2.
With the detector at a distance of 175 cm from the implo-sion, the proton yield inferred behind the 10-µm Ta filter is therefore Y10 = S10[4π(175)2] = 2.55 × 10¹⁰, which is
in reasonable agreement with a separate DD-proton yield measurement of 2.71×10¹⁰(see Table III).
The inferred proton yields, mean proton energy, and linewidth are summarized in Table III. The results are compared to measurements obtained on the same shots using the charged-particle spectrometers (CPS).5,7 The
CPS measurements are averages from two different spec-trometers, CPS1 and CPS2, and as shown in Table III, the SRF-determined mean energy and linewidth agree with the CPS measurements. Differences in observed yield between different lines of sight may be due to elec-tric and/or magnetic fields around the implosion that produce spatial anisotropies in charged fusion product fluence.22 The CPS-measured DD-proton spectrum on shot O70561 was used as the incident spectrum on the SRF, and the spectrum behind each filter is shown in Figure 7. For the incident mean proton energy of E0 =
3.10 MeV and spectral width σ = 0.13 MeV, none of the protons are ranged out by any of the filters, as concluded from the SRF data.
The “thick” SRF configuration was used to mea-sure the DD-proton spectrum from a D2-filled,
thin-glass-shell implosion at the NIF. The experiment (shot N130129) used a 4.6-µm-thick, 1533-µm diameter SiO2
capsule filled with 10 atm D2 gas, which was driven
by 51 kJ laser energy in a ∼1.4 ns pulse in the polar-direct-drive23,24 configuration. A DD(-neutron) yield of
OMEGA SRF Measured Proton Yields SRF E0 SRF σ CPS Yield CPS E0 CPS σ
Shot Y5 Y10 Y15 Y20 (MeV) (MeV) (MeV) (MeV)
70400 2.05×10¹⁰ 2.55×10¹⁰ 2.45×10¹⁰ 2.52×10¹⁰ >2.84 <0.15 2.71×10¹⁰ 3.18 0.14
70561 2.74×10¹⁰ 3.01×10¹⁰ 2.61×10¹⁰ 2.89×10¹⁰ >2.84 <0.15 3.06×10¹⁰ 3.10 0.13
70562 1.91×10¹⁰ 1.82×10¹⁰ 1.77×10¹⁰ 1.84×10¹⁰ >2.84 <0.15 2.73×10¹⁰ 3.14 0.13
TABLE III. SRF- and CPS-measured DD-proton yield, mean energy, and spectral width for three D3He thin-glass-shell implo-sions at OMEGA. The SRF-inferred E0 and σ are bounds, based on a combination of energy and spectral width at which at least 95% of the proton spectrum is transmitted through the 20-µm Ta filter. Though the energy lower bound is fairly rigid, if the proton spectrum had a significantly higher energy, it could also permit a wider upper-limit on the spectral width.
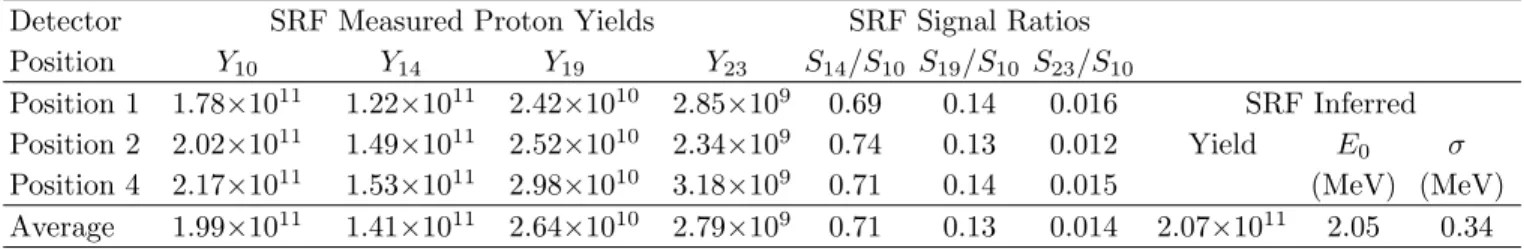
Detector SRF Measured Proton Yields SRF Signal Ratios
Position Y10 Y14 Y19 Y23 S14/S10 S19/S10 S23/S10
Position 1 1.78×10¹¹ 1.22×10¹¹ 2.42×10¹⁰ 2.85×10⁹ 0.69 0.14 0.016 SRF Inferred
Position 2 2.02×10¹¹ 1.49×10¹¹ 2.52×10¹⁰ 2.34×10⁹ 0.74 0.13 0.012 Yield E
0 σ
Position 4 2.17×10¹¹ 1.53×10¹¹ 2.98×10¹⁰ 3.18×10⁹ 0.71 0.14 0.015 (MeV) (MeV)
Average 1.99×10¹¹ 1.41×10¹¹ 2.64×10¹⁰ 2.79×10⁹ 0.71 0.13 0.014 2.07×10¹¹ 2.05 0.34
TABLE IV. SRF-measured proton yields through each of the 10-µm, 14-µm, 19-µm, and 23-µm Ta filters, and ratios of proton signal behind each of the four windows, on NIF shot N130129. The average values are used to infer the incident DD-proton yield, mean energy, and spectral width (see Figure 9).
FIG. 7. (Color online) CPS-measured DD-proton spectrum from OMEGA shot 70561, transmitted through each of the four filters of the “thin” SRF. The incident spectrum has a mean proton energy of E0= 3.10 MeV, with a spectral width of σ = 0.13 MeV. The resulting proton spectra (red) ranged through the 5 µm, 10 µm, 15 µm, and 20 µm Ta (thick SRF fil-ters) are shown. 100% of the protons are transmitted through every filter, as demonstrated in the SRF measurement.
2.5×10¹¹was measured by neutron time-of-flight (nTOF) detectors25,26and indium activation.14As this implosion
had a total areal density of ∼18 mg/cm2, as inferred from
the downshift of secondary proton spectra measured by WRF spectrometers,3,7 the DD protons escaped the im-plosion and were detected by the SRF.
Three “thick” SRFs were fielded in close proximity to each other at a distance of 375 cm from the implosion; the proton fluence images are shown in Figure 8 and the raw proton yield measurements behind each filter and signal
FIG. 8. DD-proton signal obtained at three different detector positions using the “thick” SRF (10, 14, 19, 23-µm Ta filters) on NIF direct-drive D2-filled thin-glass shell shot N130129. Dark signifies a greater proton fluence. A similar absolute fluence level and ratio of proton signals is observed at each detector. The gradation in fluence across the different win-dows, with a finite fraction of the proton spectrum permit-ted behind multiple windows, indicates a fairly broad proton spectrum.
ratios are summarized in Table IV. Each SRF shows a gradually decreasing fluence of protons with increasing filter thickness. On average, the ratio of proton signal behind the 14-µm filter to that behind the 10-µm filter is S14/S10 = 0.71, while S19/S10 = 0.13 and S23/S10 =
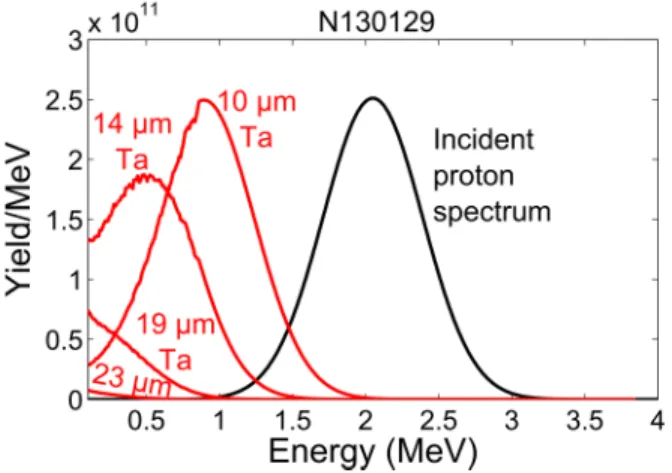
0.014. This reduction in fluence across the different fil-ters, in contrast to sharp cutoffs in fluence demonstrated in tests at the LEIA accelerator, indicates a fairly broad DD-proton spectrum. Analysis of this data and the de-termination of the total proton yield, incident mean en-ergy, and spectral width are summarized at the bottom of Table IV, with the resulting spectra shown in Figure 9.
7 energy, and spectral width) are fit by four measured
quantities, the inferred spectrum is constrained. Based on the relative signal ratios of S14/S10 = 0.71, S19/S10
= 0.13 and S23/S10 = 0.014, a mean incident proton
energy of E0 = 2.05 MeV and a spectral width of σ =
0.34 MeV are inferred. The resulting simulated signal ratios of S14/S10 = 0.71, S19/S10 = 0.13 and S23/S10 =
0.008 are in good agreement with the measured values, to within uncertainties in proton signal measurement and spectral modeling. The mean proton energy in particu-lar is well-constrained, as deviations in energy up to only 0.04 MeV are permitted before an additional deviation of 10% in the relative proton signal is produced, larger than the measured yield uncertainty. Based on the proton en-ergy downshift in the implosion, to 2.05 MeV, from the birth DD-proton energy of 3.02 MeV, a total ρR of 13±3 mg/cm2 is inferred, in agreement with the measured to-tal ρR from the downshift of secondary D3He protons,
18±5 mg/cm2. Thus, the SRF proton spectrometer can
be used as a ρR diagnostic on implosions with deuterium fuel and sufficiently low ρR (<30 mg/cm2).
FIG. 9. (Color online) SRF-inferred DD-proton spectrum from NIF shot N130129, transmitted through each of the four filters of the “thick” SRF. The incident spectrum has a mean proton energy of E0= 2.05 MeV, with a spectral width of σ = 0.34 MeV. The resulting proton spectra (red) ranged through each of 10 µm, 14 µm, 19 µm, and 23 µm Ta (thick SRF filters), above the CR-39 detection cutoff energy of 0.1 MeV, are shown. A decreasing fraction of the proton spectrum is transmitted through the increasingly thick filters.
IV. DISCUSSION OF APPLICABILITY AND UNCERTAINTIES
Experiments at the accelerator-based DD-p source (LEIA) and at OMEGA and the NIF demonstrate the utility of the SRF for determination of the DD proton spectrum in the energy range of ∼1-3 MeV. These data also help identify uncertainties in the inference of proton yield, the mean proton energy, and the Gaussian spectral width.
A. Yield Uncertainty
The uncertainty in the SRF-measured proton yield is largely dictated by the degree to which spectral modeling is required to infer the incident proton yield. For incident spectra where the thinnest filter comfortably transmits the entire spectrum, the yield uncertainty is limited by counting statistics in the CR-39 (typically ∼±1% for pro-tons at a fluence of 104/cm2over the ∼cm2area covered
by each window) and by uncertainties inherent in anal-ysis of proton tracks in CR-39, typically ∼3-5%.27 This
condition – conservatively, greater than 99.9% of the pro-ton spectrum transmitted through the 10-µm Ta filter for the “thick” SRF – is satisfied when, for example, E0>1.81
MeV for σ<0.12 MeV or when E0>2.35 MeV for σ<0.34
MeV (spectral widths chosen to span those observed on LEIA, OMEGA, and NIF). These conditions are illus-trated in part in Figure 10, which shows the simulated proton transmission (or signal) through the different fil-ters of the “thick” SRF. For the “thin” SRF, >99.9% of the proton spectrum is transmitted through the 5-µm fil-ter when, e.g., E0>1.23 MeV for σ<0.12 MeV or when
E0>1.90 MeV for σ<0.34 MeV. These energy ranges for
100% proton transmission through the thinnest filters are consistent with the analysis of SRF data from the LEIA and OMEGA experiments.
The N130129 data is an example of a spectrum where modeling is required to infer the incident proton yield, as a fraction of the spectrum was ranged out even in the thinnest (10-µm Ta) filter. In that case, uncertainty in the modeling itself contributes to the overall yield un-certainty. The objective of the modeling is to determine what fraction of the proton spectrum is detected and, thus, to correct for the fraction of protons that is ranged out. With a perfect understanding of the ranging pro-cess through the filters, this uncertainty would be negli-gible. However, uncertainty in the filter thickness28
con-tributes to the uncertainty in the modeled ratio of yield through the 10-µm filter to the actual yield (Y10/Yactual).
The actual yield is inferred based on the measured Y10
and the modeling-inferred Yactual/Y10ratio, which is
con-strained by the measured signal ratios S14/S10, S19/S10,
and S23/S10. In the case of N130129, adding 1 µm to
the thickness of the 10-µm filter only slightly changes the relative signal ratios (S14/S10 from 0.71 to 0.74, versus
measured 0.71; S19/S10 from 0.13 to 0.13, versus
mea-sured 0.13; S23/S10 from 0.008 to 0.008, versus
mea-sured 0.014), while Y10/Yactual decreases from 0.97 to
0.93. Similarly, removing 1 µm from the thickness of the 10-µm filter only slightly changes the relative sig-nal ratios (S14/S10 from 0.71 to 0.70, versus measured
0.71; S19/S10 from 0.13 to 0.13, versus measured 0.13;
S23/S10 from 0.008 to 0.008, versus measured 0.014),
while Y10/Yactual increases from 0.97 to 0.99.
There-fore, this change to the modeling based on the bounds of measurement uncertainty of the filter thickness causes a barely-perceptible shift in the modeled signal ratios, but produces a ±4% change in the inferred yield. The
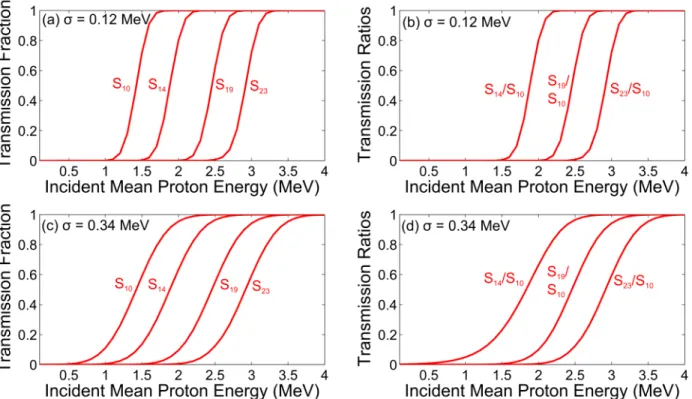
uncer-FIG. 10. (Color online) (a),(c) Fraction of protons transmitted through thick SRF filters (10 µm, 14 µm, 19 µm, and 23 µm Ta) and (b),(d) ratio of protons transmitted through the filters as a function of incident mean proton energy, for σ = 0.12 MeV (top) and σ = 0.34 MeV (bottom). A decreasing fraction of the proton spectrum is transmitted through the increasingly thick filters.
tainty in the inferred yield resulting from uncertainties in the modeling must be addressed on a case-by-case basis, but should be no greater than of order ±5-10%. This uncertainty is added in quadrature to the uncertainties in proton track counting as discussed above.
B. Energy Uncertainty
The ability to infer a mean proton energy likewise de-pends on the proton energy relative to the proton range in the different filters. When all protons are transmit-ted through the different filters (and the relative signal ratios are all 1), only a lower limit on the mean proton energy can be established, as was the case in the OMEGA data. A conservative upper limit on the energy range at which the mean energy can be determined is set by the energy at which a detectable loss of transmission can be observed through the thickest filter in the SRF, either 23 µm Ta for the current “thick” version or 20 µm Ta for the “thin” version. For purposes of this study, a detectable loss of transmission is considered to be below 97% of the protons transmitted (allowing for 3% uncertainty in the measured signal behind each filter). For the thick SRF, 97% transmission through 23 µm Ta is achieved when, e.g., E0 = 3.18 MeV for σ<0.12 MeV (Figure 10a) or
when E0= 3.57 MeV for σ<0.34 MeV (Figure 10c). The
LEIA data shown in Figure 4a, at a mean energy of E0=
3.04 MeV, is an example that is coming close to the limit below which a mean energy can be precisely inferred. For energies above these values, it is impossible to determine the exact mean energy. For the thin SRF, 97% trans-mission through 20 µm Ta is achieved when, e.g., E0 =
2.82 MeV for σ<0.12 MeV or when E0 = 3.23 MeV for
σ<0.34 MeV. The OMEGA data shown in Figure 6 are all above this energy limit and, thus, the most informa-tion that can be inferred is that the mean energy is >2.84 MeV (for σ<∼0.15 MeV). The use of thicker filters can ex-tend the range of energies at which an accurate energy measurement can be made (beyond simply establishing a lower limit). For those spectra where only one filter transmits less than 100% of the proton spectrum, there is a degeneracy in inferring two spectral quantities (mean energy and spectral width) from only one relative signal ratio. Under these conditions, the inferred mean energy can be constrained by reasonable bounds on the spectral width (if known) or by the energy at which the second thickest filter begins to range out a detectable fraction of the spectrum.
The mean proton energy measurement is well-constrained when one or more filters transmits a frac-tion of the proton spectrum. As shown in Figure 10a,c, this condition is satisfied when the incident mean en-ergy is ∼1-3 MeV. This is evident in the LEIA data shown in Figure 4b-d, where incident proton energy dif-ferences of 100-200 keV cause difdif-ferences in the relative
9 signal ratios (S14/S10in particular) of 10-20%,
consider-ably larger than the uncertainty in proton track count-ing on the CR-39. This sensitivity is also illustrated by the slopes of the relative transmission (or signal) ratio curves in Figure 10b,d. Thus, the random uncertainty in the analysis (inferring E0 based on the relative
sig-nal ratio) based on the ±3-5% random uncertainty in the proton signal measurement is ∼±50 keV. Allowing for up to a ±1 µm filter thickness uncertainty, the corre-sponding random uncertainty in the E0inferred from the
modeling is ∼±110 keV. The total energy uncertainty is around ±120 keV,29 of order the difference between the SBD-measured and SRF-inferred energy values as shown in Table II. This energy uncertainty is equivalent to an uncertainty of ∼±4 mg/cm2 in a total ρR measurement
based on the energy downshift of the DD-proton spec-trum.
C. Linewidth Uncertainty
To simultaneously constrain both the mean proton en-ergy and spectral width, it is necessary to have multi-ple windows where a measurable fraction of the incident proton spectrum has been ranged out. When the proton energy is too high and only the thickest filter transmits a fraction of the proton spectrum, there is a degeneracy between the mean energy and spectral width, as alluded to above. Under those circumstances, the relative signal ratio is much more sensitive to the mean energy than to the spectral width, resulting in a well-constrained mean energy, while the spectral width is poorly constrained. Thus, a spectral width measurement is only possible for the “thick” SRF when E0<2.71 MeV (based on <97%
of protons transmitted through the 19-µm Ta filter for σ = 0.12 MeV, see Figure 10a) or for the “thin” SRF when E0<2.24 MeV (based on <97% of protons
trans-mitted through the 15-µm Ta filter for σ = 0.12 MeV). The spectral width is most accurately inferred when the spectrum is broad enough (typically for σ>0.12 MeV) that there is significant overlap in energy space between the spectra ranged through different filters. This can also be understood as there being more than one window with a non-zero, non-unity fraction of the spectrum. If only one window at a time (and not the thickest filter) shows a non-zero, non-unity signal relative to the other windows, the spectral width can be constrained to σ<∼0.12 MeV for the present designs with ∼4-5-µm Ta filtering differences between windows. This narrow-spectrum condition was present in the LEIA data presented in Section III A. A different SRF design with more filters and less incremen-tal filtering between windows could potentially be used to measure the linewidth of narrower spectra. A summary of the proton mean energy and spectral width bounds for SRF measurements of the proton yield, mean energy, and spectral width, for different values of the mean en-ergy and spectral width, is presented in Table V.
When the proton spectrum is broad enough and
suf-ficiently low in energy that signal behind multiple fil-ters is a fraction of the number of incident protons (for example, in the N130129 data), the uncertainty in the inferred spectral width is based on the uncertainty in the relative signal ratios used to infer σ. As an illustra-tive example, the data from N130129 (S14/S10 = 0.71,
S19/S10 = 0.13, S23/S10 = 0.014) is analyzed to infer
E0 = 2.05 MeV and σ = 0.34 MeV, with modeled
sig-nal ratios of S14/S10 = 0.71, S19/S10= 0.13, S23/S10 =
0.008 (Section III B). If the modeled σ were changed to 0.37 MeV, the modeled signal ratios become S14/S10 =
0.70, S19/S10= 0.15, S23/S10= 0.014. Conversely, for σ
= 0.31 MeV, the modeled signal ratios become S14/S10
= 0.72, S19/S10 = 0.11, S23/S10 = 0.005. Thus, a 0.03
MeV difference on top of σ = 0.34 MeV corresponds to a ∼15% departure for S19/S10 and a ∼50% difference in
S23/S10. These differences are well outside of the
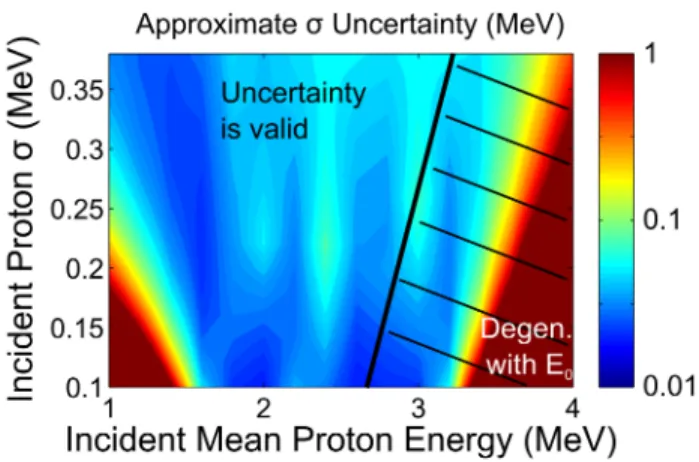
uncer-tainty of the raw proton signal measurement. Therefore, a reasonable, conservative estimate of the uncertainty in the spectral width under such conditions is ∼±50 keV. The approximate uncertainty in σ based on this kind of analysis is shown in Figure 11. The uncertainty in σ is inferred as the variation in the modeled σ that pro-duces a ±0.03 change in any of the modeled signal ratios (S14/S10, S19/S10, and S23/S10). This analysis
repre-sents the maximum difference in σ that produces a non-observable (within measured signal uncertainties) change in the signal ratios. Typical uncertainty in σ over the en-ergy range of interest is ∼±20-60 keV. Uncertainty in the filter thickness primarily translates to an uncertainty in the mean energy and does not substantially contribute to uncertainty in the inferred spectral width.
FIG. 11. (Color online) Approximate uncertainty in the in-ferred σ using the thick SRF as a function of incident proton mean energy and σ. This uncertainty calculation is based on the variation in the modeled σ that produces a maximum variation of ±0.03 in any of the modeled proton signal ratios (S14/S10, S19/S10, and S23/S10). To the right of the thick black line, there is a degeneracy between the inferred E0 and σ, so that the linewidth cannot be uniquely inferred.
Observable E0 range (σ limit) Comments on analysis
Yield 1.81<E0<9 MeV (σ<0.12 MeV) No modeling required
Yield 1<E0<1.81 MeV (σ>0.12 MeV) Inferred from modeling
Yield 2.35<E0<9 MeV (σ<0.34 MeV) No modeling required
Yield 1<E0<2.35 MeV (σ>0.34 MeV) Inferred from modeling
Mean Energy (E0) 2.71<E0<3.18 MeV (σ<0.12 MeV) Measurement possible, but E0/σ degeneracy
Mean Energy (E0) 1<E0<2.71 MeV (σ>0.12 MeV) Measurement well constrained
Mean Energy (E0) 3.10<E0<3.57 MeV (σ<0.34 MeV) Measurement possible, but E0/σ degeneracy
Mean Energy (E0) 1<E0<3.10 MeV (σ>0.34 MeV) Measurement well constrained
Spectral Width (σ) 1<E0<2.71 MeV (σ>0.12 MeV) Measurement well constrained
Spectral Width (σ) 1<E0<3.10 MeV (σ>0.34 MeV) Measurement well constrained
TABLE V. Summary of proton mean energy and spectral width bounds for SRF measurement of the proton yield, mean energy E0, and spectral width σ. These are based on the “thick” SRF, with filters consisting of 10 µm, 14 µm, 19 µm, and 23 µm Ta. The energy ranges for the “thin” SRF are slightly lower, as discussed in the text.
D. Comments on Energy Range
It has been established that the SRF operates effec-tively as a spectrometer for proton spectra in the range ∼1-3 MeV. This energy range is limited on the low end by the presence of “ablator” protons, which are accelerated to energies up to ∼1 MeV by electric fields in the corona of ICF implosions for a variety of shell materials.30,31
The yield of these ablator protons is much higher than the fusion-generated proton yields, and thus ablator ions overwhelm the DD-proton signal if not properly filtered. Based on the OMEGA (NIF) data using the thin (thick) SRF, it is determined that for the laser drive conditions in those experiments, with an intensity of ∼1015(∼5×10¹⁴)
W/cm2, the ablator protons were at low enough energies
to be ranged out in the 5-µm (10-µm) Ta filter and, there-fore, did not impact the detection of DD protons. If the SRF filtering were made thinner in an attempt to detect lower-energy protons, the ablator protons may be able to pass through the filters and wash out the fusion proton signal.
The energy upper-limit for SRF operation is dictated primarily by the thickest filtering. As CR-39 can de-tect protons at 100% efficiency up to ∼8 MeV, the upper energy limit for simply detecting protons is the maxi-mum incident energy of a proton such that, when ranged through the thickest SRF filter, it emerges on the CR-39 at an energy no greater than ∼8 MeV. For the current SRF configurations, with thickest filters of 20 µm and 23 µm Ta, that energy upper limit for detecting protons and measuring a proton yield is ∼9 MeV. As discussed above, this energy limit is not the same as that for spectroscopy, which relies on a differential in proton signal between dif-ferent windows; for the current configurations, the upper limit for measuring the mean proton energy is ∼3 MeV. In principle, both of these energy upper-limits can be increased by the use of additional or thicker filters.
V. CONCLUSIONS AND APPLICATIONS
A compact step range filter (SRF) proton spectrome-ter has been designed and implemented at OMEGA and the NIF for a yield, mean energy, and spectral width determination for the DD-proton spectrum in the en-ergy range ∼1-3 MeV. Unlike other low-enen-ergy proton spectrometers used on ICF facilities, the SRF is highly portable and can be fielded at multiple positions around the implosion inside the target chamber. This instru-ment is a lower-energy analogue of the well-established WRF proton spectrometer, which operates in the energy range of 4-20 MeV. The SRF has been tested on LEIA and in implosions at OMEGA and the NIF. These exper-iments have demonstrated the sensitivity of the detector response to the mean proton energy and width of the incident spectrum. For a proton spectrum with a mean energy E0<3 MeV, a typical uncertainty in the mean
en-ergy is ∼±0.12 MeV. For a sufficiently broad spectrum (σ>0.12 MeV) at a mean energy <2.7 MeV, the spectral width can be estimated with an uncertainty of ∼±50 keV. The SRF was designed for diagnosis of thin-glass-shell ICF implosions (<30 mg/cm2) with deuterium in the fuel
(either D2or D3He gas), which produce DD protons at a
birth energy of ∼3.02 MeV. Measurements of the DD fu-sion yield and spectral width provide information about the ion temperature in the implosion, while the energy downshift is proportional to the areal density (up to a ρR of ∼30 mg/cm2, at which point the DD protons are
ranged out). This technique can be extended to higher energy ranges through the use of thicker filtering. The SRF could be of great value at the NIF for an in situ calibration of DD-neutron detectors.14,15,26 With an
ap-propriate change in filtering, the SRF can also be applied to the detection of D3He- or DT-α particles in the energy
range of 1-4 MeV. On D3He-filled implosions, a second
piece of CR-39 placed behind the first and filtered ap-propriately can be used to simultaneously detect D3He protons. The SRF can also be adapted for measurement
11 of the 3He3He-proton spectrum in fundamental nuclear
science experiments.
ACKNOWLEDGMENTS
The authors thank the OMEGA operations and target fabrication crews for their assistance in carrying out these experiments and J. Schaeffer, R. Frankel, E. Doeg, M. Valadez, M. Cairel, and M. McKernan for their help in processing of CR-39 data used in this work. This work was performed in partial fulfillment of the first author’s PhD thesis and supported in part by US DoE (Grant No. DE-NA0001857), NLUF (No. DE-NA0002035), LLE (No. 415935-G), LLNL(No. B600100), and LANL (No. 68238-001-09).
1Y. Kitagawa, K. Tanaka, M. Nakai, T. Yamanaka, K. Nishihara, H. Azechi, N. Miyanaga, T. Norimatsu, T. Kanabe, C. Chen, et al., Physical review letters 75, 3130 (1995).
2C. K. Li, D. G. Hicks, F. H. S´eguin, J. A. Frenje, R. D. Petrasso, J. M. Soures, P. B. Radha, V. Y. Glebov, C. Stoeckl, D. R. Hard-ing, J. P. Knauer, R. Kremens, F. J. Marshall, D. D. Meyerhofer, S. Skupsky, S. Roberts, C. Sorce, T. C. Sangster, T. W. Phillips, M. D. Cable, and R. J. Leeper, Phys. Plasmas 7, 2578 (2000). 3F. H. S´eguin, C. K. Li, J. A. Frenje, D. G. Hicks, K. M. Green,
S. Kurebayashi, R. D. Petrasso, J. M. Soures, D. D. Meyerhofer, V. Y. Glebov, P. B. Radha, C. Stoeckl, S. Roberts, C. Sorce, T. C. Sangster, T. W. Phillips, M. D. Cable, K. Fletcher, and S. Padalino, Phys. Plasmas 9, 2525 (2002).
4R. D. Petrasso, J. A. Frenje, C. Li, F. H. S´eguin, J. A. Frenje, J. R. Rygg, B. E. Schwartz, S. Kurebayashi, P. B. Radha, C. Stoeckl, J. M. Soures, J. Delettrez, V. Y. Glebov, D. D. Mey-erhofer, and T. C. Sangster, Phys. Rev. Lett. 90, 095002 (2003). 5D. G. Hicks, Charged-Particle Spectroscopy: A New Window on Inertial Confinement Fusion, Ph.D. thesis, Massachusetts Insti-tute of Technology (1999).
6J. Cobble, K. Flippo, D. Offermann, F. Lopez, J. Oertel, D. Mas-trosimone, S. Letzring, and N. Sinenian, Review of Scientific Instruments 82, 113504 (2011).
7F. H. S´eguin, J. A. Frenje, C. K. Li, D. G. Hicks, S. Kure-bayashi, J. R. Rygg, B. E. Schwartz, R. D. Petrasso, S. Roberts, J. M. Soures, D. D. Meyerhofer, T. C. Sangster, J. P. Knauer, C. Sorce, V. Y. Glebov, C. Stoeckl, T. W. Phillips, R. J. Leeper, K. Fletcher, and S. Padalino, Rev. Sci. Inst. 74 (2003). 8C. Freeman, G. Fiksel, C. Stoeckl, N. Sinenian, M. Canfield,
G. Graeper, A. Lombardo, C. Stillman, S. Padalino, C. Mileham, et al., Review of Scientific Instruments 82, 073301 (2011). 9M. J. Rosenberg et al., submitted to Rev. Sci. Inst. (2014). 10T. R. Boehly, D. L. Brown, R. S. Craxton, R. L. Keck, J. P.
Knauer, J. H. Kelly, T. J. Kessler, S. A. Kumpan, S. J. Loucks, S. A. Letzring, F. J. Marshall, R. L. McCrory, S. F. B. Morse, W. Seka, J. M. Soures, and C. P. Verdon, Opt. Commun. 133, 495 (1997).
11F. H. S´eguin, N. Sinenian, M. Rosenberg, A. Zylstra, M. J.-E. Manuel, H. Sio, C. Waugh, H. G. Rinderknecht, M. G. Johnson, J. Frenje, C. K. Li, R. Petrasso, T. C. Sangster, and S. Roberts, Rev. Sci. Inst. 83 (2012).
12G. Miller, E. Moses, and C. Wuest, Opt. Eng. 43, 2841 (2004). 13M. J. Rosenberg et al., to be submitted to Phys. Plasmas (2014). 14D. L. Bleuel, C. B. Yeamans, L. A. Bernstein, R. M. Bionta, J. A. Caggiano, D. T. Casey, G. W. Cooper, O. B. Drury, J. A. Frenje, C. A. Hagmann, R. Hatarik, J. P. Knauer, M. G. Johnson, K. M. Knittel, R. J. Leeper, J. M. McNaney, M. Moran, C. L. Ruiz, and D. H. G. Schneider, Rev. Sci. Inst. 83 (2012).
15C. J. Waugh, M. J. Rosenberg, et al., to be submitted to Review of Scientific Instruments (2014).
16N. Sinenian, M. J.-E. Manuel, A. B. Zylstra, M. Rosenberg, C. J. Waugh, H. G. Rinderknecht, D. T. Casey, H. Sio, J. K. Ruszczyn-ski, L. Zhou, M. G. Johnson, J. A. Frenje, F. H. S´eguin, C. K. Li, R. D. Petrasso, C. L. Ruiz, and R. J. Leeper, Rev. Sci. Inst. 83 (2012).
17A. B. Zylstra, J. A. Frenje, F. H. S´eguin, M. J. Rosenberg, H. G. Rinderknecht, M. G. Johnson, D. T. Casey, N. Sinenian, M. J.-E. Manuel, C. J. Waugh, H. W. Sio, C. K. Li, R. D. Petrasso, S. Friedrich, K. Knittel, R. Bionta, M. McKernan, D. Calla-han, G. W. Collins, E. Dewald, T. Doppner, M. J. Edwards, S. Glenzer, D. G. Hicks, O. L. Landen, R. Lonson, A. Mackin-non, N. Meezan, R. R. Prasad, J. Ralph, M. Richardson, J. R. Rygg, S. Sepke, S. Weber, R. Zacharias, E. Moses, J. Kilkenny, A. Nikroo, T. C. Sangster, V. Glebov, C. Stoeckl, R. Olson, R. J. Leeper, J. Kline, G. Kyrala, and D. Wilson, Rev. Sci. Inst. 83 (2012).
18Intrinsic background in the CR-39 consists of small defects which can appear to have similar characteristics as real proton tracks and must be discriminated away or subtracted out from the mea-sured signal.
19J. F. Ziegler, M. D. Ziegler, and J. P. Biersack, Nuclear In-struments and Methods in Physics Research Section B: Beam Interactions with Materials and Atoms 268, 1818 (2010). 20The SBD is energy-calibrated using α particles produced by the
decay of226Ra. The proton energy incident on the SRF is de-tremined by the SBD on separate LEIA experiments, with the SBD placed in the SRF position, and filtered with the appropri-ate additional filtering.
21A. B. Zylstra, J. A. Frenje, F. H. S´eguin, M. G. Johnson, D. T. Casey, M. J. Rosenberg, C. Waugh, N. Sinenian, M. J.-E. Manuel, C. K. Li, R. D. Petrasso, Y. Kim, and H. W. Herrmann, Nuclear Instruments and Methods in Physics Research A. 681, 84 (2012). 22D. G. Hicks, C. K. Li, F. H. S´eguin, A. K. Ram, J. A. Frenje, R. D. Petrasso, J. M. Soures, V. Y. Glebov, D. D. Meyerhofer, S. Roberts, C. Sorce, C. Stoeckl, T. C. Sangster, and T. W. Phillips, Phys. Plasmas 7, 5106 (2000).
23S. Skupsky, J. A. Marozas, R. S. Craxton, R. Betti, T. J. B. Collins, J. A. Delettrez, V. N. Goncharov, P. W. McKenty, P. B. Radha, T. R. Boehly, J. P. Knauer, F. J. Marshall, D. R. Harding, J. D. Kilkenny, D. D. Meyerhofer, T. C. Sangster, and R. L. McCrory, Phys. Plasmas 11, 2763 (2004).
24P. W. McKenty, R. S. Craxton, A. Shvydky, F. J. Marshall, R. L. McCrory, J. D. Kilkenny, A. Nikroo, M. L. Hoppe, A. J. Mack-innon, and M. J. Edwards, Bull. Am. Phys. Soc. 55 (2010). 25V. Y. Glebov, C. Stoeckl, T. C. Sangster, S. Roberts, G. J.
Schmid, R. A. Lerche, and M. J. Moran, Rev. Sci. Inst. 75, 3559 (2004).
26V. Y. Glebov, D. D. Meyerhofer, T. C. Sangster, C. Stoeckl, S. Roberts, C. A. Barrera, J. R. Celeste, C. J. Cerjan, L. S. Dauffy, D. C. Eder, R. L. Griffith, S. W. Haan, B. A. Hammel, S. P. Hatchett, N. Izumi, J. R. Kimbrough, J. A. Koch, O. L. Landen, R. A. Lerche, B. J. MacGowan, M. J. Moran, E. W. Ng, T. W. Phillips, P. M. Song, R. Tommasini, B. K. Young, S. E. Caldwell, G. P. Grim, S. C. Evans, J. M. Mack, T. J. Sedillo, M. D. Wilke, D. C. Wilson, C. S. Young, D. Casey, J. A. Frenje, C. K. Li, R. D. Petrasso, F. H. S´eguin, J. L. Bourgade, L. Disdier, M. Houry, I. Lantuejoul, O. Landoas, G. A. Chandler, G. W. Cooper, R. J. Leeper, R. E. Olson, C. L. Ruiz, M. A. Sweeney, S. P. Padalino, C. Horsfield, and B. A. Davis, Rev. Sci. Inst. 77 (2006).
27Particle fluence anisotropies can also contribute an additional uncertainty to the overall measured yield uncertainty, but these can be minimized in an appropriately-designed implosion where the protons are emitted >∼ns after the end of the laser pulse.15. 28The thickness of each SRF filter is measured individually, with a
conservative uncertainty of ±1 µm.
29This energy uncertainty is roughly comparable to that of the WRF proton spectrometer used at a higher energy range,7,11,17 4-20 MeV, in contrast to the ∼1-3 MeV range for energy mea-surement using the present SRF spectrometer.
30D. G. Hicks, C. K. Li, F. H. S´eguin, J. D. Schnittman, A. K. Ram, J. A. Frenje, R. D. Petrasso, J. M. Soures, D. D. Meyerhofer, S. Roberts, C. Sorce, C. Stoeckl, T. C. Sangster, and T. W. Phillips, Physics of Plasmas 8 (2001).
31N. Sinenian, A. B. Zylstra, M. J.-E. Manuel, H. G. Rinderknecht, J. A. Frenje, F. H. Sguin, C. K. Li, R. D. Petrasso, V. Goncharov, J. Delettrez, I. V. Igumenshchev, D. H. Froula, C. Stoeckl, T. C. Sangster, D. D. Meyerhofer, J. A. Cobble, and D. G. Hicks, Applied Physics Letters 101, 114102 (2012).