Rétrécissement et diffusion de l’eau dans les aliments subissant la
transition vitreuse durant le séchage convectif
Thèse
Thanh Khuong Nguyen
Doctorat en sciences et technologie des aliments
Philosophiae doctor (Ph. D.)
Rétrécissement et diffusion de l’eau dansles aliments subissant la
transition vitreuse durant le séchage convectif
Thèse
Thanh Khuong Nguyen
Sous la direction de :
Cristina Ratti, directrice de recherche
Martin Mondor, codirecteur de recherche
RÉSUMÉ GÉNÉRAL
Le séchage convectif est une méthode fréquemment utilisée pour conserver les aliments. Le séchage est affecté par plusieurs phénomènes, tels que la transition vitreuse, le rétrécissement ou la porosité de l’aliment. La qualité du produit sec est souvent moindre par rapport à celle du produit d'origine. La compréhension de la relation de base dans un aliment durant le séchage aidera à mieux contrôler le procédé. Le but de cette étude est d'analyser le rôle de la transition vitreuse, de la porosité, de la structure et de la composition de l’aliment sur le rétrécissement et à valider l'application de la loi de Fick pour la diffusion de l'eau à l'intérieur du produit durant le séchage convectif.
Dans le chapitre 1, une revue de la littérature sur le séchage convectif, la transition vitreuse et le rétrécissement, ainsi que des études spécifiques sur le transfert de masse non-Fickien durant le séchage sont présentées. À partir de l'évolution des connaissances dans ce domaine, il a été démontré que la transition vitreuse et la porosité peuvent affecter le transfert de masse, le profil d'humidité et le rétrécissement durant le séchage convectif, en modifiant les propriétés mécaniques de la matrice où l'humidité est transportée, ainsi que la formation de la couche vitreuse à la surface du produit durant des conditions de séchage spécifiques. Dans le chapitre 2, des isothermes de sorption et la température de transition vitreuse de pommes de terre, de carottes (cellulaire) et de deux systèmes de gel (non-cellulaire) ont été déterminées expérimentalement et ont été estimés à l’aide de modèles mathématiques. Les modèles mathématiques de Guggenheim, Anderson, de Boer (GAB) et de Gordon-Taylor (G-T) ont par la suite été utilisés pour représenter respectivement les isothermes de sorption et la température de transition vitreuse en fonction de la teneur en humidité. L'équation de Khalloufi-Ratti (K-R) a été utilisée pour la prédiction de la température de transition vitreuse en fonction de l'activité de l'eau. Une bonne corrélation entre les données expérimentales et les modèles GAB, G-T et K-R a été observée.
réduction de volume en fonction de la teneur en humidité ont été représentées avec une grande précision par les modèles mathématiques développés par Khalloufi et al. Aucune différence significative de porosité et de rétrécissement entre les deux échantillons pendant le séchage n'a été observée. Aucune variation de la pente de la courbe de rétrécissement en fonction de la teneur en humidité durant le séchage n’a été observée Ces résultats indiquent que la transition vitreuse seule n'est pas un facteur déterminant dans les changements de porosité ou de volume pendant le séchage convectif des systèmes alimentaires non-cellulaires.
Dans le chapitre 4, le rétrécissement des aliments cellulaires durant le séchage convectif a été analysé. La teneur en humidité initiale de la carotte à l'extérieur et au centre de la racine était identique, tandis que celles de la pomme de terre étaient significativement différentes. Les cellules des échantillons de pommes de terre provenant de la partie extérieure de la racine avaient un volume plus faible avec une teneur en amidon plus élevée que celle provenant de la partie centrale de la racine. La relation entre le rétrécissement de la carotte et la teneur en humidité du produit durant le séchage était linéraire. Pour la pomme de terre, une variation de la pente de la courbe de rétrécissement en fonction de la teneur en humidité durant le séchage a été observée. La température de l'air et la vitesse de l'air n'ont eu aucun effet sur le comportement de rétrécissement des deux produits. De plus, aucun impact significatif de la transition vitreuse sur le rétrécissement des échantillons n'a été observé. La différence au niveau de la teneur en amidon et au niveau de la structure cellulaire, de même que leur impact sur les propriétés mécaniques du matériau ont été identifiées comme étant fort probablement responsables des différences observées au niveau du rétrécissement.
Dans le chapitre 5, l'effet de la transition vitreuse sur les profils d'humidité de deux systèmes de gel et de pomme de terre à différentes conditions de séchage a été étudié. Les profils d'humidité des échantillons ont montré une forme carrée au début du séchage. Au stade intermédiaire du séchage, les profils d'humidité sont devenus plus arrondies sur les bords de la matrice comme observé durant le transport Fickian. La loi de Fick a été utilisée pour prédire raisonnablement bien les profils d’humidité de différents matériaux ayant des températures de transition vitreuse différentes et pour différentes conditions de séchage. Mots clés: profil d'humidité, transition vitreuse, rétrécissement, porosité, amidon, propriété mécanique.
ABSTRACT
Air-drying is a frequent method used to preserve foods. The drying is affected by several phenomena, such as glass transition, shrinkage, or porosity. The quality of an air-dried product is often drastically reduced from that of the original foodstuff. Understanding the basic relationship prevailing during moisture transfer within a food will lead to better process control. The aim of this study is analyze the role of glass transition, porosity, food structure and composition on the shrinkage of food during air drying, and on the application of Fick’s law to the diffusion of water inside the product during the convective drying.
In chapter 1, a literature review on air-drying, glass transition and shrinkage phenomenon, as well as specific studies on non-Fickian mass transfer during drying are presented. From the knowledge evolution in this area, it has been shown that glass transition and porosity may impact mass transfer, moisture profiles and shrinkage during air-drying, by changing the mechanical properties of the matrix where moisture is transported, as well by the formation of a glassy layer at the surface of the product during specific operation conditions.
In chapter 2, glass transition temperature and sorption isotherms of potato, carrot (cellular) and two gel systems (non-cellular) were determined from experimental data and estimated from mathematical modelling. Guggenheim, Anderson, de Boer (GAB) and Gordon–Taylor (G-T) mathematical models were used to represent sorption isotherms and glass transition temperature, respectively, as a function of moisture content. Khalloufi-Ratti (K-R) equation was used for the prediction of glass transition temperature as a function of water activity. A good correlation between experimental data and GAB, G-T, and K-R models was observed. The study of different factors on shrinkage during drying was analysed in two chapters, for non-cellular and cellular foods. In chapter 3, the impact of glass transition on shrinkage of two non-cellular systems during air-drying was assessed from experimental data and the
the slope of the shrinkage curve as a function of moisture content was perceived. These results indicate that glass transition alone is not a determinant factor in changes of porosity or volume during air-drying of non-cellular food systems.
In chapter 4, shrinkage of cellular food during air drying was analysed. The initial moisture content of carrot at exterior and center of the root were identical while those of potato were not. The cells of the exterior potato samples had smaller volume with higher starch content than the center sample. Shrinkage of carrot had a linear relationship with moisture content during drying. For potato, a change in the slope of the shrinkage curve as a function of moisture content during drying was observed. The air temperature and air speed had no effect on the shrinkage behaviour of both products. No significant impact of glass transition on shrinkage of samples has been found. Differences in starch content, in structure of the cellular material and its relationship with mechanical properties of material are probably responsible for the different shrinkage observed.
In chapter 5, the effect of glass transition on moisture profiles of two gel systems and potato at different drying conditions was investigated. The moisture profiles of samples showed a sharp form at the beginning of drying. At the middle stage, the moisture profiles became round as indicated in Fickian transport. Fick’s law can be used to predict reasonably well the profiles of different materials having different glass transition temperatures and for different drying conditions.
Keywords: moisture profile, glass transition, shrinkage, porosity, starch, mechanical properties.
TABLE DES MATIÈRES
RÉSUMÉ………..iii
ABSTRACT……….. v
TABLE DES MATIÈRES……….….vii
LISTE DES TABLEAUX ……….…...x
LISTE DES FIGURES………xi
LISTE DES ABREVIATIONS ET DES SIGLES……….….xiii
AVANT-PROPOS……….….xvi
INTRODUCTION ………1
Chapter 1 REVUE DE LITERATURE ... 3
1.1 Introduction ... 4
1.2 Air-drying ... 5
1.2.1 Definition and generalities ... 5
1.2.2 Heat and mass transfer, temperature and moisture profiles during air-drying ... 5
1.2.3 Shrinkage ... 9
1.3 Air-drying and glass transition ... 13
1.3.1 Glass transition definition and generalities ... 13
1.3.2 Moisture transport and glass transition ... 14
1.3.3 Shrinkage and glass transition ... 22
1.3.4 Collapse ... 25
1.3.5 Mathematical modelling ... 27
1.4 Conclusion ... 29
1.5 Hypotheses ... 30
1.6 Objectives ... 31
Chapter 2 STATE DIAGRAMS OF POTATO, CARROT AND TWO AGAR-MALTODEXTRIN MODEL SYSTEMS ... 32
2.1 Abstract ... 34
2.4 Results and discussion ... 43
2.4.1 Water Sorption Isotherms ... 43
2.4.2 Glass transition temperature ... 47
2.4.3 Glass transition temperature versus aw ... 52
2.4.4 State diagrams ... 54
2.5 Conclusions ... 57
Chapter 3 SHRINKAGE AND POROSITY EVOLUTION DURING AIR-DRYING OF NON-CELLULAR FOOD SYSTEMS: EXPERIMENTAL DATA VERSUS MATHEMATICAL MODELLING ... 58
3.1 Abstract ... 60
3.2 Introduction. ... 61
3.3 Materials and methods ... 64
3.3.1 Materials ... 64
3.3.2 Experimental protocol ... 64
3.3.3 Porosity determined by imagery ... 67
3.3.4 Magnetic Resonance: Image tests ... 69
3.3.5 Mechanical Properties ... 71
3.3.6 Mathematical modelling ... 71
3.4 Results and discussion ... 73
3.4.1 Experimental data ... 73
3.4.2 Mathematical modeling results ... 83
3.5 Conclusions ... 88
Chapter 4 SHRINKAGE OF CELLULAR FOODS DURING AIR DRYING ... 89
4.1 Abstract ... 91
4.2 Introduction ... 92
4.3 Materials and methods ... 96
4.3.1 Materials and sample preparation ... 96
4.3.2 Shrinkage during air-drying ... 98
4.3.3 Moisture content ... 99
4.3.4 Scanning Electron Microscope (SEM) ... 99
4.3.5 Mechanical Tests ... 100
4.3.6 Statistical analysis ... 100
4.4 Results and discussion ... 101
4.4.1 Initial moisture content (average and distribution) ... 101
4.4.2 Shrinkage ... 103
Chapter 5 ANALYSIS OF MOISTURE PROFILES AND APPLICATION OF FICK’S LAW OF FOODSTUFFS UNDERGOING GLASS TRANSITION DURING
AIR DRYING ... 119
5.1 Abstract ... 121
5.2 Introduction ... 122
5.3.1 Materials. ... 127
5.3.2 Magnetic Resonance Image testing ... 127
5.3.3 Evaluation of the Fick’s law on moisture profiles ... 128
5.3.4 Dry layer thickness ... 129
5.4 Results and discussion ... 130
5.4.1 Relationship between MRI signal intensity and moisture content ... 130
5.4.2 Moisture profile and images from MRI ... 132
5.4.3 Dry shell ... 136
5.4.4 Applicability of Fick’s law ... 142
5.5 Conclusion ... 146 CONCLUSION GÉNÉRALE ... 147 PERSPECTIVES ... 148 ANNEXES ... 149 REFERENCES ... 164
LISTE DES TABLEAUX
Table 2.1 Parameters of GAB model fitted to experimental data. ... 46 Table 2.2 Parameters of the Gordon-Taylor model (Eq. (2)). ... 51 Table 2.3 Parameters of Khalloufi-Ratti model. ... 53 Table 2.4 Critical water activity and Critical water content of MD19, MD36, potato and
carrot at 4°C and 25°C. ... 56 Table 3.1 Calculation of the b value involved in the mathematical models of Khalloufi et al. (2000). ... 84 Table 3.2 Comparison of the three measurement methods at the end of drying of mixtures
of NCFS that include MD19 or MD36. ... 86 Table 4.1 Values of a1, b1, a2, b2 (Eqs. (2) and (3)) and (X/Xo)c for potato slabs at different
initial moisture contents. ... 108 Table 5.1 (X/Xo)dl values for MD19, MD36 and potato at 25 and 55oC drying temperature.
LISTE DES FIGURES
Figure 1.1 Temperature and moisture profiles during air-drying. ... 7
Figure 1.2 Shrinkage during air-drying of carrot and potato 10mm diameter cylinders at 55oC and 1.6 m/s (own experimental data). ... 10
Figure 1.3 Moisture profiles during air-drying at low (a) and high (b) Biot mass numbers. 12 Figure 1.4 Moisture and temperature profiles during air-drying without (a) or with (b) glass transition happening during the process. ... 17
Figure 1.5 Signal intensity profiles of a model food gel during room temperature drying (adapted from Schrader and Litchfield, 1992). ... 20
Figure 1.6 Experimental and calculated local moisture content vs dimensionless distance from the center of the sample during drying (adapted from Castell-Palou et al., 2011). ... 21
Figure 1.7 Graphical representation of product (Tp) and glass transition (Tg) temperatures during drying of a particle with hypothetical uniform moisture content, at different air temperatures (increasing levels from 1 to 4). ... 24
Figure 2.1 Sorption isotherms for potatoes, carrots, MD19 and MD36 at 25oC (experimental and GAB prediction). ... 44
Figure 2.2 Glass transition temperature versus moisture content. ... 48
Figure 2.3 State diagram of different food materials. ... 55
Figure 3.1 Experimental protocol design. ... 66
Figure 3.2 Porosity of NCFS containing MD19 samples during drying, a) porosity evolution after 120, 180 and 420 minutes, b) detailed photo taken at 300 minutes. ... 68
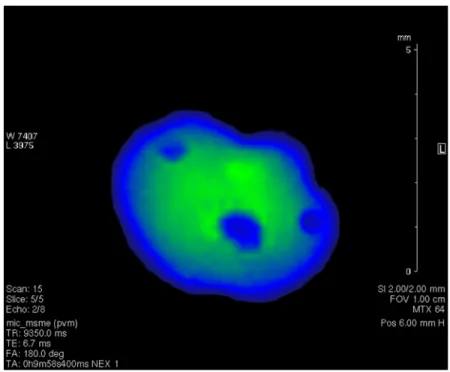
Figure 3.3 MRI image of NCFS containing MD19 after 150 minutes of drying. ... 70
Figure 3.4 Glass transition temperature of NCFS (MD19 and MD36). ... 74
Figure 3.5 Comparison between experimental data of volume reduction and the mathematical model of Khalloufi et al. (a) NCFS of MD19, (b) NCFS of MD36. ... 76 Figure 3.6 Maximum stress versus relative moisture content of NCFS (MD19 and MD36)
Figure 4.1 sample preparation for potato (a) and carrot (b). ... 97 Figure 4.2 Initial moisture versus position of potato. ... 102 Figure 4.3 Shrinkage of carrot cylinders and slabs during air drying at 55oC and 1.6m/s. 104
Figure 4.4 Shrinkage, Tg and temperature of the potato cylinder having Xo=4.7 at 55oC.105 Figure 4.5 Shrinkage, Tg and temperature of product for potato slabs at 65oC (a) and 25oC
(b) during air drying. ... 107 Figure 4.6 Effect of initial moisture on the maximum shrinkage for carrots and potatoes
slabs. ... 110 Figure 4.7 SEM images of potato: fresh interior sample (a), fresh exterior sample (b), dried
interior sample (c) and dried exterior sample (d) (dried at temperature of 55°C and air speed of 1.6m/s for 4 hours). ... 113 Figure 4.8 Maximum stress versus X/Xo obtained by compression test at ambient
temperature for exterior potato, interior potato and carrot. ... 116 Figure 5.1 Moisture profile of product without (a) or with (b) dry layer at the surface of a
product during air drying. ... 124 Figure 5.2 Moisture content of sample in function of signal intensity of MRI. ... 131 Figure 5.3 Moisture profiles (upper figure) together with MRI images (lower figure), in the
case of drying of MD19 at 55oC after 30 minutes (left) and 100 minutes (right). ... 133 Figure 5.4 MRI images of MD36 and potato during drying at 25°C and 1.6m/s air speed (*
indicates the moment from when porosity was observed). ... 135 Figure 5.5 Moisture profile of MD19 during drying at temperature of 55°C, 1.6m/s of air
speed. ... 137 Figure 5.6 Moisture profile of MD36 during drying at temperature of 55°C, 1.6m/s of air
speed. ... 137 Figure 5.7 Moisture profile of potato during drying at temperature of 55°C, 1.6m/s of air
speed. ... 138 Figure 5.8 Dry layer formation at sample surface during drying at temperatures of 25 and
55°C. ... 141 Figure 5.9 Moisture profile and quadratic polynomial fitting of MD19 model system after
420 minutes drying at 25oC. ... 143 Figure 5.10 Coefficient of determination (R2 value) of order 2 polynomial equation (Fick’s
LISTE DES ABREVIATIONS ET DES SIGLES
(V/Vo)f : maximum shrinkage
(X/Xo)c : X/Xo at which a slope change of the shrinkage curve was observed.
(X/Xo)dl: X/Xo at which dry layer was sharply increase.
(X/Xo)Tg : cross point between the product temperature and the glass transition temperature
a: value constant in the shrinkage linear equation (slope) aw: water activity
b: value constant in the shrinkage linear equation (maximum shrinkage)
Bc: relaxation parameter, material constant.
BET: Brunauer-Emmett-Teller BiM: mass transfer Biot number
C-K: Couchman and Karasz
C1: universal constant of WLF model.
C2: universal constant of WLF model.
CWA: critical water activity CWC: critical water content DE: dextrose equivalent
Deff: effective diffusion coefficient.
DSC: Differential Scanning Calorimeter e: product thickness
E(t): stress relaxation function, a function of temperature and fluid content Eq: equation
G-T: Gordon–Taylor
G(t): stress relaxation function
GAB: Guggenheim, Anderson, de Boer K-R: Khalloufi-Ratti
K: factor related to the multilayer heat of sorption k: fitting constant of the Gordon-Taylor model.
kg: convective mass transfer coefficient based on pressures,
Lo: characteristic length,
M: number average molecular of the sample m: weight
MD19: non-cellular food system making from maltodextrin (dextrose equivalent 19) MD36: non-cellular food system making from maltodextrin (dextrose equivalent 36) MRI: Magnetic Resonance Imaging
Sb: Shrinkage coefficient
SEM: Scanning Electron Microscope subindex ‘c’: critical moisture content subindex ‘o’: refers to the initial value. T: temperature
t: time
Tair: air temperature
Tc: temperature at the center of product
TD-NMR: Time-Domain Nuclear Magnetic Resonance Tg: Glass transition temperature
Tg1: glass transition temperature of solids (Gordon-Taylor model)
Tg2: glass transition temperature of water (Gordon-Taylor model)
𝑇𝑔s: glass transition temperature (oC) of the solid
𝑇𝑔w: glass transition temperature (oC) of the water
Ti: temperature at the surface of product
Tp: temperatures of product
v: air speed V: volume
V/Vo: dimensionless volume factor
w: moisture content in wet basis WLF: williams–landel–ferry
X: moisture content (kg water/kg dry solids) X/Xo: dimensionless water content in dry basis
x1: mass fraction of solids (in Gordon-Taylor model)
x2: mass fraction of water (Gordon-Taylor model)
Xc: moisture content from the center of product
Xc1: critical moisture content
Xi: surface moisture content
Xintersection: water content critique of MRI calibration curve.
Xm: GAB monolayer moisture (dry basis). Xo: initial moisture content
Xp: critical moisture content at which the formation of pores started Xtg: critical moisture content at which the glass transition occurs
Y: constant related to the monolayer heat of sorption b: ratio between solid density and water density e: porosity
e0: initial pores
j f: volume fraction of the fluid
j: concentration-related variable
µg: viscosity of the product at temperature Tg
µ: viscosity of the product at temperature T q: shrinkage function
REMERCIEMENTS
Cette thèse a été réalisée grâce à l’octroi d’une bourse de l'Agence canadienne de développement international (bourse de l'ACDI). Elle a été soutenue financièrement par le Conseil de recherches en sciences naturelles et en génie du Canada et par la société Gosselin G2 Inc. (pommes de terre pour l’étude).
Je tiens tout d’abord à remercier mon mari Cuong, mes enfants Han et Phong, mes parents, mes sœurs Lan et Tu, pour leur présence de chaque instant, leur soutien lors des moments difficiles et leur amour, leur compréhension de même que pour n'avoir jamais cessé de croire en moi.
Je tiens à adresser mes plus sincères remerciements à ma directrice de recherche, professeure Cristina Ratti, qui m’a accueilli au sein de son laboratoire et m’a offert un projet fort intéressant ainsi qu’un inestimable appui scientifique et moral. Merci Cristina pour ta confiance en moi, tes encouragements, et tes conseils à toutes les rencontres, merci aussi pour ton aide financière. Je souhaite également remercier Monsieur Martin Mondor, mon co-directeur de recherche, pour m’avoir donné des conseils et les corrections pour ma thèse, merci pour sa gentillesse et ses encouragements.
J’ai également eu la chance de travailler avec Monsieur Séddik Khalloufi pour une partie du chapitre 3 de ma thèse. Un remerciement spécial à Séddik pour sa participation dans mes travaux de thèse et pour ses connaissances et encouragements.
J'aimerais également remercier Jocelyne Giasson et Diane Gagnon, pour le support technique dont j’ai pu bénéficier tout au long de mes études. Merci pour leur grande disponibilité et particulièrement pour leur rigueur au laboratoire. Elles ont contribué à la qualité de tous mes résultats.
AVANT-PROPOS
Cette thèse comporte 5 chapitres qui sont ou seront publiés dans des revues scientifiques. Je suis le premier auteur de ces cinq articles dans lesquel j’ai contribué en planifiant et en accomplissant de la recherche bibliographique, des manipulations en laboratoire, analyse des données et la rédaction. La professeure Cristina Ratti, ma directrice de recherche, a fourni les idées générales de la thèse. Elle m’a aidée à faire l’analyse des données, la rédaction, la discussion des résultats, et la correction de la thèse. Mon co-directeur de recherche, Monsieur Martin Mondor, m’a aidé à la discussion des résultats. Il a aussi donné les commentaires et les corrections de ma thèse. Les contributions par les autres personnes seront indiquées dans chaque chapitre s’il y a lieu.
Le premier chapitre intitulé ‘Revue de littérature’ a été publié comme un chapitre dans un livre scientifique qui s’appelle ‘Air-Drying and Non-Equilibrium States/Glass Transition. In Non-Equilibrium states and Glass Transitions in Foods’, édité par B. Bhandari, and Y. Roos (Elsevier, Woodhead Publishing, 2017).
Le deuxième chapitre ‘State diagrams of potato, carrot and two agar-maltodextrin model systems’ a été soumis à la revue Journal of Food Properties. J’ai écrit la première version de ce chapitre. Et par la suit Madame Cristina Ratti et Monsieur Martin Mondor ont donné des commentaires et des corrections.
Le troisième chapitre ‘Shrinkage and porosity evolution during air-drying of non-cellular food systems: experimental data versus mathematical modelling’ a été soumis à la revue Food Research International. La rédaction de ce chapitre a été effectué par Madame Cristina Ratti et par moi. Madame Ma. Guadalupe García Camarena, une assistance de recherche, a fait les tests de compression pour fournir les données brutes. Monsieur Séddik Khalloufi a fait la partie de modélisation mathématique.
Le quatrième chapitre ‘Shrinkage of cellular foods during air drying’ est prêt pour la soumission au Journal of Food Engineering. Un court article sous le nom ‘Effect of initial solis content and structure of potato on shrinkage during air drying’ a été publié dans les actes de colloque de l’International Conference on Food Properties 2016 pour lequel j’ai gagné le prix ‘Best paper award on Mass Transfer Properties, Mass-Volume-Related Properties and
et Monsieur Martin Mondor ont données leurs commentaires et corrections. Madame Ma. Guadalupe García Camarena a fait les tests de compression en laboratoire pour fournir les données brutes.
Le cinquième chapitre ‘Analysis of moisture profiles and application of fick’s law of foodstuffs undergoing glass transition during air drying’ sera publié plus tard. J’ai effectué la première version de ce chapitre, puis Madame Cristina Ratti et Monsieur Martin Mondor ont donné des commentaires et des corrections.
Finalement, une ‘Conclusion générale’ est présentée à la fin de la thèse. Cette partie comporte une discussion globale des résultats principaux et novateurs obtenus dans ce projet suivie par la présentation des perspectives pour les travaux futurs.
INTRODUCTION GÉNÉRALE
Air-drying is a preservation method using hot air to evaporate water from the material. It is largely used to prolong the shelf life and ease the transportation of foods. Nevertheless, unfavourable physical phenomenon is usually observed during and after air-dehydration. Shrinkage is an undesirable problem causing poor product quality touching product volume, structure, colour, taste and aroma of air-dehydrated product (Mayor and Sereno, 2004; Tsotsas and Mujumdar, 2011). Another important effect of shrinkage is the change of moisture diffusivity (Kurozawa et al., 2012; Prothon et al., 2003).
Ideal shrinkage supposes that volume reduction of foods during air-drying follows the amount of removed water during the whole process, which can be represented by a straight line of the shrinkage curve as a function of relative moisture content in dry basis (Crapiste et al., 1985; Karathanos et al., 1993). However, experimental research done in food shrinkage during drying often indicated that this relationship could not be explained only by a single linear relationship (Achanta et al., 1997; Katekawa and Silva, 2007; Kurozawa et al., 2012). Specially in the case of potato, results are somehow contradictory, sometimes shrinkage is presented by one straight line, sometimes by two. Various reasons were mentioned to be responsible for the derivation of shrinkage during air drying. Shrinkage may be affected by glass transition (Katekawa and Silva, 2007; Kurozawa et al., 2012), drying conditions (Ratti, 1994; Wang and Brennan, 1995), structure of food (Joardder et al., 2015), porosity (Karunasena et al., 2015; Lozano et al., 1983), initial solid content (Lozano et al., 1983), mechanical properties (Gulati and Datta, 2015) or the type of the material (Lewicki, 1998). However, there is much disagreement between authors. Drying conditions and sample diameter did not show significant effects on shrinkage in the case of carrot and potato (Frías et al., 2010; Hatamipour and Mowla, 2002). Numerous authors proposed that shrinkage behaviour is the combined effect of many simultaneous factors (Gulati and Datta, 2015; Hatamipour and Mowla, 2002; Lewicki, 1998; Mayor and Sereno, 2004). According to Ratti (1994) the disagreement among authors as mentioned above could be due to the lack of exact knowledge about the combined effects.
Fick’s law of diffusion is generally applied to analyse the overall transport mechanism during air-drying which results in a round quadratic moisture profile (Rizvi, 2005). However, some
authors suggest that the moisture diffusion becomes non-Fickian when material undergoes the glass transition (Kim et al., 1996; Thomas and Windle, 1982; Xing et al., 2007). According to Kim et al. (1996) when the glass transition occurs, discontinuous stress profiles are formed. The polymer stress gradient offers negative driving forces to the solvent transport against the chemical potential gradient and this causes a non-Fickian transport behavior (Kim et al., 1996). Xing et al. (2007) suggested that the formation of external dry layer of the product during air-drying forms a barrier pointing out a reason for a non-Fickian moisture profile of material which could be related to glass transition. According to Takhar (2008), since moisture is removed from the external material during air drying, a glassy layer could form at the outside of product separated from the rubbery layer by the glass transition region (Takhar, 2008). Van der Sman (2007) proposed that the mechanical properties of the shell in the outside of the product plays a critical role in moisture transport. The structure of material also plays a role in the moisture diffusion during drying (Becker and Sallans, 1957; Marousis et al., 1991; Metzger et al., 2007). According to Becker and Sallans (1957), water migration in the porous material during drying change diffusivity at a moisture content of about 14% caused by the increase of porosity, and by the shell layer at the internal surface.
Most studies of moisture transport in foods use experimental data based on average moisture content, such as the characterization of food drying from the average drying rate only. Average drying data are often insufficient to allow the investigation of the underlying physics of moisture transport, particularly in heterogeneous systems such as foods (McCarthy et al., 1994). To study the drying kinetics, it is important to determine the moisture profiles, i.e. water distribution across the cross-section in the food during drying (Xing et al., 2007). The objective of the present work was to study the effect of glass transition, porosity, drying conditions, initial solid content, structure of cellular foods and mechanical properties on volume change and the moisture profile of non-cellular and cellular foodstuffs during air-drying.
1.1 Introduction
Air-drying is an ancient process used to preserve foods in which the solid to be dried is exposed to a continuously flowing hot stream of air where moisture evaporates. The process touches on all the phenomena, some hidden and chemically controlled, related to transport of a vapor or liquid through and between phases (Hottel, 1994), and offers dehydrated products that can have an extended shelf life. Regrettably, the quality of a conventionally air-dried product is often drastically reduced from that of the original foodstuff.
In spite of being under serious research since early as 1929, when Thomas Kilgore Sherwood completed his PhD thesis on ‘The Mechanism of the Drying of Solids’ (M.I.T.), the drying process is yet difficult to control in terms of final product quality and almost impossible to predict without trial and error against specific drying data. The complexity of solid materials, the interaction between compounds and the matrix, the lack of precise information of various transport parameters and the difficulty in determining moisture profiles with accuracy within the sample are among the reasons why complete constitutive equations proper to drying of solid foods could not be developed. As an example, the glass transition occurring in the product while processing has only been included in food –related research in the last 30 years. In this Chapter, an analysis of air-drying and glass transition from generalities of the process and shrinkage phenomenon, to specific studies on non-Fickian mass transfer during drying is presented. Data showing evidence of the impact of glass transition on drying and volume change are provided and possible explanation to abnormal phenomena, endeavoured.
1.2 Air-drying
1.2.1 Definition and generalities
A wet material placed in a medium having lower water pressure will dehydrate until equilibrium between the material and the medium is reached. During air-drying, the medium is hot air at total pressures ranging from vacuum to atmospheric. Although spray-drying and vacuum drying are particular cases of air-drying, in this chapter only hot air at low temperatures (less than 100oC) and at atmospheric pressure conditions will be explored as the drying medium.
Air-drying of foods is an important method of preservation and production of a wide variety of products. Storage technologies are now available to keep foodstuffs "fresh" in specialized chambers over extended periods without appreciable change in their original physical form. Air-drying, on the other hand, changes the physical and biochemical form of the product leading to shrinkage and change of colour, texture, taste, and so on. However, if the water activity is reduced to appropriate levels (depending on the specific food being treated), the dried product can have a shelf life exceeding one year if properly packaged.
Most foods have intermediate to high water content as well as compounds that are heat sensitive, leading to a slow air-drying process carried out under gentle conditions in large dryers for a given throughput. Important independent variables of the air-drying process that need to be optimized in order to increase the drying rate are temperature (Tair), relative
humidity (RH) and speed (v) of the air, as well as product thickness (e). Pre-treatment of the feed to speed the drying process and/or use of additives to avoid biochemical damage during the extended drying period are often necessary. The type of treatment and additives used depends on the product being processed.
1.2.2 Heat and mass transfer, temperature and moisture profiles during air-drying
Air-drying of foods is a complex phenomenon involving simultaneous mass and energy transport processes in a system that, in addition, is hygroscopic and shrinking (Araya-Farias and Ratti, 2008; Mujumdar, 1997; Ratti, 2001). The rate of dehydration, such an important parameter in dried food production and for modulating final product quality as well, is
Figure 1.1 shows a schematic representation of a cylindrical food particle in contact with hot air during drying. This type of diagram has been thoroughly represented in the literature concerning drying basic concepts, however is repeated here since it is essential to the proper understanding of heat and mass transfer taking place while drying process occurs. Depending on the specific process, water removal can be limited by either heat or mass transfer, or the resistances to these two transport phenomena can be coupled, i.e. depend on each other (Karel and Lund, 2003).
Heat transfer from the air to the wet solid (external) can be a result of convection, conduction or radiation effects and in many cases, a combination of them. Internal heat is mainly transferred by conduction, very rapid if compared to the external heat transfer during most of the drying process due to the elevated thermal conductivity of water, a main food compound, therefore the heat transfer during drying is usually externally controlled. In Figure 1.1, the typical temperature profile during drying has been schematized, where, according to the knowledge about the external control for heat transfer, the temperature profile in the ‘air’ phase is more steep than the one in the ‘food’ phase. Inside the sample, and because during drying particle size should be thinner than 1 cm, the difference between surface temperature (Ti) and center temperature (Tc), is only 1-3oC. Since this temperature difference is so small,
the internal temperature profile could easily be supposed as linear with small slope or flat. On the other hand, mass transfer depends either on the movement of moisture internally within the solid and the movement of water vapour from the solid surface to the bulk medium. External mass transfer is mostly achieved by convection, and could be controlling mass transfer only at the beginning of the drying process when the particle has a uniform high moisture profile, or else when the air velocity is very low or inexistent. However, the internal mass transfer is generally recognized to be the principal rate-limiting step during food air-drying.
The structure of food material being dried plays an important role on the mechanism of water movement within product. As stated in Crapiste and Rotstein (1997), moisture movement in food materials can be mainly caused by capillary flow (gradient of capillary suction pressure), liquid diffusion (concentration gradients), vapor diffusion (partial vapor-pressure gradients), viscous flow (total vapor-pressure gradients) and less importantly by thermal diffusion, surface diffusion, and flow due to shrinkage or gravity forces. Due to the evident complexity of the internal mass transfer process, no generalized theory thus exists to explain the whole mechanism of internal moisture movement during drying. As pointed out by Rizvi (2005), in the case of simple liquid materials and gels, the water transport is by molecular diffusion from the interior to the surface of product, where it is removed by evaporation. In more complex food matrices, it is generally accepted that diffusion is the overall transport mechanism during air-drying and that Fick’s law is commonly applied. Figure 1.1 shows the moisture profiles of the ‘air’ and ‘food’ phases during drying, no external nor internal controlling rate was supposed for the drawing representation and thus, both profiles have been sketched with similar heights, the internal profile considering moisture contents from the center (Xc) to the surface (Xi), and the external one, counting the difference in water
pressures from the surface (pwi) to the bulk air (pw∞). It has to be noted that there is a
concentration jump in the interphase counting for the fact that chemical potential and not water concentration is the driving force for interface mass transfer. The common key supposition of thermodynamic equilibrium (sorptional equilibrium) at the interface applies. Since chemical potential instead of concentration is the driving force for mass transfer, the relative importance of the internal and external resistances may be interpreted through a mass transfer Biot number (BiM), which if a classic diffusion moisture transfer is supposed inside
the particle, it should be defined as (Ratti, 1994):
1.2.3 Shrinkage
Volume reduction of products during air-drying is an inevitable phenomenon, and relevant to many kind of materials such as wood, plants, gels, soils, etc. As well, loss of water and heating during air-drying of foodstuffs causes important stresses in the cellular structure leading to change in shape and decrease in dimension (Mayor and Sereno, 2004). Shrinkage of porous material results from the lowering in the liquid pressure induced by the desaturation process at the interface (Coussy and Brissard, 2009), elasticity of the still wet material plays an important role in particle deformation and so, while water is evaporating, the space left shrinks. The theoretical basis for shrinkage should thus involve mechanical laws, taking into account material stresses and deformations during drying. This analysis, however, could be extremely challenging when applied to foodstuffs due to the multiphase and cellular intrinsic structure of the system, and the lack of knowledge about the relationships between structures, mechanic and elastic properties of each phase of the system, and their variation with moisture content and temperature (Ratti, 1994).
Figure 1.2 shows a typical graphic illustration of shrinkage during air-drying of carrot and potato cylindrical samples (own experimental data), where the dimensionless volume factor, V/Vo, is represented as a function of dimensionless water content (dry basis), X/Xo. As shown
in this Figure for carrot samples, volume reduction is often reported as close to the volume of evaporated water (Crapiste et al., 1985; Karathanos et al., 1993), and thus the relationship between V/Vo and X/Xo is linear. However, as depicted with potato data in Figure 1.2, other
publications indicated that shrinkage does not always follow the amount of water evaporated during the whole drying process (Katekawa and Silva, 2007; Lozano et al., 1983; Ratti, 1994; Witrowa-Rajchert and Lewicki, 2006). In these cases, the relationship between both variables can be well explained by two linear relationships instead of one (Ratti, 1994).
Figure 1.2 Shrinkage during air-drying of carrot and potato 10mm diameter cylinders at 55oC and 1.6 m/s (own experimental data).
Shrinkage is not only dependent on water content, but also on drying conditions (Mayor and Sereno, 2004; Ratti, 1994; Van Arsdel et al., 1973). Under extreme drying conditions, the extent of shrinkage is usually lower than under gentle operation variables. How shrinkage could be related to operating conditions has been explained by Ratti (1994) based on the Biot number for mass transfer (defined in Eq. (1)). In Figure 1.3, moisture profiles of a particle during drying at extreme BiM number cases are illustrated. For low values of BiM, which
means gentle drying conditions, mass transfer is controlled externally and profiles are flat and uniform inside the particle, elasticity of the moist sample thus allowing more shrinkage. On the other hand, when air conditions are extreme resulting in high values of BiM (i.e. very
low air relative humidity, high temperature or high air velocity) a dry layer quickly forms at the surface of the particle, this dry layer have lower or no elasticity, thus hindering shrinkage of the sample. The ‘case hardening’, a phenomenon which appears during drying under sturdy air-drying conditions is a clear example of this behaviour. This interpretation has been somehow confirmed by the studies in shrinkage during drying of osmosed dehydrated apples (del Valle et al., 1998), where it was observed that some protection against shrinkage during air-drying was brought by sugar infusion during pretreatments with osmotic dehydration solutions at high solute concentration. Bui et al. (2009) showed through mathematical modelling that the sugar profile inside a tomato particle being osmotic dehydrated at 70oBrix, presents an inflexion point at longer processing times which is not observed for lower solution concentrations or at lower infusion times. Thus, at the interface zone, accumulation of sucrose was more rapid at higher solution concentrations and consequently, a solute layer at the interface was probably formed, giving place to a barrier for mass transfer. This phenomenon was previously observed experimentally by some authors (Giraldo et al., 2003; Lenart and Flink, 1984). The solute layer has been also used for explaining sucrose penetration resistance (Souza et al., 2007). Recently, Gulati and Datta (2015) demonstrated through comprehensive mathematical modelling that a higher drying rates, material shrinkage is restricted by the rapid formation of a glassy layer on its surface. This dry layer having poor elasticity might provide the necessary mechanical strength to the particle against shrinkage during air-drying, as happens in the case of high BiM (case hardening).
Figure 1.3 Moisture profiles during air-drying at low (a) and high (b) Biot mass numbers.
!)##$%&!'(
)*)##ℎ(,ℎ##'(
)X
cX
iX
ip
wip
woop
wip
wooMathematical modelling of shrinkage has been extensively reviewed by Mayor and Sereno (2004). In this article, the authors described both linear and non-linear empirical fitting as well as fundamental models to represent volume change during drying. Based on two physical mechanisms (collapse and shrinkage phenomena), other mathematical models were lately developed to accurately predict porosity (Khalloufi et al., 2009), density (Khalloufi et al., 2010) and shrinkage coefficient (Khalloufi et al., 2012) during drying.
In air-drying, shrinkage is isotropic during the beginning of the process. However, after 20-30% of the total drying time has passed, reduction of volume is usually accompanied by wrinkles, deformation, and even change in color, indicating shrinkage heterogeneity and collapse of air-dried products. The collapse phenomenon occurs when the solid matrix of the foodstuff can no longer support its own weight, leading to drastic structural changes shown as a marked decrease in volume, increase in stickiness of dry powders, loss of porosity, etc. (Chuy and Labuza, 1994; Levi and Karel, 1995; Roos, 1995). In cellular foods, collapse during drying takes place when the natural turgidity of product is lost and cannot be restored. It is an irreversible phenomenon affecting not only the drying process but also the physical and chemical characteristics of dehydrated material (del Valle et al., 1998; Karathanos et al., 1993). A more detailed description of collapse during air-drying and its relationship with glass transition will be given in the following section.
1.3 Air-drying and glass transition
1.3.1 Glass transition definition and generalities
Glass transition temperature, Tg, can be defined as the temperature at which an amorphous system changes from the glassy to the rubbery state. This property is of great importance for food processing and stability. Only few concepts which are particularly important for this chapter will be given in this section. The reader is invited to refer to other chapters of this book or elsewhere in the literature for additional information.
Glass transition temperature depends on moisture content and composition, among other important variables. Gordon and Taylor (1952) presented an equation that appropriately predicts the glass transition temperature of foods:
𝑇( =
𝑥- 𝑇𝑔-+ 𝑘 𝑥8 𝑇𝑔8
𝑥-+ 𝑘 𝑥8 (2) where
x
1 ,x
2 , Tg1 and Tg2 are the mass fraction and glass transition temperature of solidsand water, respectively, and k is a fitting constant of the model. From Eq. (2), Tg is shown to increase with solid fraction and thus, an increase of glass transition temperature of the product is reached as a function of drying extent.
Williams et al. (1955) have developed a law that takes account of variations in the viscosity of amorphous polymers as a function of temperature. This law (called WLF) is applied when the temperature is in the region of the glass transition:
ln 𝜇 𝜇( =
−𝐶- 𝑇 − 𝑇( 𝐶8+ 𝑇 − 𝑇(
(3)
where µ and µg, is the viscosity of the product at temperature T and at Tg, respectively, and C1 and C2, universal constants. Sopade et al. (2003) showed Eq. (2) to be suitable for
representing the rheological behavior of Australian honeys between the glass transition and Tg + 100oC. In agreement to other researchers, they reported that C
1 and C2 constants were
different from universal values. According to Levine and Slade (1992), the WLF equation can be used to predict the sudden change in the diffusion coefficient in the glass transition area. Peleg (1996) pointed out that many published data showed a good fit of the WLF model to experimental data, although the viscoelastic properties of the product in relation to glass transition should be better described by Fermi’s equation.
1.3.2 Moisture transport and glass transition
The so-called Fick’s second law is in fact a mass balance in a non-permanent state, where diffusion within the control volume is expressed in terms of Fick’s diffusion law:
(Ratti, 2001). However, the molecular diffusion in a solid would follow Fick’s law probably only when the matrix is in rubbery or glassy states, sufficiently far from the glass transition region. In the vicinity of glass transition, the flow behavior becomes “non-Fickian” (Kim et al., 1996; Singh et al., 2003; Thomas and Windle, 1980). Substantial experimental research in polymer and food sciences showed that glass transition plays a critical role in affecting the liquid distribution profiles inside a solid (Singh et al., 2003; Takhar, 2008; Watanabe et al., 2001; Xing et al., 2007). Hence, a more general approach is highly desired to describe transport of compounds during air-drying in materials undergoing glass transition (Alfrey et al., 1966; Kim et al., 1996; Singh et al., 2003; Takhar, 2008; Thomas and Windle, 1982; Watanabe et al., 2001).
Fish (1958) reported that during isothermal water sorption in starch gels, water diffusion characteristics were "normal" when the water content was high, however, at lower water levels, diffusion coefficient decreases suddenly with water content. In another diffusion study at temperatures close to the glass transition temperature of a fluorescent marked molecule in a sucrose solution, mobility of this molecule was not simply coupled to the viscosity of the diffusion medium as theoretically predicted by Fick’s law (Champion et al., 1997). Heldman and Singh (1981) confirmed that in air-drying, moisture diffusion coefficient is only constant until a water content value of about X = 0.15 kg water/kg dry solids, which corresponds to the moment when the product exceeds the glass transition during air-drying. Marousis et al. (1991) also supposed that water diffusion behavior is related to the state of the product, and thus at very low moisture contents (X<0.1), water diffusivity decreased sharply due to the lower mobility of the strongly adsorbed water, and to the increasing difficulty of the molecule to move to the product surface in a glassy matrix. To solve Eq. (4) it is commonly supposed that the diffusion coefficient is constant, which from the above evidence certainly it is not. Many researchers have thus found good correlations between water diffusion coefficient and water content during air-drying (Karathanos et al., 1990; Ribeiro et al., 2003; Ruiz-Cabrera et al., 2005). However, the water transport mechanism cannot be predicted by Fick’s law even if the diffusion coefficient is defined as a function of water concentration (Ribeiro et al., 2003).
According to Kim et al. (1996), the relaxation achieved when the temperature is above the glass transition temperature of the product occurs so fast that the transport process is governed mainly by the concentration gradient within the system. In such case, the concentration profiles are similar to those predicted from classical Fickian diffusion, with quadratic profiles smoothly concave from the polymer interface to a higher solvent concentration at the sample center. As the temperature decreases to the vicinity of the glass transition, the transport behavior changes because of the significant concentration dependence of the diffusion coefficient, as well as due to the increase in the mechanical relaxation. When the glassy to rubbery state transition occurs, discontinuous stress profiles are formed. The polymer stress gradient provides negative driving forces to the solvent transport against the chemical potential gradient and this led to an anomalous transport behavior (Kim et al., 1996). By comparing average moisture, moisture profiles and product temperature at a given instant during air-drying, Takhar (2008) pointed out by that different sub-regions of the food may be glassy, rubbery or in glass transition state even if the entire food matrix exist in a specific mechanical state in an average sense. Since water evaporates from the product surface, a glassy layer could form at the outside of the product separated from the rubbery layer by the glass transition zone. In the region of the glass transition, the moisture profile of the product becomes non-quadratic. Figure 1.4 shows a schematic example of the anomalous moisture profile that could be found in a particular case when glass transition happens during drying, and compared to the case when the whole matrix is in rubbery state. This glassy layer at surface of the product during air-drying forms a barrier pointing out a reason for this anomalous moisture transport. Several studies reported that the existence of a skin at the surface of a sample resulted in water transport against the moisture content gradient during drying or cooking (Gögˇüs and Maskan 1998; Jin et al., 2012; Van der Sman, 2007). As an example, the peel left at the surface of a fresh broccoli being air-dried resulted in moisture contents at the sample center to rise far above the initial moisture content at any location, which conflicts with Fickian diffusion. However, the diffusion of water in peeled broccoli was Fickian (Jin et al. 2012). It is also likely that the product skin
Figure 1.4 Moisture and temperature profiles during air-drying without (a) or with (b) glass transition happening during the process.
To study the effect of glass transition on Fickian and non-Fickian modes of moisture transport during air-drying, it is crucial to determine moisture profiles in the food sample during drying. However, the difficulty in measuring with accuracy moisture profiles within a solid sample makes excruciating the task of comparing mass transfer model predictions to real data of water distribution inside the product (Xing et al., 2007). Slicing the solid in small thickness along the distribution axis, and measuring the water content of each slice by either freeze or vacuum drying was one of the first techniques used to provide information about moisture distribution inside product. However, this is not an accurate method because from the difficulty to cut the food with high precision; some water is lost as well in contact with the slicing equipment (Xing et al., 2007). Other non-destructive techniques such as Time-Domain Nuclear Magnetic Resonance (TD-NMR), X-ray microscopy, Near Infrared Reflection (NIR) and Magnetic Resonance Imaging (MRI), have emerged as promising techniques for obtaining moisture profiles in foods (Castell-Palou et al, 2011; Léonard et al, 2005; Wählby and Skjoldebrand, 2001). From the previous methods, MRI has been the most widely used by now, since in addition of being non-invasive, it allows the determination of moisture profiles in the same sample continuously without destroying the structure or modifying the physical properties of materials (Jin et al., 2012; Schrader and Litchfield, 1992; Xing et al., 2007).
Schrader and Litchfield (1992) studied water transport in a model food gel in the course of room-temperature drying. They compared experimental moisture profiles obtained using MRI method, to the profiles from finite difference simulation of a Fickian diffusion equation. Actual moisture profiles obtained by MRI depicted in Figure 1.5 (adapted from Schrader and Litchfield, 1992) were much flatter near the center of the cylinder, with a steeper moisture profile near the edge, compared to the typical parabolic shape of the Fick’s law. As reported by the author, the moisture profiles obtained in this drying study are very similar in shape to
drying was applied at a temperature far from glass transition. As the drying temperature approached the glass transition temperature, the moisture profiles became sharper, which is a characteristic of non-Fickian transport.
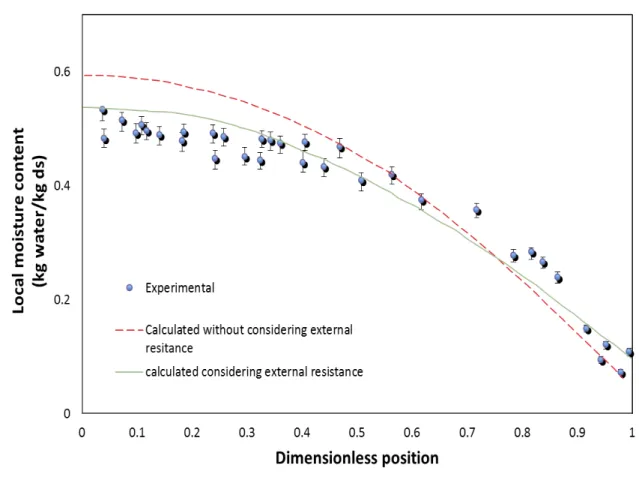
Recently, Castell-Palou et al. (2011) proposed to use a time-domain nuclear magnetic resonance method to determine moisture profiles at different process times during cheese drying. These authors compared the moisture profile obtained by this method to a diffusion model based Fick’s law (Eq. (4)) considering internal or external resistance to mass transfer as one of the boundary conditions. Figure 1.6 shows the predictions compared to internal moisture profile data presented in this article (Castell-Palou et al., 2011). As can be seen from this Figure, the fact of including external resistance in the mass transfer model improves the predictions in the moisture profile central zone. However, close to the surface, experimental data have a sharper moisture profile compared to the typical parabolic shape of the Fick’s law.
Figure 1.5 Signal intensity profiles of a model food gel during room temperature drying (adapted from Schrader and Litchfield, 1992).
Figure 1.6 Experimental and calculated local moisture content vs dimensionless distance from the center of the sample during drying (adapted from Castell-Palou et al., 2011).
1.3.3 Shrinkage and glass transition
A change in slope of the shrinkage curve may happen during air-drying, as shown before for some particular food materials (i.e. potato in Figure 1.2) and under specific drying conditions. Researchers studying shrinkage of banana and papaya have related this change in slope to the moment when the sample undergoes glass transition (Katekawa and Silva, 2007; Kurozawa et al., 2012), which usually happens at the end of air-drying, as the temperature of the product could be positioned below the glass transition temperature of the product. In these last moments of air-drying, the whole matrix becomes glassy with limited movement, and thus shrinkage could be hindered. Figure 1.7 is a schematic representation of temperatures profiles of the sample (Tp) during drying at increasing air temperatures (1 to 4 in increasing
order), together with the glass transition temperature of the product (Tg). In this Figure, the temperatures are ideally represented as a function of the average moisture content of the sample, with the supposition that uniformity of moisture profiles inside the sample applies. From Figure 1.7, it can be observed that in the case of lower air-drying temperatures, the product profile temperatures (i.e. Tp1 and Tp2) are below the glass transition temperature up
to a certain critical moisture content (Xc1 and Xc2, respectively) when glass transition occurs.
This critical moisture content should decrease as drying temperature increases. In the case of higher air-drying temperatures (i.e. curves 3 or 4 in Figure 7), the product temperature is always below the glass transition temperature and thus, it should be in rubbery state throughout the whole drying process. Katekawa and Silva (2007) working with banana slices of 4mm thickness and 20mm diameter, and drying at 30oC and 0% relative humidity, reported a critical moisture content (when sample stops shrinking due to the impact of glassy matrix) of 0.07 g/g. These authors also showed that drying temperature had a significant impact of shrinkage; higher temperatures above glass transition induced higher extent of shrinkage in banana slices, attributed by the authors to the higher mobility of the matrix. Kurozawa et al. (2012) in a study of drying and shrinkage of 20mm papaya cubes at 40 and 70oC air
al. (1998) studying drying at different air temperatures of osmosed apples (7.8mm diameter, 23.7mm length cylinders), found higher shrinkage when T(T-Tg) was 74oC (air-drying temperature of 20oC) and a more limited shrinkage for Ts higher than 104oC. These authors stated that the use of high temperatures may allow rapid conditions of glassy state at the product surface, thus ‘fixing’ the geometry of the product. As well, Wang and Brennan (1995) showed similar tendency when drying potato (slabs with a 10mm thickness, 45mm length and 20mm width) at 40 and 70oC, the degree of shrinkage at a low drying temperature was greater than at a high temperature.
A possible explanation to these incongruences about the interpretation of shrinkage and glass transition could be related to an incorrect comparison of temperatures based on average moisture contents, not taking into account the moisture profile in the sample. As said before, Figure 1.7 shows an ideal case where uniformity of moisture within the sample has been supposed, while in reality, samples with thickness higher than 3mm should have a noticeable internal moisture profile during drying as well as increased Biot numbers for mass transfer (Eq. (1)). Further research studies on food samples having small characteristic thicknesses, or else by mapping rubbery/glassy regions within the sample taking into account its moisture profile during drying, are proposed to complete the understanding on shrinkage and glass transition.
Figure 1.7 Graphical representation of product (Tp) and glass transition (Tg) temperatures during drying of a particle with hypothetical uniform moisture content, at different air
1.3.4 Collapse
Collapse of cells and pores resulting from moisture reduction during drying is one of the main problems to be solved in order to achieve good quality dried food. These issues are particularly critical if the food temperature is higher than its collapse temperature, which in turn is related to the glass transition temperature (Rahman, 2003). Collapse temperatures are 10-20oC higher than glass transition temperatures (Roos, 1995). But also, collapse is a time-temperature phenomenon (Gerschenson et al., 1981; Tsourouflis et al., 1976), and thus in the case of air-drying this is a crucial factor as the product temperature is above Tg almost for the whole drying process (Ratti, 2001).
Collapse has a key impact on the structure and texture quality of air-dried food products. The structure properties of the initial product are lost due to the modification of cell structure, reduction of pore numbers and dimension, as well as changes in pore shape. These modifications lead to decrease in volume of product, porosity, uneven thickness, wrinkles surface and deformation of dried foods (Rahman, 2003; Ratti, 2001). In addition, high temperature and porosity reduction during air-drying cause stresses in the cellular structure of the material, consequently leading to product hardness and loss of crispness (Attenburrow and Davies, 1993). Surface cracking may also happen during the course of drying when product shrinkage is not uniform leading to stress and failure of the material (Mayor and Sereno, 2004).
Collapse induces also several changes altering the chemical aspects of dehydrated materials such as stability of lipid oxidation, non-enzymatic browning and glucose loss. Amorphous glassy matrices can encapsulate lipids protecting them from oxidation, but oil released from the cells due to collapse increases lipid oxidation, whereas oil trapped within the collapsed matrix is less likely to be oxidized because oxygen diffusion is limited (Gejl-Hansen and Flink, 1977; Labrousse et al., 1992). Harnkarnsujarit and Charoenrein (2011) showed that β-carotene degradation rate decreased due to porosity collapse and the lower oxygen diffusion through the compacted matrix. Similarly, Ma et al. (1992) found that oxidation of limonene encapsulated with maltodextrin was inhibited upon collapse of the system, again because oxygen could no longer diffuse freely through pores of the matrix. Nevertheless, the protective effect against oxidation may not exist in products with cracked surface. Such
systems showed similar oxidation rates as non-collapsed systems. Cracking on mango surface has the potential to allow high oxygen penetration through the solids thus promoting β-carotene loss (Harnkarnsujarit and Charoenrein, 2011).
The occurrence of collapse and color changes in grapefruit juice powder were reported to be related to glass transition temperature whereas intense color changes were observed only when T−Tg ≈ 30°C, which is very close to the collapse temperature (Telis and Martinez-Navarrete, 2009). Non-enzymatic browning affected by glass transition has been also studied and discussed in relation to collapse (Gejl-Hansen and Flink, 1977; Karmas et al, 1992). However, White and Bell (1999) reported that collapse had minor impact on browning rate constants in solid low-moisture model food systems. Also, glucose loss rate constants were lower in collapsed systems compared to non-collapsed systems.
Collapsed systems exhibit poor rehydration capacity and poor aroma retention. This was particularly significant in case of air-drying of plant tissue (Anglea et al., 1993; Tsourouflis et al., 1976). Jayaraman et al. (1990) studying the air-drying of cauliflower reported the inability of the plant tissue to fully rehydrate and attributed this fact to dense and collapsed structure of the dried material with collapsed capillaries. A rapid collapse was reported in air-dried apples and carrots at the beginning of the rehydration process leading to drastic structure damage and great reduction of product volume compared to the initial dried product (Witrowa-Rajchert and Lewicki, 2006). In contrast, a lack of structural collapse and a continuous increase of the cube size were observed for dried potato cubes (Lewicki et al., 1997; Witrowa-Rajchert and Lewicki, 2006) during rehydration. Collapse during rehydration could be due to phase changes in food constituents, or by the inadequate setting of the rehydration temperature, which can be explained in relation to the glass temperature of the product. Increasing water bath temperature over the glass-transition temperature could reduce the water uptake because of matrix collapse during rehydration (Meda and Ratti,
extensive loss of the volatile compounds entrapped in the product (Chirife and Karel, 1974; Tsourouflis et al., 1975).
All the aforementioned physical changes certainly create new properties that are, in most cases, undesirable. Nevertheless, product with lower porosity prevents moisture reabsorption and has lower volume, which does not require special storage or transport requirements and thus, products with special characteristics for specific long-term use applications could be created (Rahman, 2007). Some dried products may require a traditional shrunken aspect as well, a criterion for the consumer of raisins, dried plums, dates, etc. (Mayor and Sereno, 2004).
1.3.5 Mathematical modelling
A theory of diffusion in a viscoelastic medium (Lustig et al., 1992) predicts that several gradient forces such as temperature gradient, species inertial and body forces acting on the compounds, together with chemical potential and stress gradients, are necessary to simulate solvent flux penetration into polymers (Kim et al., 1996). In the case of air-drying of foods, Singh et al. (2003) proposed a model to complete Eq. (4), which can be applied to both Fickian and non Fickian moisture diffusion modes. According to the author, a time-dependent stress term resulting from viscoelastic relaxation of polymers is responsible for causing anomalous transport near glass transition. As explained before, in the glassy and the rubbery region, the polymers relax at a slower rate or a faster rate as compared to the diffusion rate. This polymer-fluid interaction results in an additional stress term that opposes or enhances the fluid movement depending upon the state of the food and direction of fluid motion. The equation including the effect of viscoelastic relaxation can be written as (Takhar, 2008): 𝑑𝜑2 𝑑𝑡 + 𝜑2− 1 ∇ 𝐷122 ∇𝜑2 − 𝜑2− 1 ∇ 𝐵F G H 𝐺 𝑡 − 𝜏 𝛻𝑑𝜑 2 𝜏 𝑑𝜏 𝑑𝜏 = 0 (5) where j fis the volume fraction of the fluid, (dj f /dt) is the material time derivative calculated with respect to the solid phase particles, Deff is the Fickian effective diffusion coefficient,
Recently, Gulati and Datta (2015) developed a complete mechanistic model for moisture transport and particle deformation during air-drying, which was applied to the case of potato air-drying. In this model, rubbery/glassy transition and mechanical and transport properties as a function of moisture and glassy/rubbery states, are taken into account. This comprehensive mathematical model is capable of explaining the different experimental observations mentioned in the present chapter. We strongly recommend this research work to the reader for further in-depth information on the subject.