An efficient global methodology for hazard analysis of dam complexes and
cascades
B. J. Dewals1,2, P. Archambeau1, S. Erpicum1 & M. Pirotton1 1 Department ArGEnCo, University of Liege, Belgium,
2Fund for Scientific Research F.R.S.-FNRS
Abstract
Hazard analysis of dams arranged in a complex or cascade may involve the assessment of a large number of different scenarios of combined failures. However, a tremendous computation time would be needed to perform a detailed modelling of the flows generated by all possible scenarios. Therefore, the present paper describes a methodology for analysing the flows induced by the most relevant incidents occurring on a complex or in a cascade of dams and reservoirs.
The methodology combines several hydrodynamic models, including the two-dimensional flow solver WOLF 2D and a simplified lumped hydrodynamic model, to simulate (i) the flows induced on the dams complex, (ii) the potential breaching in the cascade of other dams, as well as (iii) the propagation of the flood wave in the whole downstream valley. The application of the methodology to a practical case study involving a complex of five dams is also described.
Keywords: dam break, dam breaching, hydrodynamic modelling, finite volume, risk analysis, breach parameters, sensitivity analysis.
1 INTRODUCTION
Flood waves induced by catastrophic events such as a dam break or a dam breaching are regularly studied in the framework of risk analysis procedures. The assessment of this risk, mathematically evaluated by the product of the probability of a failure and the potential damage in such an event, involves the identification of inundated areas as well as water depths and flow velocities of the induced wave.
Besides such extreme failure events, other types of dysfunctions may also occur on a dam site (e.g. failure of penstocks, valves ...) and are able to induce major damages in the downstream valley. Generally, those events are even characterized by a much higher probability of occurrence than the total collapse of the dam. Therefore studying the consequences of this type of system breakdown is also necessary to obtain a reliable picture of the global risk associated to particular hydraulic structures.
Moreover, when such incidents take place on a complex of dams, additional specificities must be taken into consideration [14], such as failures in cascade. Indeed, the waves generated by one failure are likely to affect other dams of the complex and may induce their subsequent collapse or breaching. As a consequence, risk analysis in such a case requires a holistic vision at the scale of the complex. Nevertheless, a prohibitive computation time would be needed to perform complete 2D simulations of the flows generated by all possible scenarios of dysfunctions on a complex. Therefore, a rational methodology for analyzing a complex or a cascade of dams is presented in this paper.
The proposed methodology (section 2) includes four steps, from the identification of the most significant individual scenarios of failure or dysfunctions (§ 2.1) to the computation of the hydraulic impacts on the reservoirs (§ 2.2), on other dams located downstream (with possible overtopping and failure in cascade, (§ 2.3) as well as in the whole downstream valley (§ 2.4).
At each stage, guidelines are provided to select the most appropriate hydrodynamic modelling tool to compute efficiently the induced flows. The procedure typically combines two complementary flow models, which are briefly described in section 3. The first one is the two-dimensional flow solver WOLF 2D (§ 3.1), while the second one is a simplified lumped model (§ 3.2), requiring very low computation time,
Finally, the paper describes the overall application of the model to a practical case study involving a large gravity concrete dam located upstream of a complex of four other dams (section 4).
2 PROCEDURE FOR THE ANALYSIS OF DAM COMPLEXES AND CASCADES
The proposed four-step methodology for analysing a complex or a cascade of dams is summarized by the flow chart displayed in Figure 1. The method basically relies on a twofold approach to evaluate the impact in the downstream valley of failures on a complex [14]:
• first the hydrographs potentially released immediately downstream of the complex are determined for all possible individual failure scenarios (step 1 and step 2) and considering possible failures in cascade (step 3); • second, the inundation in the downstream valley (step 4) is only simulated for some selected hydrographs released downstream of the complex.
These hydrographs are selected either for the high danger they represent or for the high probability of occurrence associated to them, in such a way that the set of selected hydrographs properly represents the overall pattern of possible consequences induced by all the potential conditions of failure. The danger induced by a particular released hydrograph is evaluated considering not only the peak discharge but also the total amount of water involved.
2.1 Step 1 - Identification of possible individual failure
Step 1 consists in identifying all the possible individual failure scenarios. Therefore, each dam or structure is reviewed and, by means of expert judgment and consultation with the dam owner, the possible malfunction or failure mechanisms are defined in accordance with ICOLD's recommendations.
2.2 Step 2 - Hydraulic impact on the complex or cascade of dams
Step 2 involves the computation of induced flows on the complex or cascade of dams, while the hydraulic impact in the downstream valley is only considered at step 4. Step 2 must be executed with the most appropriate
hydrodynamic modelling approach, depending on the type of flow induced on the complex of dams. As detailed in Figure 1, a 2D dynamic modelling approach (section 3.1) is required for rapidly varying flows, involving the propagation of stiff fronts, while a lumped model (section 3.2) may be applicable if flow characteristics vary gradually. In some specific geometrical configurations (relatively long and narrow reservoir), 1D modelling may also provide a suitable compromise.
2.3 Step 3 - Impact on downstream dams and structures
On the basis of these first hydrodynamic results, the hydrodynamic load on the dams and structures located downstream is characterized and subsequently the behaviour of those structures can be deduced. If the structure downstream is expected to sustain the overtopping flow and provided that the flow variations remain sufficiently gradual, the lumped hydrodynamic model is used to compute directly the hydrograph released downstream. For more complex hydrodynamic conditions, the lumped model is replaced by its 1D or 2D counterpart. If the structure downstream fails or is breached as a result of extreme overtopping flow, the prediction of the flow released downstream may only be undertaken by a single computation simulating the flows upstream in the reservoir, through the breach and in the downstream valley. In this case, steps 2, 3 and 4 of the methodology merge into one unified simulation. Therefore, the breach parameters such as final width and formation time, must be characterized. Due to the significant uncertainty affecting those parameters, performing a sensitivity analysis is extremely useful at this stage. After proper calibration, the lumped model represents an efficient flow solver to carry out such sensitivity analysis.
2.4 Step 4 - Hydraulic impact in the downstream valley
Finally, the flow in the downstream valley is simulated by means of the 2D model. As mentioned above, this final simulation covers either the downstream valley only, if the crest of the most downstream structure of the complex remains a control section; or the upstream reservoirs and the downstream valley, if no control section remains as a result of failure of the most downstream dam.
duration released flow (see examples in section 4).
Figure 1: Flow chart describing the methodology for analysis of dam complexes.
3 HYDRODYNAMIC MODELS
The HACH research unit from the University of Liege develops numerical tools for simulating a wide range of free surface flows and transport phenomena. Those computational models are interconnected and integrated within one single modelling system named WOLF, which enables the simulation of process-oriented hydrology [2], 1D [13] and 2D hydrodynamics, sediment [3, 4] or pollutant transport, air entrainment [1], turbulence (incl. a k-ε closure [13]) ... as well as optimisation processes (based on Genetic Algorithms) [13]. Other functionalities of WOLF include the use of moment of momentum equations [5], analysis of flow
instabilities [10], as well as computations considering vertical curvature effects [5, 7]. Among those computation units, the two-dimensional flow model WOLF 2D will be more comprehensively described hereafter, as well as a simplified lumped hydrodynamic model. Although other modelling approaches may be combined within the
global procedure, only those two models will be further exploited in the subsequent application (section 4).
3.1 Two-dimensional model
The two-dimensional model is based on the depth-averaged equations of volume conservation and of momentum conservation, namely the "shallow-water" equations. The large majority of flows occurring in rivers, even highly transient ones such as those induced by dam breaks, can reasonably be seen as shallow everywhere, except in the vicinity of singularities (wave tip). The divergence form of the shallow-water equations may be written:
where Einstein's convention of summation over repeated subscripts has been used (i = x, y). z b represents the bed
elevation, h is the water depth, qi designates the specific discharge in direction i, Sfi is the friction slope and δij
the Kronecker symbol. The friction term is conventionally modelled thanks to an empirical law, such as Manning formula.
The space discretization of the 2D conservative shallow-water equations is performed by a finite volume method. Flux evaluation is based on an original flux-vector splitting technique, the stability of which has been
demonstrated theoretically by means of a Von Neumann stability analysis [5]. WOLF 2D deals with multiblock structured grids. A grid adaptation technique restricts the simulation domain to the wet cell and the model handles wetting and drying of computation cells free of mass conservation error [13]. Since the model is applied to transient flows, the time integration is performed by means of a second order accurate and hardly dissipative explicit Runge-Kutta algorithm.
WOLF 2D has been extensively validated by comparisons with experimental data, field measurements and other numerical models. Among others, benchmarks from EU Projects such as IMPACT have been tested successfully. This validation process has been documented in previous papers [11, 12].
3.2 Lumped model
A simplified modelling approach suitable for reproducing the behaviour of reservoirs consists in exploiting a lumped model, based on the volume balance only. Important simplifications are introduced in such an approach compared to the 2D model. Indeed, the free surface of the reservoir is assumed to remain almost horizontal and neither inertia nor friction effects are taken into account.
The topography is depicted globally through the stage-capacity curve of the reservoirs. Inflow discharges must be provided, expressed as a function of time and/or of the water level. Outflow characteristics (e.g. control section with given crest level, crest width and discharge coefficient ...) are also required as input data of the model, while the outflow hydrograph itself is a computation result.
While the two-dimensional model is based directly on the resolution of the depth-averaged equations expressing the conservation of volume and momentum along both directions x and y, the lumped model solves only the conservation of volume integrated on the whole surface Ωi (m2) of the reservoir i:
where Γi represents the contour of the reservoir, Vi is the total volume, as sketched on Figure 1(a). Qi,in and Qi,out
(m3/s) designate respectively the inflow and outflow discharges and N
Figure 2: Sketch of a general reservoir and idealized 1D representation.
The second formulation of equation (2), expressed in terms of stored volume and exchange discharges, constitutes the simplified lumped model for one reservoir. One equation of this type must be used for each reservoir of a complex. Of course, the formulation (2) of the model can also be written in terms of the water level Zi (m) in the reservoir i, since the stage-capacity curve provides a univocal relationship between these two
unknowns. The set of equations (2) constitutes a system of NR ordinary differential equations, which are solved
using an explicit time integration scheme. The validity of this lumped model may be evaluated a priori by means of two non-dimensional parameters, which are discussed by Dewals et al. [9] considering an intermediary 1D idealized representation of the reservoir as sketched in Figure 1(b).
4 APPLICATION: HAZARD ANALYSIS OF A COMPLEX OF FIVE DAMS
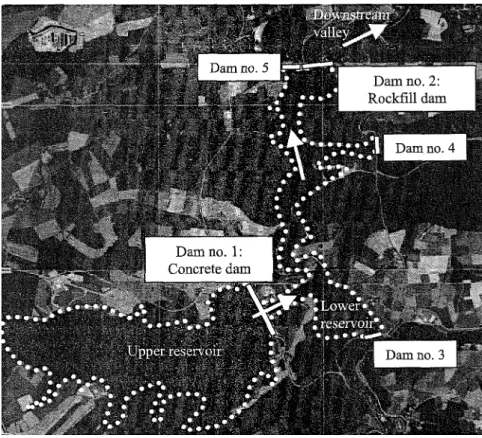
As a case study, the methodology described above has been applied in the framework of a complete risk analysis process of an important complex of dams. The main one (dam no. 1), a 50 m-high concrete dam, is located upstream of a complex of four other dams, including a 20-meter high rockfill embankment (dam no. 2). Figure 3 illustrates the global configuration of the complex of dams. As a consequence of this layout, the hypothetical failure of any of the upstream dams (particularly dam no. 1) is likely to induce other dam breaks in cascade. Therefore the risk analysis of the complex must definitely be performed globally and not simply for each dam individually.
In the following paragraphs, the analysis of the three following individual failure scenarios is briefly described in accordance with the overall procedure depicted in Figure 1 :
• scenario 1 : collapse of the spillway of dam no. 2; • scenario 2: failure of penstocks at dam no. 1; • scenario 3: total collapse of dam no. 1.
For each scenario, Table 1 summarizes the main steps of the analysis, details the space and time discretization and states the type of coupling considered.
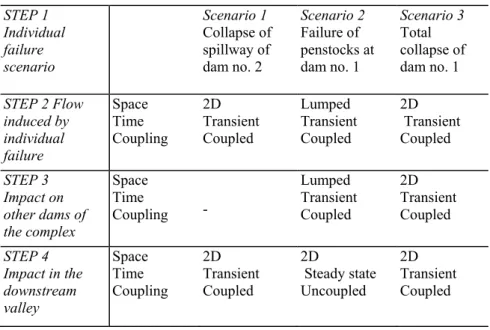
Table 1: Summary of the application of the analysis procedure for the case study.
STEP 1 Individual failure scenario Scenario 1 Collapse of spillway of dam no. 2 Scenario 2 Failure of penstocks at dam no. 1 Scenario 3 Total collapse of dam no. 1 STEP 2 Flow induced by individual failure Space Time Coupling 2D Transient Coupled Lumped Transient Coupled 2D Transient Coupled STEP 3 Impact on other dams of the complex Space Time Coupling -Lumped Transient Coupled 2D Transient Coupled STEP 4 Impact in the downstream valley Space Time Coupling 2D Transient Coupled 2D Steady state Uncoupled 2D Transient Coupled
4.1 Scenario 1: collapse of the spillway of dam no. 2
In scenario 1, the concrete spillway of the most downstream rockfill dam is supposed to collapse
instantaneously. There is obviously no impact on other structures or dams of the complex and step 3 of the methodology may be skipped, while steps 2 and 4 merge into one 2D dynamic modelling, coupling the simulation of the flow in the lower reservoir and in the downstream valley.
4.2 Scenario 2: failure of penstocks at dam no. 1
According to scenario 2, penstocks are supposed to break down between dam no. 1 and its hydroelectric power plant located at its toe. Such a failure may result from material or weld defect, or from sabotage.
Since the discharge released from the upper reservoir into the lower reservoir leads to relatively gradual flow motions in the reservoirs, the lumped hydrodynamic model is exploited for step 2 of the methodology. The simulations are based on two coupled equations of the form of (2), each one governing the evolution of the free surface in one of the two main reservoirs. As a result, the hydrographs of the flows overtopping each of the downstream dams (no. 2 to no. 5) are obtained and enable to deduce that those downstream dams are very unlikely to fail in cascade (step 3). Finally, the hydraulic impact in the downstream valley is computed by means of a 2D simulation covering only the downstream valley, since the crest of the most downstream dam (dam no. 2) remains a control section resulting in a decoupling of the flows upstream and downstream of dam no. 2. Besides, as a result of the relatively smooth hydrograph released, the approximation of a steady flow in the valley has been shown to be valid.
4.3 Scenario 3: total collapse of dam no. 1
In accordance with ICOLD's recommendations, the failure dynamics of the total collapse of dam no. 1 is expected to be instantaneous.
By means of a 2D hydrodynamic modelling, involving over 400,000 computation cells, the detailed propagation of the waves induced on the lower reservoir has been simulated. This computation provides the characteristics of the overtopping waves reaching the downstream dams and reveals dramatic hydrodynamic loads acting on them. For the concrete dams (no. 3 and no. 4), evaluating the resultant forces and moments they undergo confirms that they are most likely to fail. Therefore, by means of a time-dependant topography implemented in the final simulation (step 4), dams no. 3 and no. 4 will be progressively removed from the topography once the computation detects that they are overtopped, hence representing their collapse in cascade triggered by the hydrodynamic waves reaching them. On the contrary, embankment dam no. 5 is supposed not to be breached considering that the hydrodynamic loads are significantly weaker than for dams no. 3 and no. 4. As regards the downstream rockfill dam (dam no. 2), it is expected to be breached by the overtopping flow and the proper breach parameters have been estimated on the basis of several empirical formulae [6]. The breaching mechanism is also introduced in the simulation by means of a time-dependant topography: once the computation code detects the overtopping, it triggers a time evolution of the local bed elevation in the topography matrix, according to the breach parameters previously defined, representing a very realistic breaching mechanism. Since significant uncertainties remain regarding the breach parameters, an extensive sensitivity analysis has been carried out (based on the lumped hydrodynamic model) and demonstrates in particular that the sensitivity of the released hydrograph with respect to the breach formation time remains extremely weak, as a result of the large amount of water stored in the reservoirs [8].
Finally, a global transient 2D simulation has been carried out, coupling the flows in the reservoirs and in the whole downstream valley. The simulation mesh is based on a grid of about 900,000 potential computation cells. The obtained results enable to plot essential hazard maps as well as hydrographs and limnigraphs at a number of strategic points downstream of the dams (urbanized areas, bridges, ...), which constitute the key input for the subsequent stages of the risk analysis process.
5 CONCLUSION
In conclusion, based on both theoretical developments and numerical studies, the paper provides new advances of practical relevance for dam break risk analysis.
Indeed, the global methodology developed addresses the main issues related to the analysis of failures and malfunctions on a complex or cascade of dams, such as dealing with possible (gradual) failures induced in cascade, combining efficiently several hydrodynamic modelling tools (incl. 2D dynamic model and lumped model), or conducting relevant sensitivity analysis ...
References
[1] André, S., B.J. Dewals, M. Pirotton & A. Schleiss, Quasi 2D-numerical model of aerated flow over stepped chutes, in Proc. 30th IAHR Congress, J. Ganoulis and P. Prinos (eds). Vol. D. 2003, IAHR: Thessaloniki, Greece, p. 671-678. [2] Archambeau, P., Contribution à la modélisation de la genèse et de la propagation des crues et inondations. 2006, PhD thesis, University of Liege.
[3] Dewals, B., P. Archambeau, S. Erpicum, T. Mouzelard & M. Pirotton. Coupled computations of highly erosive flows with WOLF software, in Proc. 5th Int. Conf. on Hydro-Science & -Engineering. 2002. Warsaw, Poland.
[4] Dewals, B., P. Archambeau, S. Erpicum, T. Mouzelard & M. Pirotton, Dam-break hazard mitigation with geomorphic flow computation, using WOLF 2D hydrodynamic software, in Risk Analysis III. 2002, WIT Press.
[5] Dewals, B., Une approche unifiée pour la modélisation d'écoulements à surface libre, de leur effet érosif sur une structure et de leur interaction avec divers constituants. 2006, PhD thesis, University of Liege: 636 p.
[6] Dewals, B.J., P. Archambeau, S. Erpicum, S. Detrembleur & M. Pirotton. Comparative analysis of the predictive capacity of breaching models for an overtopped rockfill dam. in. Proc. Int. Workshop "Stability and Breaching of
Embankment Dams". 2004. Oslo, Norway.
[7] Dewals, B.J., S. Erpicum, P. Archambeau, S. Detrembleur & M. Pirotton, Depth-integrated flow modelling taking into account bottom curvature. J. Hydraul. Res., 2006. 44(6): p. 787-795.
[8] Dewals, B.J., P. Archambeau, S. Erpicum, S. Detrembleur & M. Pirotton, Sensitivity analysis of the peak outflow induced by the breaching of embankment dams, in 14. Deutsches Talsperrensymposium & 7th ICOLD European Club Dam Symposium, P. Rutschmann (ed). Vol. 115. 2007, Technische Universität München. p. 86-92.
[9] Dewals, B.J., S. Erpicum, P. Archambeau, S. Detrembleur & M. Pirotton. Analysis and application of two
complementary numerical models for predicting flood waves generated by failures or dysfunctions occuring on a complex of dams, in Proc. 32nd IAHR Biennial Congress – Harmonizing the demands from art and nature. 2007. Venice, Italy. [10] Dewals, B.J., S.A. Kantoush, S. Erpicum, M. Pirotton & A.J. Schleiss, Experimental and numerical analysis of flow instabilities in rectangular shallow basins. Environ. Fluid Mech., 2008 (accepted).
[11] Dewals, B.J., S. Erpicum, P. Archambeau, S. Detrembleur & M. Pirotton, Numerical tools for dam break risk
assessment: validation and application to a large complex of dams, in Improvements in reservoir construction, operation and maintenance, H. Hewlett (ed). 2006, Thomas Telford: London. p. 272-282.
[12] Erpicum, S., P. Archambeau, B. Dewals, S. Detrembleur & M. Pirotton. Computation of the Malpasset dam break with a 2D conservative flow solver on a multiblock structured grid, in Proc. 6th Int. Conf of Hydroinformatics. 2004.
[13] Erpicum, S., Optimisation objective de paramètres en écoulements turbulents à surface libre sur maillage multibloc. 2006, PhD thesis, University of Liege.
[14] Marche, C, J. Gagnon, T.-T. Quach, R. Kahawita & P. Beauchernin, Simulation of dam failures in multidike reservoirs arranged in cascade. J. Hydraul. Eng.-ASCE, 1997.123(11): p. 950-961.